


 nueva página del texto (beta)
 Inglés (pdf)
 Artículo en XML
 Referencias del artículo
 Enviar artículo por email
 Citado por SciELO
  Similares en
SciELO
Similares en
SciELO 
 Permalink
Introduction
Propranolol, 1-[isopropylamino-3-[1-naphthyloxy]-2-propanol], is a β-adrenoceptor antagonist (β-blocker) (PRO), which is widely used in the treatment of several diseases such as cardiac arrhythmia, angina pectoris, sinus tachycardia, thyrotoxicosis, hypertrophic subaortic stenosis and hypertension [1]. It is also used in low activity sports, reducing cardiac frequency, contraction force and coronary flow. Therefore, it has been included in the list of forbidden substances by the International Olympic Committee [1,2]. Monitoring of PRO in biological fluids is important not only in clinical practice but also in the field of doping control.
PRO is a highly lipophilic substance and is almost completely absorbed following oral administration. However, most of the drug is metabolized in the liver during its first passage through the portal circulation, on average, about 25% reach the systemic circulation [3]. Plasma concentrations encountered during PRO therapy may range from a low of 1 ng mL-1 to above 100 ng mL-1[3,4].
Several methods including high performance liquid chromatography (HPLC) [5-8],gas chromatography (GC) [9], GC-mass spectrometry (MS)[9], HPLC-MS [3,10,11], electrophoresis [12] and fluorimetry [1,2,13], have been reported for the determination of PRO in biological fluids. PRO showed strong native fluorescence signals at acidic pH but in alkaline media its fluorescent was decreased. Also, fluorescence intensities of PRO in SDS micellar media are 2.4 times higher than those in water media, whereas TX-100 caused a decrease in the fluorescence intensity of the sample [13].
Using a liquid-liquid extraction (LLE) [5,6,9-11] or SPE [3,7,12] step prior to the instrumental separation and determination of analytes in biological samples has been widely used and reported in literature, because it enables the elimination of the interferences present in the urine and the concentration of the analytes. LLE methods require large amounts of organic solvents, which are harmful to humans and the environment. SPE methods have several advantages when compared with the other sample preparation techniques, including the easily of automation, more efficient separation of interferences from analytes, reducing organic solvent consumption, and more efficient in analyte recovery. Although, potential variability of SPE packing, irreversible adsorption of some analytes on SPE cartridges, and more complex method development are some of the drawbacks of this technique [14].
Recently, MSPE methods based on modification of MNPs with some ionic surfactants have been proposed for the preconcentration of a variety of organic [15-23] and inorganic compounds from various matrices [24-27]. In these SPE methods, ionic surfactants such as SDS or cetyltrimethylammonium bromide (CTAB) were adsorbed on the surface of magnetite and/or modified MNPs with silica and alumina [16-19,22-27]. Covering the surfaces of MNPs with surface active agents can improve the sorption capacity and efficiency of the extraction. The hydrophobic layers on the surface of MNPs provide suitable conditions for nonpolar components to interact with MNPs [24].
By using the MNPs modified with surfactants the limitations of microparticle sorbent can be overcome including relatively low extraction capability and time-consuming extractions with large volume samples. As a result, the use of MSPE with surfactant coated MNPs has a number of advantages, such as high extraction yields, high break through volumes and easy elution of analytes and regeneration of sorbent [15,16,20]. Moreover, high surface area of MNPs can improve the sorption capacity of analytes, as well as the strong magnetism of MNPs reduce the analysis time through the rapid isolation of MNPs with a strong magnet from large volumes of the sample solution.
In the present work, MNPs coated by SDS were synthesized according to the literature [23] and employed as new sorbent in MSPE of PRO, for the first time. The complex biological samples were cleaned-up by the proposed MSPE method and the extracted analyte determined with a simple and low-cost spectrofluorimetric method. In this method the sample preparation time is dramatically decreased by the fact that MNPs dispersed in the bulk solution, and as a result, extraction can be achieved very quickly by using magnet. Thus, biological samples can be prepared in a more safe and time-consuming manner along with sensitive, selective and low cost spectrofluorimetric determination of PRO.
Experimental
Apparatus
All fluorescence measurements were made using a Shimadzu RF-5301 PC spectrofluorophotometer equipped with a 150 W Xenon lamp and 1.00 cm quartz cells. Instrument excitation and emission slits both were adjusted to 3 nm. FT-IR spectra were recorded using a FT-IR spectrometer, Tensor 27 (Bruker Optik GmbH, Rudolf-Plank-Str. 27, 76275 Ettlingen, Germany). A centrifuge from Hettich (EBA 20 model/ Andreas Hettich GmbH & Co. KG, Tuttlingen, Germany) with 15 mL calibrated centrifuge tubes (Hirschmann, EM techcolor, Germany) was used to accelerate the phase separation process. The pH-meter model M120 (Halstead, Essex, England CO9 2DX) supplied with a glass combined electrode was used for the pH measurements. The mixtures were shacked using a Unimax 1010 Shaker-Inkubator (Heidolph, Germany).
Materials
Chemicals including iron (II) chloride tetrahydrate (FeCl2.4H2O), iron (III) chloride hexahydrate (FeCl3.6H2O), SDS, ethanol (EtOH), methanol (MeOH), sodium chloride (NaCl), acetonitrile (ACN), hydrochloric acid (HCl), sodium hydroxide (NaOH) and ethylenediaminetetraacetic acid (EDTA) disodium salt dehydrate were obtained from E. Merck (Darmstadt, Germany).
A stock solution of 500 μg mL-1 of PRO was prepared by dissolving appropriate amount of pure drug (gifted by Hakim Pharm. Co. Tehran, Iran) in EtOH and was kept away from the light in a refrigerator at approximately 4°C. Working standard solutions were obtained by appropriate dilution of this stock standard solution. All other reagents were of analytical reagent grade or higher. Ultrapure water (Milli-Q Advantage A 10 system, Millipore) was used throughout the work.
Preparation of MNPs
MNPs were prepared by the co-precipitation method [27] with some modifications [23]. According to our previous work, different conditions for the synthesis of MNPs were investigated and it was found the quality of MNPs were fully reproducible once the synthesis is performed using chloride salts, the Fe2+/Fe3+ ratio fixed at 1:1.7 and addition of Fe2+/Fe3 mixture to NaOH solution (heated at 80 °C).
For this purpose, 4.6 g of FeCl3·6H2O, 2.0 g of FeCl2·4H2O, and 0.85 mL of HCl (12 mol L-1) were dissolved in 25 mL of deionized water which was degassed with N2 before use. The resulted clear yellowish green solution was added drop-wise into 250 mL of 1.5 mol L-1 NaOH solution (heated to 80 °C), under vigorous stirring with N2 passing continuously through the solution during the reaction. Upon addition, the solution turned black and was then stirred magnetically at 1000 rpm for 30 min. After the reaction, the obtained precipitate was separated from the reaction medium by magnetic field, washed with 200 mL of deionized water four times, and then re-suspended in 250 mL of deionized water. The concentration of MNPs in this solution was found to be 1% w/v. Our results showed that MNPs can be used twice after elution with 2.5 mL of deionized water and without any effect on their extraction ability.
Procedure for biological samples
The samples were treated based on reported methods with some modification [17,28]. Urine samples were obtained from a healthy male volunteer who took a single oral dose of a commercially available tablet (Rouz Daru) containing 20 mg PRO. The urine samples were collected over specified time intervals (0-1,
Drug-free plasma samples were obtained from the Blood Transfusion Organization (BTO) in Tabriz, Iran, and stored at -20 °C until they were analyzed. This sample named as quality control (QC) samples. Three hours after the administration of the tablet to a healthy volunteer, 10 mL blood sample was taken in a tube containing EDTA. After centrifugation, the plasma was removed and frozen at -20 °C before use. A frozen plasma sample was thawed at room temperature and a 3 mL aliquot was transferred into a 15 mL centrifuge tube, spiked with PRO at proper concentration range and then 3 mL of ACN added to this sample to precipitate the proteins. The contents of the tube were mixed and centrifuged for 10 min at 4000 rpm, then 1.0 mL of the clear supernatant was transferred to another flask, and the general procedure described below was followed.
Procedure for MSPE
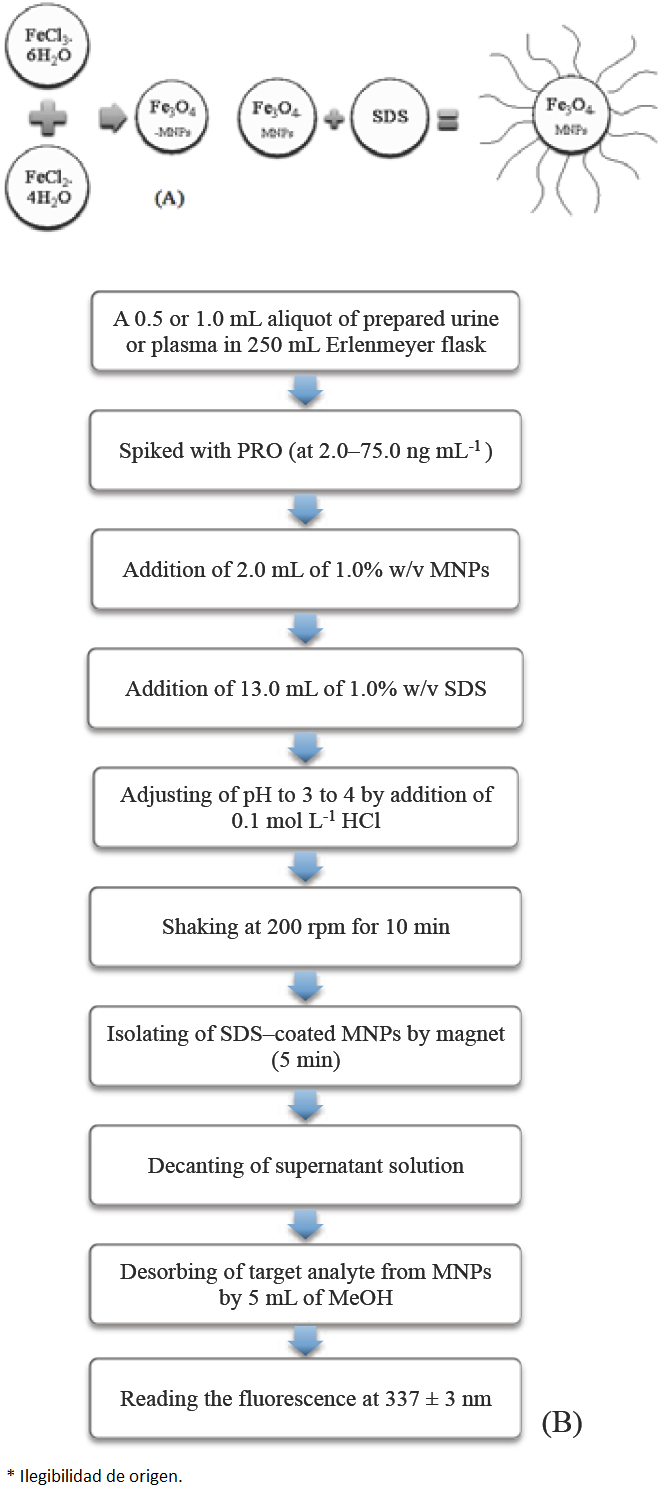
A 0.5 or 1.0 mL aliquot of prepared urine or plasma sample, respectively, was placed in an Erlenmeyer flask (V = 250 mL) and spiked with PRO, to give a concentration in the range 2.0-75.0 ng mL-1. The sample was then mixed with 2.0 mL of 1.0% w/v MNPs solution and 13.0 mL of 1.0% w/v SDS solution. The solution was diluted to approximately 140 mL and pH was adjusted to 3 to 4 by addition of 0.1 mol L-1 HCl solution, then the volume of the mixture was made up to 150 mL with ultra-pure water. The flask was shaked at 200 rpm and allowed to complete the extraction process for 10 min. Subsequently, a strong magnet was placed at the bottom of the beaker, and the SDS-coated MNPs were isolated from the solution. After about 5 min, the solution became limpid and supernatant solution was decanted. Finally, the preconcentrated target analyte was eluted from the isolated particles with MeOH (5.0 mL) to desorb the target analyte with the aid of stirring at 200 rpm. Finally, the fluorescence intensity was measured at 337 ± 3 nm with the excitation wavelength set at 230 ± 3 nm. A schematic illustration of steps involved in the synthesis of MNPs and MSPE of PRO has been given in Scheme 1.
Results and Discussion
The influences of different factors on the extraction conditions were studied. Fig. 1 shows the excitation and emission spectra for PRO extracted from aqueous or biological samples using the optimized MSPE conditions that were established.
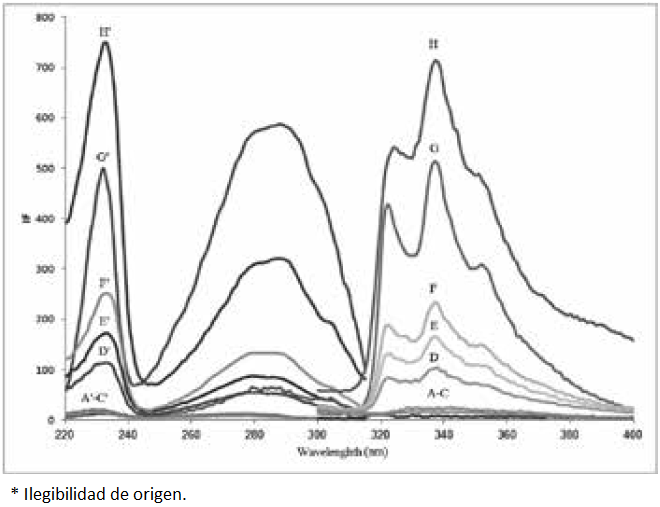
Fig. 1 Emission/excitation spectra after MSPE: (A&A’), (B&B’), (C&C’): reagent’s, urine and plasma blank, respectively; (D&D’) collected urine sample; (E&E’): collected plasma sample (both after administration of PRO to one volunteer); (F&F’): sample (D) spiked with PRO at 25 ng mL-1 concentration level; (G&G’) sample (E) spiked with PRO at 50 ng mL-1 concentration level; (H&H’) standard solution of PRO (85 ng mL-1). Conditions: pH 3-4, 2 mL of 1% NP solution, 13 mL of 1% SDS solution, desorption with 5 mL of MeOH for 5 min, other conditions have been mentioned in the text.
Characterization of MNPs
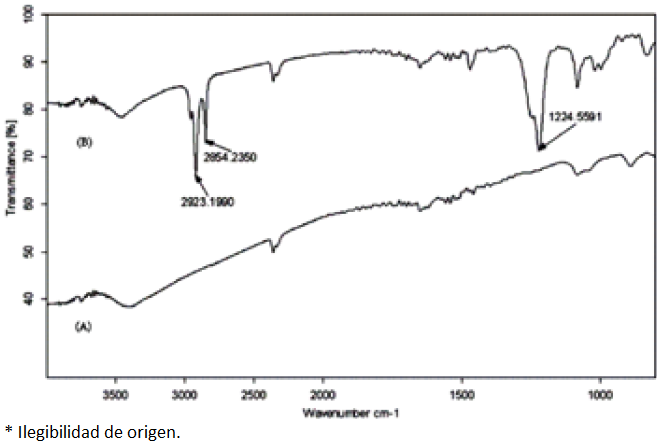
The average particle size of obtained MNPs was less than 42 nm by using a SEM, model vega2 (Check Republic). Fig. 2 displays the IR spectrum of the Fe3O4 MNPs and the SDS coated Fe3O4 MNPs. Two characteristic bands can be distinguished in the IR spectrum of SDS coated Fe3O4 MNPs, while not observed in the Fe3O4 MNPs IR spectrum. Compared with the standard spectrum, the adsorption bands at 2923.2 and 2854.2 cm-1 could be attributed to the stretching vibration of C-H band, as well as the adsorption band at 1224.6 cm-1 could be attributed to the stretching vibration of S=O band, which showed that the surface of Fe3O4 MNPs was successfully modified with SDS.
Effect of pH
It is well known that the pH of the sample solution is one of the prime factors influencing the states of species (as ions or neutral forms) and adsorption behavior of a mixed hemimicelles system due to the different charge density of the Fe3O4 MNPs surface at the different working pH [15-17]. The point of zero charge (PZC) of Fe3O4 MNPs is about 6.5 [17,27]. When pH of the solution is above its PZC, the surface of Fe3O4 MNPs is negatively charged. Oppositely, the surface of Fe3O4 NPs is positively charged. The positively charged surface of Fe3O4 MNPs in acidic solutions was favorable for the adsorption of anionic surfactants and thus targeted analyte [15].
In this study, the effect of pH was examined by varying pH between 1.0 and 9.0. As shown in Fig. 3, with the increase of pH value, the PRO adsorption amounts increased remarkably, so the maximum adsorption was achieved at pHs between 3 to 5, then decreased at higher pH values. This can be attributed to the fact that when the pH was below its PZC, the Fe3O4 MNPs surface was positively charged and the negative ions of SDS can be adsorbed to the Fe3O4 MNPs surface to form mixed hemimicelles and adsorb targeted analyte. When pH was above the isoelectric point of the Fe3O4 MNPs, the positive charge density on the surface of the Fe3O4 MNPs is decreased, thus the adsorption of SDS molecules on NPs surfaces becomes less favorable and this could lead to a remarkable depression in the analytical signal. On the other hand, in quite acidic medium, the analytical signal was decreased probably due to dissolution of Fe3O4 MNPs at pHs below 2.0 or protonation of SDS molecules, which could reduce the hemimicelles formation efficiency [15,17]. Thus pHs between 3.0 to 4.0 was chosen for all subsequent experiments and HCl solution used for the pH adjustment.
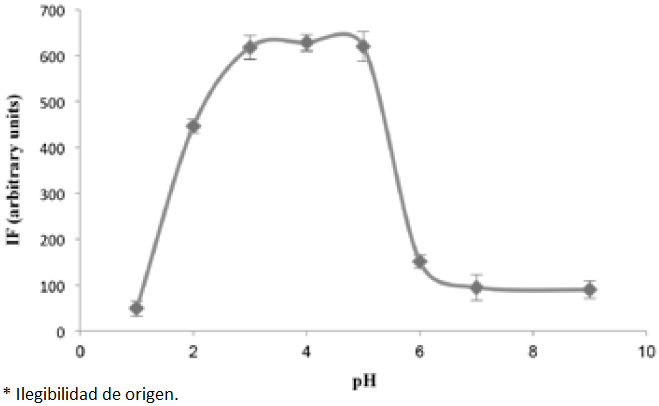
Fig. 3 The effect of pH on the analytical signal for 75 ng mL-1 PRO. The conditions were the same as shown for Fig. 1. Each point corresponds to the average of three measurements and standard deviation has been added as error bars.
The amounts of MNPs and sample volume
Compared to ordinary sorbents (micron-size particle sorbents), NP sorbents have higher surface areas. Therefore, satisfactory results can be achieved with fewer amounts of NP sorbents [17,24]. The influence of MNPs content was studied by adding different amounts of MNPs suspension, ranging from 0.25-5.0 mL. It can be seen from Fig. 4 that the highest (and approximately consistent) fluorescence intensities were found when 2.0-5.0 mL of MNPs suspension (1% w/v) was used. Therefore, 2.0 mL of NP suspension was selected as the optimum for use in later tests.

Fig. 4 The effect of NP amount on the analytical signal for 75 ng mL-1 PRO. The conditions were the same as shown for Fig. 1. Each point corresponds to the average of three measurements and standard deviation has been added as error bars.
The effect of solution volume on the enrichment of PRO was examined by extraction different volumes (in the range 50-200 mL) of aqueous solutions spiked with a fixed mass of PRO (e.g. 5 µg) in the optimal conditions. The results (e.g. Fig.5) showed that the analyte present in the volumes up to 150 mL was completely and quantitatively adsorbed with NPs. Thus, 150 mL was considered to be the maximal enrichment volume for water samples.
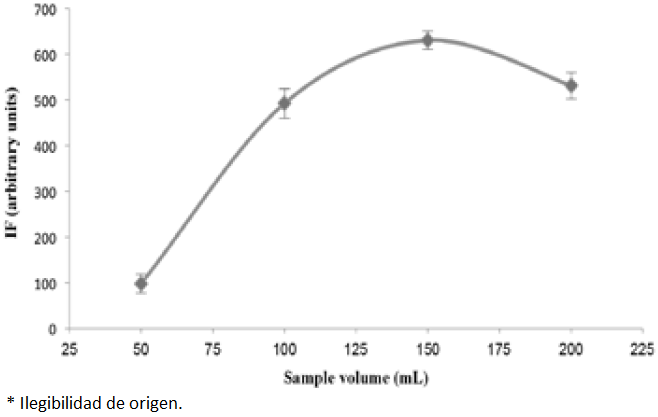
Fig. 5 The effect of sample volume on the analytical signal for 75 mL-1 PRO. The conditions were the same as shown for Fig. 1. Each point corresponds to the average of three measurements and standard deviation has been added as error bars.
Effect of SDS amount
The outer surface of hemimicelles is hydrophobic whereas that of admicelles is ionic, which provides different mechanisms for retention of organic compounds and both are suitable for the SPE method. In mixed hemimicelles phase, the adsorption is driven by both hydrophobic interactions and electrostatic attraction because of the formation of hemimicelles and admicelles on the surface of mineral oxides [19,20]. From Fig. 6, it was observed that MNPs can’t adsorb PRO from aqueous solution at all, while their SDS modified form adsorbed PRO efficiently. In this study, SDS was added to the solution at concentrations lower than its CMC (2.3 g L-1, e.g. 7.98 mM) [29] to modify the surface of Fe3O4 NPs. The adsorption amount of PRO increased remarkably with the increasing amount of SDS. The increase in adsorption can be explained by the gradual formation of SDS aggregates on the Fe3O4 MNPs surface and the PRO is adsorbed gradually. Maximum adsorption was obtained when SDS amounts were between 3 and 4 mM. When SDS amount was above 4 mM, the adsorption of the analyte decreased gradually, which may be attributed to the fact that the SDS molecules began to form micelles in the bulk to the fact aqueous solution and the micelles caused the PRO to redistribute into the solution again. Given these findings, 13 mL of 1% SDS solution (final concentration of 3 mM) was selected for next studies.

Fig. 6 The effect of SDS amount on the analytical signal for 75 mL-1 PRO. The conditions were the same as shown for Fig. 1. Each point corresponds to the average of three measurements and standard deviation has been added as error bars.
Extraction and desorption time
In order to realize complete extraction, the effect of standing time on the sorption and desorption was investigated. The extraction and desorption time profiles were studied by varying the mixing time of MNPs-sample suspension in the range of 2-20 min. Thus, experimental results showed that a shaking time of 10 and 5 min were sufficient for achieving satisfactory sorption and desorption of targeted analyte, respectively. The high surface area of MNPs along with homogeneous distribution of the nanosorbent throughout the sample and its superparamagnetic properties could be the possible reasons for achieving such a fast extraction process [17,20].
Desorption condition
Organic solvents can rapidly and completely disrupt the mixed hemimicelles and therefore the analyte is removed from the surface of NPs [18,19]. Various desorbing eluents including MeOH, EtOH, acidified (Ac) MeOH or EtOH, acetone (AC) and ACN were used to find the best desorbing solvent for the adsorbed PRO. Their effect on the fluorescence intensity of PRO is shown in Fig. 7. As can be seen from this Fig., the best elution efficiency was obtained when MeOH was used, probably due to its best desorption ability. The MNPs were eluted with different volumes of MeOH such as 2.5 mL, 5 mL and 2×2.5 mL. It was found the elution with 5 mL volume of MeOH was sufficient for quantitative elution of the retained analyte.
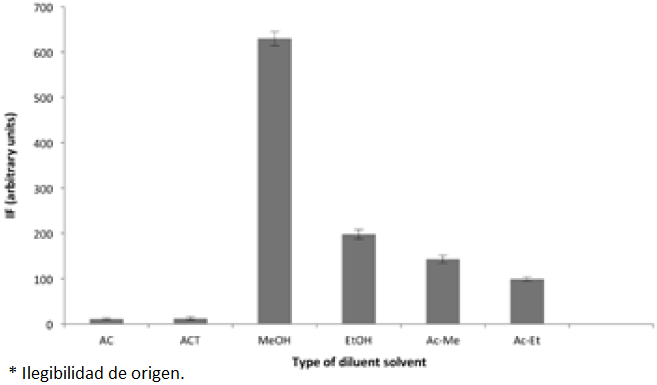
Fig. 7 The effect of the desorbing solvent on the analytical signal for 75 ng mL-1 PRO. The conditions were the same as shown for Fig. 1. In each case the MNPs was eluted with 5.0 mL of each solvent. Each point corresponds to the average of three measurements and standard deviation has been added as error bars.
The validation of the method
The method was validated according to guidelines set by the FDA [30] and considering the linearity, sensitivity, precision, accuracy and recovery effect in order to demonstrate the feasibility of the present approach for the determination of PRO in human urine and plasma.
The calibration curves were obtained for standard aqueous or pooled urine and plasma samples spiked with PRO. These curves were established by measuring the fluorescence intensity of eleven or six solutions of various concentrations of PRO in standard aqueous or biological samples, respectively. In all cases linear relations between fluorescence intensity and concentration of PRO was found in the range 1-100 ng mL-1 and 2-75 ng mL-1 for standard aqueous or biological samples, respectively. The equations, including standard deviations for slopes and correlation coefficients for the calibration curves, are summarized in Table 1. The LOD and LOQ were defined based on IUPAC definition [31] by considering the three and ten times the standard deviation of the blank signals (Sb) and based on 3Sb/m and 10Sb/m equations, respectively, where m is the slope of the calibration line. The differences in the slopes of calibration curves can be attributed to the presence of some matrix effects, on the other hand the different LODs and LOQs are due to different standard deviations as well as different slopes.
Table 1 Analytical characteristics of the proposed method.
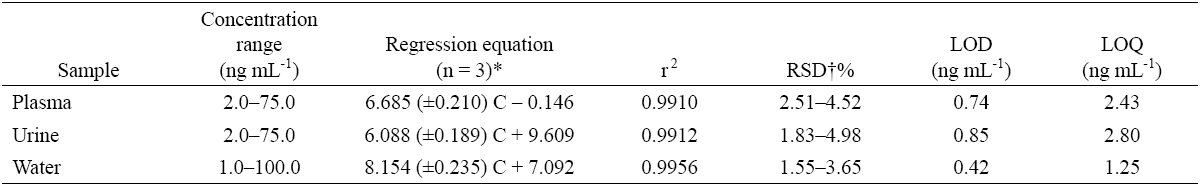
* These values are slope ± S.D (n=3) on a same day.
† RSD has been reported for intra-day precision.
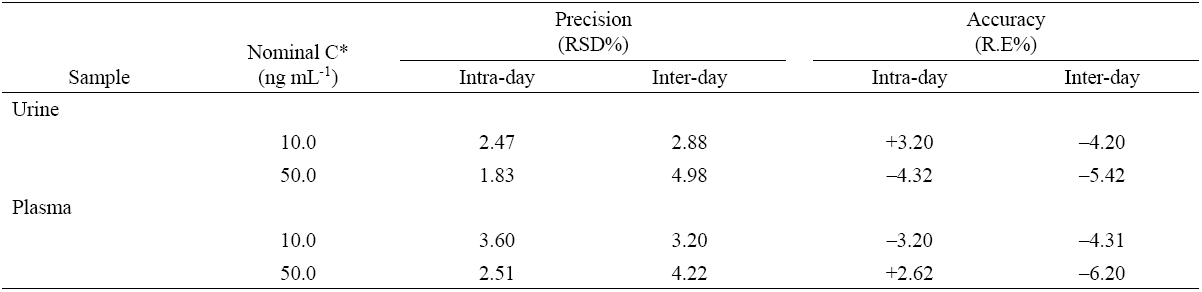
The precision of the method was measured through intra-day and inter-day precision and expressed as the relative standard deviation (%RSD). Intra-day precision was evaluated by analyzing QC samples in three concentration range (e.g. low, medium and high) in the same day 5 replicates. The inter-day precision was assessed by duplicate analyzing, during three consecutive days, at the same concentration levels. Good precision was achieved with RSD values lower than 3.6% for intra-day and 5.0% for inter-day precision (Table 2). The accuracy, expressed as the relative error (%), was better than 6.2%.
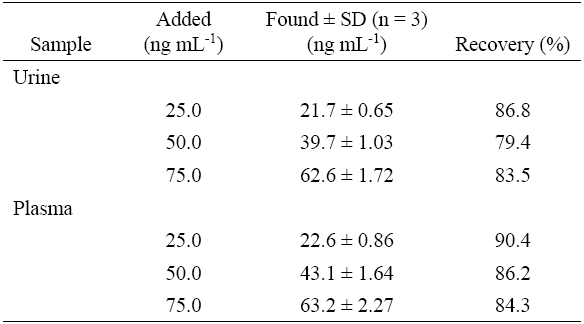
The accuracy of the proposed method and interference study
The PRO recoveries were determined at three concentration levels. For this purpose drug-free urine and plasma were obtained from a healthy volunteer and from the BTO, respectively. The aliquot volumes of QC samples were spiked with PRO at the three test concentrations and then treated as described in the “Procedure for biological samples” section. Aliquots (0.5 mL) of clear supernatant solutions of each test sample were transferred to clean flasks and analyzed following the optimized procedure. As can be seen in Table 3, the recoveries ranged from 79.4 to 86.8% and 84.3 to 90.4%, for urine and plasma samples, respectively, and seem to be satisfactory. The evaluation of precision and accuracy was based on the criteria that the RSD of each concentration level should be within ±15% of the nominal concentration [30]. Thus, the results (summarized in Tables 1-3), indicate that the method met the requirements of a bioassay.
Typical spectra for a PRO standard solution, blank urine and plasma, a urine and plasma sample from a volunteer, and the urine and plasma samples spiked with PRO are shown in Fig. 1. No additional peaks caused by interfering compounds were observed at the emission wavelength that was used in this work. Therefore, the similarities in the excitation and emission spectra, found for each sample, along with reasonable recoveries indicated that there were no significant matrix effects on this work.
As well as, the influence of frequently encountered excipients and additives on the proposed method was studied by adding different amounts of possible interference to aqueous sample containing 25 ng mL−1 of PRO. The tolerance limit was taken as the concentration causing an error of not more than 7% in the determination of the drug. No interference was observed from the presence of lactose, glucose, citrate, saccharose, starch, talk, magnesium stearate in the ratios commonly used in pharmaceutical preparations. Thus, the proposed method showed a high degree of tolerance for these species.
Comparison with other extraction methods
The performance of the proposed method was compared with the performances of other methods to highlight the advantages of the proposed method. The distinct features of the methods that were assessed are summarized in Table 4. The most significant feature of the proposed method is that the LOD achieved using the proposed method is superior to those obtained with sensitive methods such as HPLC [6,8], and HPLC-MS [3] and comparable to those obtained with other methods in Table 4. Compared with methods in which CE, HPLC or HPLC-MS are used to determine the target analyte, the proposed method does not require high levels of financial investment or involve high instrument maintenance costs. It is also evident that the dynamic linear range, precision and recoveries achieved using the proposed method are comparable to those achieved using other methods.
Table 4 Analytical characteristics of different methods used for extraction and determination of PRO.
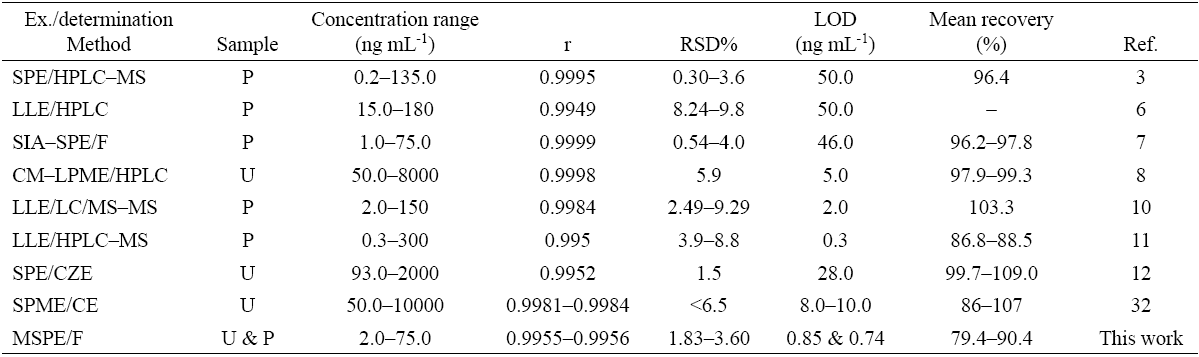
Ex. = extraction method, SIA = sequential injection analysis, CM-LPME = carrier-mediated liquid phase microextraction, MIP-ex. = molecularly imprinted polymers extraction, CZE = capillary zone electrophoresis, SPME = solid phase microextraction, F = spectrofluorimetry, P= plasma, U = urine.
The application of the method
PRO is prohibited by the World Anti-doping Agency (WADA) in some sports. The minimum required performance limit of PRO for doping analysis laboratories is 0.5 µg mL-1 [33]. Also, plasma PRO levels higher than 20 ng mL-1; defined as minimum effective concentration; were sufficient to obtain a clinical response by β-adrenoceptor blockage [13]. These concentration levels can be simply monitored by our proposed method.
For this purpose, the proposed method was successfully used to determine PRO in human urine and plasma samples. The urine and plasma for this purpose was collected after PRO had been ingested and treated as described in the “Procedure for biological samples” section. The PRO concentration in the plasma sample was found to be 213.9 ng mL-1, which was in accordance with the results of other studies [6,10,13].
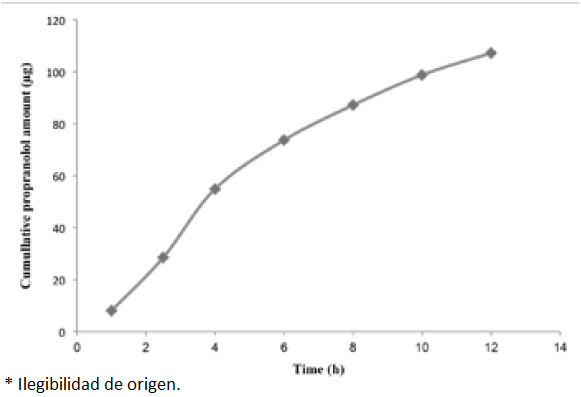
A unique pharmacokinetic study was performed by analyzing urine samples of a volunteer receiving a single oral dose of 20 mg PRO tablet. Urine samples were collected between 0-12 h after administration and these collections were monitored for PRO. The commutative PRO amount found using the proposed method at different interval times, are shown in Fig. 8. The found concentrations were in the range of 10.5 to 36.7 ng mL-1 which was in accordance with values reported in the literature [12]. In this work about 0.54% of the PRO dose was excreted as the unmetabolized drug in a total volume of 0.5 L urine within 12 h.
Conclusions
In this work, MSPE based on MNPs combined with spectrofluorimetry was successfully developed for the extraction and determination of PRO in human urine and plasma samples. The proposed method offers a simple, safe, sensitive, and inexpensive method for extraction and determination of PRO. Method validation using spiked real samples demonstrated that the method is capable of detecting trace PRO with adequate accuracy and precision. Also, sensitivity of the method is enough for the determination of PRO in urine and plasma samples. The proposed methodology possessed several advantages like simplicity and low cost, especially if more sophisticated techniques such as HPLC or GC are not available.

