


 nueva página del texto (beta)
 Inglés (pdf)
 Artículo en XML
 Referencias del artículo
 Enviar artículo por email
 Citado por SciELO
  Similares en
SciELO
Similares en
SciELO 
 Permalink
Introduction
Heavy metal ion contamination represents a significant threat to the ecosystem. Among them, copper is an essential element at the trace level for hemoglobin formation, carbohydrate metabolism, catecholamine biosynthesis and proper functioning of many important enzyme systems [1,2], but the intake of large quantities can be toxic. When levels of Cu exceed certain values, defense mechanisms to protect against excess Cu are overcome and toxicity results. The reported list of toxic Cu species often includes Cu(OH)+, Cu2(OH)2 2+, and CuCO3. However, without doubt, Cu2+ ions that are present in various aqueous solutions are considered to be the most toxic of dissolved copper species [3]. Cu2+ is known to catalysis lipid peroxidation (please correct), possibility forming free radicals. Thus, the determination of Cu2+ in water samples is important with due attention to (synonym may apply) the narrow window of concentration between essentially and toxicity.
Over recent years, development of novel sensors for the detection of heavy metals has increased because of the importance of controlling the level of environmental pollutants in various samples. Regarding to, an extensive effort has been explained in the synthesis and characterization of various carriers to develop new sensors for the determination of various ions, in different real samples [4-17]. The advantages of ion selective electrodes (ISEs) including accuracy, portability, sensitivity and selectivity, low cost and ease of use have led to the development and application of some ISEs based on the application of different ionophores, for the determination of Cu2+ ions. Several Cu2+ sensors have been developed based on various ionophore such as Cefazoline [18], Schiff base [19], salens [20], benzothiazol derivative[21], hydroxybenzylide thiosemicarbazide[22]. However, these efforts have not been very fruitful as the developed electrodes have either one, two or, in some cases all of the following problems: (1) high detection limit, (2) a narrow working concentration range, and (3) serious interferences from others ions and (4) short life time. In continuation of our previous works on developing new ion-selective potentionmetric sensors [23-30], in the present work we synthesized 1-cyano-1-piperidino-2(Npiperidino methyl)-cyclohexane (CPNPMC) and the various theoretical thermodynamic properties (such as enthalpy, entropy and Gibbs free energy) of the reaction complexation of Mg2+, Cu2+, Zn2+, Ag+, Cd2+ and Pb2+ ions with CPNPMC molecule are studied with B3LYP/6-31G(d) computational level for all atoms except Ag+, Cd2+ and Pb2+ ions where B3LYP/LANL2DZ computational level are used. Finally, we introduced a sensitive copper-ion selective liquid membrane electrode for potentiometric monitoring of copper concentration over a wide range in environmental samples by using CPNPMC as an excellent ionophore.
Experimental Section
Apparatus
The FT-IR spectra were recorded on a Bruker, Tensor 27 instrument using KBr disks. 1H and 13C NMR spectra were recorded with a Bruker Avance DRX-500 instrument using (CD3)2SO as the deuterated solvent containing tetramethylsilane as internal standard, at 500 and 75 MHz, respectively, in parts per million, and J in hertz. Mass spectra were obtained with a Finnigan-MAT-8430 Electron impact ionization-mass spectrometer (70 eV) (in m/z).
A Corning ion analyzer 250 pH/mV meters was used for the potential measurements at 25.0±0.1 °C. Two Ag/AgCl reference electrodes (Azar-Electrode, Iran) were used as the internal and external reference electrodes.
Reagents and Materials
Reagent grade dibutyl phthalate (DBP), high relative molecular weight polyvinyl chloride (PVC), sodium tetraphenyl borate (NaTPB) and tetrahydrofurane (THF) were purchased from Merck and used as received. 2-(Npiperidino methyl) cyclohexanone was synthesized according to Mannich reaction [31] as described elsewhere [26]. Piperidinium chloride, hydrochloric acid, potassium cyanide were purchased from Merck. Nitrate salts of the cations used (from Merck and Aldrich) were all of the highest purity available, and used without any further purification except for vacuum drying over P2O5. Doubly distilled deionized water was used throughout.
Synthesis of Ionophore
The 1-cyano-1-piperidino-2(Npiperidino methyl)-cyclohexane (Fig. 1) was synthesized as follows:
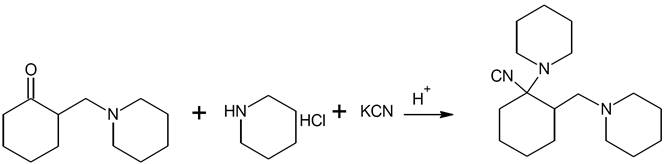
Fig. 1 The Schematic illustration of synthesis of 1-cyano-1-piperidino-2(Npiperidino methyl)-cyclohexane (CPNPMC).
0.94 g (7.7 mmol) of piperidinium chloride salt was poured in a 250 ml flask. Then, 10 ml
distilled water was added. 1.0 g (5.1mmol) of 2-(Npiperidino methyl)
cyclohexanone was added under stirring the mixture. Then, 3 ml of ethanol and 5
ml hydrochloric acid 10% were added. Finally, 1.01 g (15.5mmol) of potassium
cyanide powder which had been solved (Previously dissolved) in 8 ml distilled
water was added in drop-wise manner and rapid stirring. The reaction mixture was
stirred for 72 h at 25°C. The end of reaction was distinguished by thin layer
chromatography (TLC) method. After three times extraction by diethylether in
alkaline medium and drying over dehydrated sodium sulfate, 0.82 g (yield 51.2%)
solid product was obtained. Pure 1-cyano-1-piperidino-2(Npiperidino
methyl)-cyclohexane was obtained by recrystallization from the mixture
n-hexane/ethyl acetate (3/1). The schematic representation of reaction is shown
in Fig. 1. (m.p. 66-67°C). (Rf =
0.34). IR (KBr cm-1): 2939.73; 2854.22; 2221.65; 1473.53; 1445.28;
1382.42; 1282.67; 1202.84; 1128.18; 1075.52; 1038.48; 993.63; 993.44; 893.17;
861.65; 777.95. 1H NMR: (CDCl3) δ ppm, 1.57-1.72 (4H, m);
1.75-1.78 (9H, m); 1.801.82 (8H, m); 2.13-2.15 (4H, m); 2.34-2.35 (2H, m);
2.37-2.38 (2H, m); 2.54-2.71 (2H, dd. CH2 diastereotopie, between
piperidino and cyclohexane ring).-13C NMR: (CDCl3) δ ppm,
22.83, 23.73, 24.68, 25.36, 26.91, 37.56, 63.21, 41.42, 54.76, 75.87; 121.07
(Please check NMR spectra and try to assign some representative signals in 1H.
In 13 C there are less signals than expected). MS: m/e( relative intensity):
55(46.15); 50(38.46); 82(30.76); 84(52.30); [98(100) CH2=+N  ]; 99(38.46); 122(9.23);
142(7.69); 165(35.38); 179(23.07); 205(27.69); 232(24.61); 248(27.70);
275(18.46); [289(27.71) M˖+]; M+1 (12.61); M+2
(9.30).
]; 99(38.46); 122(9.23);
142(7.69); 165(35.38); 179(23.07); 205(27.69); 232(24.61); 248(27.70);
275(18.46); [289(27.71) M˖+]; M+1 (12.61); M+2
(9.30).
Methods and Computations
We obtained the equilibrium geometry of 1-cyano-1-piperidino-2(Npiperidino methyl)-cyclohexane molecule (Ligand) with axial and equatorial forms of cyanide toward cyclohexane (Fig. 2) and local minima corresponding to their complexes with Mg2+, Cu2+, Zn2+, Ag+,Cd2+ and Pb2+ions (Fig. 3) by Molecular Mechanics in the gas phase performed using MMFF94 method [32]. Then the equilibrium conformer procedure using Monte Carlo method is used to replace the initial conformer of a molecule by the lowest-energy conformer. The equilibrium conformer procedure using Monte Carlo method attempt to characterize the conformers available to a molecule based on exhaustive conformational search for finding the lowest energy conformations.
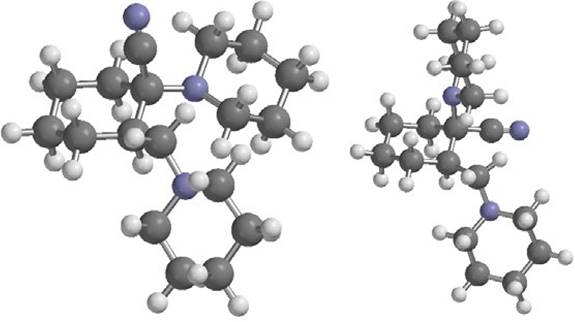
Fig. 2 1-cyano-1-piperidino-2(Npiperidino methyl)-cyclohexane molecule with axial (left) and equatorial (right) forms.
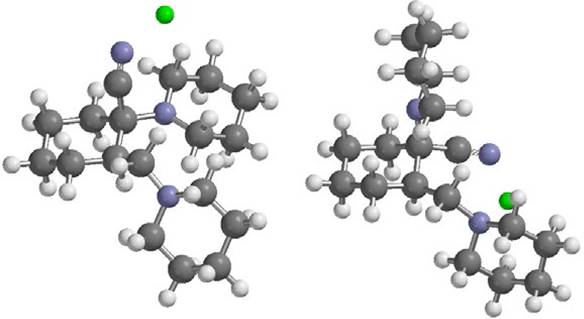
Fig. 3 Complex of ion metals (for example: Zn2+) with 1-cyano-1-piperidino-2(Npiperidino methyl)-cyclohexane ligand with axial (left) and equatorial (right) forms.
This procedure is typically used to get a good guess at the best (lowest-energy) conformer for calculation of properties using quantum chemical methods.
The density functional theory (DFT) with the exchange-correlation potential that constructed from Becke's three parameter functional for exchange (B3) [33,34] along with the Lee-YangParr parameterization for correlation (LYP) [35] was employed for optimization of 1-cyano-1-piperidino-2(Npiperidino methyl)-cyclohexane molecule and their complexes with Mg2+ ,Cu2+ ,Zn2+ ,Ag+ ,Cd2+ and Pb2+ ions. These calculations are performed by6-31G(d) basis set for all atoms except Ag+ ,Cd2+ and Pb2+ ions where LANL2DZ (Los Alamos National Laboratory of Double Zeta) basis set are used. The frequencies were computed to assess thermodynamic properties molecules at the same theoretical level and ensure the nature of local minima.
All DFT calculations in the gas phase were performed using Spartan'10 software [36].
Electrode Preparation
The general procedure to prepare the PVC membrane was as followed: Different amounts of the ionophore (CPNPMC) along with appropriate amounts of additive were weighed. Then, known amounts of PVC and plasticizer were added to the mixture. The mixture was dissolved in 2 mL of tetrahydrofuran (THF), and the solution was mixed well. The resulting mixture was transferred into a glass dish of 2 cm diameter. The solvent was evaporated slowly until an oily concentrated mixture was obtained. A Pyrex tube (3-5 mm o.d.) was dipped into the mixture for about 5 s so that a transparent membrane of about 0.3 mm thickness was formed. The tube was then pulled out from the mixture and kept at room temperature for about 24 h. The tube was then filled with an internal filling solution (1.0×10⁻³ mol L-1 Cu(NO3)2 ). The electrode was finally conditioned for 24 h by soaking in a 1.0×10⁻³ mol L-1 Cu(NO3)2 solution.
Emf Measurements
The following cell was assembled for the conduction of the emf (electromotive force) measurements; Ag-AgCl, KC1 (satd.) | internal solution, 1.0×10⁻³ mol L-1 Cu(NO3)2 | PVC membrane | sample solution | Ag-AgCl, KC1 (satd.)
These measurements were preceded using calibration of the electrodes with several standard solutions. Activities were calculated according to the Debye-Huckel procedure.
Results and Discussion
Theoretical results
The calculations were done for each of the reactants (Ligands and Ion metals) and products (Complexes) in the reaction where the axial and equatorial forms of cyanide in ligand bonded to ion metals:
In this study, it is assumed that after metal ions penetrate the membrane, only interacted with ligand, and metal ions interactions with other organic materials are poor. Therefore, all calculations were performed in the gas phase. Distances of ion metals to nitrogen atoms of ligand in result complexes (as shown for Zn2+ with axial and equatorial forms of cyanide in Ligand in Fig. 3) are tabulated in Table 1. The results are shown that Zn2+ ion has the shortest distance with nitrogen atom in cyanide group of ligand. Also the thermo chemistry output is summarized in Table 2.
Table 1 Distances of ion metals with nitrogen atoms of ligand in result complexes by B3LYP method.
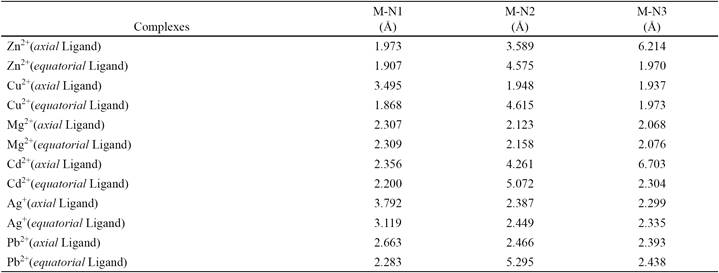
M: Ion metal; N1: Nitrogen atom in cyanide group; N2: Nitrogen atom in 1-piperidine group N3: Nitrogen atom in 2(N- piperidino methyl) group.
Table 2 Calculated thermo chemistry values for the reaction: Ligand + Ion metal → Complex by B3LYP method.
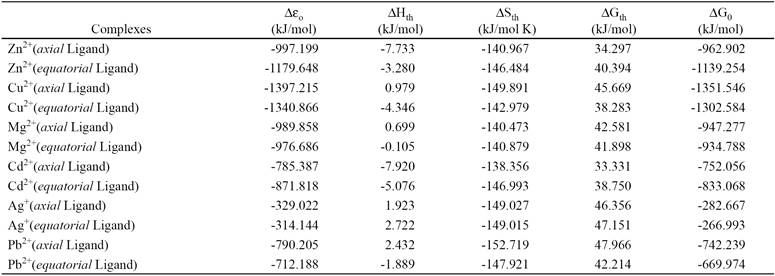
In this table, ∆ɛo is variation of total electronic energy; ∆Hth, ∆Sth and ∆Gth are variation of thermal corrections to the enthalpy, entropy and Gibbs free energy, respectively and ∆G0 is Gibbs free energy of above reaction at standard state (298 K and 1 atm). For calculating the thermal correction of Gibbs free energy we have to add the entropy term to thermal correction of enthalpy (∆Gth= ∆Hth T∆Sth). Also Gibbs free energy is equal with summation of the variation of the total electronic energy in the reaction and thermal correction of the Gibbs free energy (∆G0= ∆ɛo + ∆Hth-T∆Sth).
The variations of thermal correction to entropy complexes formation from all of ion metals with ligand are negative, so the aforementioned reaction the entropy of complexation due to aggregation in complex is inappropriate, but the enthalpy of the reaction at standard state (∆H0 = ∆ɛo + ∆Hth) is appropriate to obtain a complex from ligand and ion metal, because the enthalpy of the reaction complexes formation from all of ion metals with ligand at standard state are negative. Therefore the results of the Gibbs free energy of the reaction show that the thermodynamic reactivity of complexation of ion metals with studied ligand are: Cu2+> Zn2+> Mg2+> Cd2+> Pb2+> Ag+ respectively. Also the reactivity of the axial and equatorial forms of ligand separately with each ion metal based on results in Table 1 is almost comparable.
Membrane Composition Effect on the Potential Response of the Sensor
The selectivity obtained for a sensor depends on the nature of the ionophore and membrane ingredients [37,38]. In this study, different membrane compositions, as shown in Table 3, were tested. The potential of different prepared membrane sensors was measured as function of copper ion free concentration. The linear range and slope of the potential response plots have been evaluated and given in Table 3. As can be seen, the membrane with the composition of 31% PVC, 12% ionophore, 2% NaTPB and 55% DBP (no. 8) which shows the best Nernstian slope (28.4±0.4 mV/decade) was the optimum one in the development of this sensor. Explain why it is the optimum.
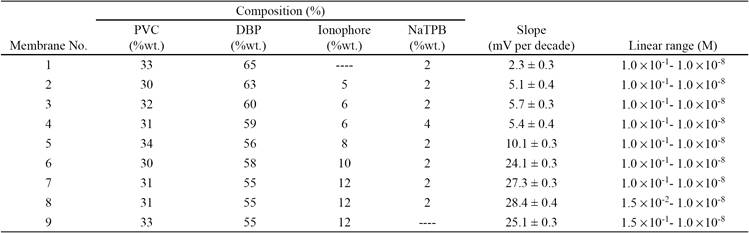
The Cu2+ ion extraction into the liquid membrane is a result of the high concentration of the ligand in the membrane. From Table 3, it was obvious that in the absence of ionophore (no. 1), the response of the recommended electrode was too low (slope of 2.3±0.3 mV per decade) which show significant effect of the ionophore. The sensitivity of the electrode response increases with increasing ionophore content until a value of 12% is reached. It shows the affinity of the CPNPMC toward Cu2+ ion.
The second factor which helps the extraction of the Cu2+ ion is plasticizer. Plasticizer acts as a membrane solvent allowing homogeneous dissolution and diffusional mobility of the ion-pair inside the membrane. The plasticizer should be waterimmiscible liquid of low vapor-pressure, compatible with PVC and no functional groups which can undergo protonation reactions. The selectivity of such electrode can be significantly influenced by the choice of the membrane solvent. Nature of the plasticizer has a noticeable effect on analytical responses e.g. slope, linear domain and selectivity of PVC membrane electrodes [39-41]. Here, dibutyl phthalate (DBP with DC of 6.4) was chosen to be employed in the sensor construction, because plasticizers with higher dielectric constant values than DBP, leading to extraction of the polar interfering ions, which may have negative effects on the selectivity behavior of the sensor. This may seem to lead to the poorer extraction of Cu2+ ions, which have a high charge density, by the average polar solvent. But this seemed to be compensated by the selective complexation of CPNPMC with the Cu2+ ions.
The presence of lipophilic anions in a cation-selective membrane was also considered. Actually, the presence of such anions in a cation-selective membrane, which is based on a neutral carrier, decreases the ohmic resistance and improves the response behavior and selectivity. Furthermore, when the extraction capability is poor, it increases the membrane electrode sensitivity [42,43]. The data given in Table 2 revealed that NaTPB addition of 2% as an additive led to the slope increase of the potential sensor response from the sub-Nernstian value of 25.1±0.3 mV per decade (no. 9) to the Nernstian value of 28.4±0.4 mV per decade (no. 8). Addition of ionic additive to the membrane composition has improved the slope. In fact, it helps to the ion-exchange of the analyte from aqueous solution to organic layer of the membrane. But, difference between the sensitivity of proposed electrode in the absence of additive (consider to eliminate this wordand in present of additive is not marked and it shows that the extraction capability is sufficient.
pH Effect on the Electrode Response
The influence of the pH of the test solution on the potential response of Cu2+ ion sensor investigated at 1.0×10⁻⁶ M Cu2+ solution, in the pH range of 2.0 up to 11. The pH of the solution was adjusted by the addition of hydrochloric acid or sodium hydroxide. The resulting data is shown in Fig. 4. As can be seen, the potentials remained constant from the pH range 5.0 to 8.5 for this sensor. Beyond this range, relatively noteworthy fluctuations in potential were observed. The variations in potentials above the pH value of 8.5 might be justified by the formation of the Cu2+ ion hydroxy complexes in the solution. On the other hand, the fluctuations below the pH value of 5.0 were attributed to the partial protonation of the employed ionophore [44].

This ionophore has N atom which is intermediate donor atom and relatively soft. Therefore, charge-dipole interaction between Cu2+ ions and nitrogen atoms of ionophore is stronger than interaction between H+ ions and nitrogen atoms. If H+ concentration is increased, then H+ ions can compete with Cu2+ ions for making complex with ionophore. In below pH of 5, H+ concentration is enough to overcome on Cu2+ and employed ionophore can be protonated. Above 8.5 pH values lead to the formation of Cu(OH)+ or Cu(OH)2, lowering the concentration of the free Cu2+. Therefore, the pH range 5.0 to 8.5 was taken as the working pH range of the sensor.
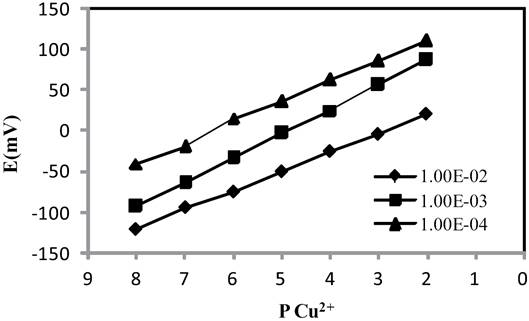
Internal Solution
Three solution of (Cu(NO3)2) with different concentration (1.0×10⁻² , 1.0×10⁻³ and 1.0×10⁻⁴ M) was used as internal solution of the electrode and the potential response of the Cu2+ ion selective electrode was obtained (Fig. 5). It was found that the variation of concentration of the internal solution does not cause any significant differences in potential response, except for an expected change in the intercept of the resulting Nernstian plot. A 1.0×10⁻³ M concentration Cu(NO3)2 solution is quite appropriate for smooth functioning of the electrode system.
Response Time
The response time of an electrode is evaluated by measuring the average time required to achieve a potential within ±0.1 mV of the final steady-state potential, upon successive immersion of a series of interested ions, each having a ten-fold difference in concentration. It is notable that the experimental conditions-like the stirring or flow rate, the ionic concentration and composition of the test solution, the concentration and composition of the solution to which the electrode was exposed before experiment measurements were performed, any previous usages or preconditioning of the electrode, and the testing temperature have an effort on the experimental response time of a sensor [45].
In this work, dynamic response time was obtained by changing the Cu2+ concentration in solution, over a concentration range 1.0×10⁻⁸ to 1.0×10⁻² M. The actual potential versus time traces is shown in Fig. 6. As can be seen, in whole concentration range the electrode reaches its equilibrium response in a relatively short time (5-10 s). This is most probably due to the fast exchange kinetics of complexation-decomplexation of Cu2+ ion with the ionophore at the test solution-membrane interface.

Measuring Range and Detection Limit
The measuring range of an ion-selective electrode includes the linear part of the calibration graph as shown in Fig. 7. The applicable measuring range of the proposed sensor is between 1×10⁻⁸ and 1.5×10⁻² M.
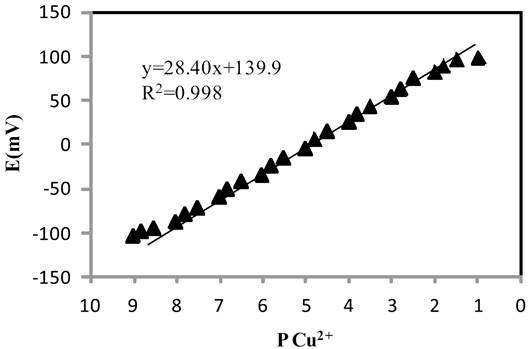
In practice, detection limits for the most selective electrodes are in the range of 10-5-10-6 mol L-1. In this work the detection limit of the proposed membrane sensor was 6.3×10⁻⁹ mol L-1 which was calculated by extrapolating the two segments of the calibration curve.
Selectivity
The potentiometric selectivity coefficients of the Cu2+ ion sensor were evaluated by the matched potential method (MPM) [46]. The calculated selectivity coefficient (KMPM) values are given in Table 4. A value of KMPM = 1.0 indicates equal response to primary and interfering ions. Further, the smaller the value of the selectivity coefficient, the higher is the selectivity of the sensor. It is seen from the table that the selectivity coefficient values are much smaller than 1.0 indicating that they exhibit sufficient selectivity towards Cu2+ over all the interfering ions studied.

Lifetime
The average lifetime of this sensors was investigated by monitoring the changes in sensor slope with time. The sensors were tested for 20 weeks, during which time the electrodes were used extensively (one hour per day). There is a slight gradual decrease in the slopes during 14 weeks (from 28.4 to 25.0 mV per decade). After it, a significant change in slope is observed. The proposed sensors can be used for 14 weeks. It is well established that the loss of plasticizer, carrier, or ionic site from the polymeric film due to leaching into the sample is a primary reason for the limited lifetimes of the sensors [47,48].
Analytical Application
Ion-selective electrodes tend to be; low in cost, simple to use, easily automated for rapid sampling, with low interferences from the matrix and can be applied to small volumes. These characteristics make them an ideal choice for environmental measurements.
The practical utility of the proposed membrane sensor was tested by its use as an indicator electrode for the titration of 25.0mL of 1.0×10⁻⁶ M of Cu2+ solution with EDTA 1.0×10⁻⁴ M. The resulting titration curve is shown in Fig. 8. As can be seen, the amount of Cu2+ ions in solution can be accurately determined with the electrode.
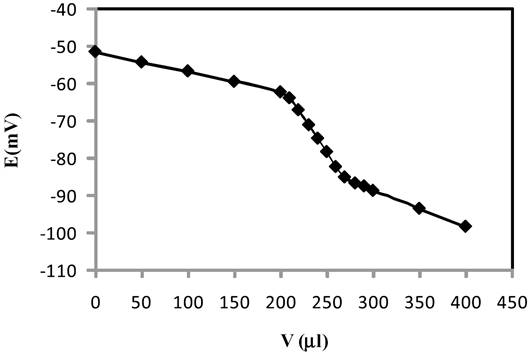
Fig. 8 Potentiometric titration curve of 1.0×10⁻⁶ M Cu2+ solution with 1.0×10⁻⁴ M EDTA using the proposed sensor as an indicator electrode.
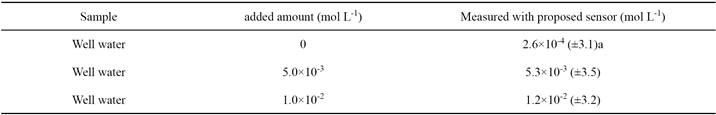
To assess the applicability of proposed electrode in real samples an attempt was made to determine Cu2+ ions in well water sample. The electrode was applied to the direct measurement of Cu2+ ion in Islamic Azad university of Shahre rey well water samples. All of the samples were filtered using a 0.45-μm pore size membrane filter to remove suspended particulate matter. To the some sample solutions were added the Cu2+ ions and to some of solutions were added nothing. Potentials of the sam ples potentials were measured by direct potentiometry. As shown in Table 5, the proposed method could be applied successfully for the direct determination of Cu2+ ions in well water samples.
Comparison of the proposed Cu 2+ ion sensor and some of the best previously reports
The Nernstian slope, linearity range, detection limit, pH range and response time of proposed Cu2+ ion sensor with some of the best previously reports are compared in Table 6. As is obvious, the results clearly indicate that the proposed sensor is superior to the previously reported ones in the detection limit and linearity range. In Nernstian slope and response time, proposed sensor is not superior but is closed to the best previously reports. It should be mentioned that it is found to perform satisfactorily over a relatively large range of pH values (5.0 to 8.5).

Conclusions
The results obtained from the above mentioned study revealed that 1-cyano-1-piperidino-2(N- piperidino methyl)-cyclohexane can be used as a selective sensing element in construction of a liquid membrane sensor for measurement of copper ions in the presence of considerable concentrations of common interfering ions. Applicable pH range, fast response time, low detection limit, and potentiometric selectivity coefficients of the proposed sensor make it a very good device used for the determinations of Cu2+ ions. Also, the various theoretical thermodynamic properties (such as enthalpy, entropy and Gibbs free energy) of the reaction complexation of some ions with sensing molecule were studied. The theoretical results according to experimental results were shown that the thermodynamic reactivity of complexation of copper ion with studied ligand is the best.

