


Servicios Personalizados
Revista
Articulo
 Inglés (pdf)
 Artículo en XML
 Referencias del artículo
 Enviar artículo por email
Indicadores
-
 Citado por SciELO
 -
 Accesos
Links relacionados
-
 Similares en
SciELO
Similares en
SciELO
Compartir

 Permalink
Journal of the Mexican Chemical Society
versión impresa ISSN 1870-249X
J. Mex. Chem. Soc vol.59 no.4 Ciudad de México oct./dic. 2015
Article
In vitro Observation of Direct Electron Transfer of Human Haemoglobin Molecules on glass/tin-doped Indium Oxide Electrodes
Flavio Dolores Martínez-Mancera and José Luis Hernández-López*
Centro de Investigación y Desarrollo Tecnológico en Electroquímica, S.C. Parque Tecnológico Querétaro-Sanfandila, 76703 Pedro Escobedo, Qro., México. jhernandez@cideteq.mx
Received November 26th, 2015;
Accepted February 12th, 2016.
Abstract
Electron transfer properties of the haem (FeIII/FeII) redox center, in human haemoglobin molecules, were investigated, in vitro, on glass/tin-doped indium oxide electrodes. The total surface concentration of electrochemically active haemoglobin molecules corresponded to a single protein monolayer. In addition, anodic and cathodic peak currents changed in direct proportion with the scan rate, suggesting a surface-controlled electrode process.
Key words: Cyclic voltammetry; direct-electron-transfer; human haemoglobin; tin-doped indium oxide electrode; surface electron transfer rate constant.
Resumen
Propiedades de transferencia electrónica, del centro redox (FeIII/FeII) del grupo hemo, en moléculas de hemoglobina humana, fueron investigadas, in vitro, sobre electrodos de óxido de indio dopado con estaño. La concentración superficial total de moléculas de hemoglobina electroquímicamente activa correspondió a una monocapa de proteína sencilla. Además, las corrientes de pico anódica y catódica cambiaron en proporción directa con la velocidad de barrido, sugiriendo un proceso de electrodo controlado superficialmente.
Palabras clave: Voltametría cíclica; transferencia electrónica directa; hemoglobina humana; electrodo de óxido de indio dopado con estaño; constante de velocidad de transferencia electrónica superficial.
Introduction
The haemoglobin (Hb) molecule is an assembly of four globular protein subunits. Each subunit is composed of a protein chain tightly associated with a non-protein haem group. Each individual protein chain arranges in a set of a-helix structural segments connected together in a "myoglobin fold" arrangement, so called because this arrangement is the same folding motif used in myoglobin proteins. This folding pattern contains a pocket that is suitable to strongly bind the haem group. A haem group consists of an iron atom held in a heterocyclic ring, known as a porphyrin. This iron atom is the site of oxygen binding. The iron atom is bonded equally to all four nitrogen atoms in the center of the ring, which lie in one plane. Two additional bonds perpendicular to the plane on each side can be formed with the iron to create the fifth and sixth positions, one of them being connected strongly to the protein through a histidine (Hys) residue, while the other one is available for the binding of oxygen. The iron atom can either be in the FeII or FeIII state; however, ferrihemoglobin (methaemoglobin, metHb) (FeIII) cannot bind oxygen [1].
In adult humans, the most common Hb type is a tetramer (which contains 4 subunit proteins) called Hb A, consisting of two α and two β subunits non-covalently bound. This is denoted as a2p2. These subunits are structurally similar and about the same molecular size. Each subunit has a molecular weight of about 16,000 Da, for a total molecular weight of the tetramer of about 64,000 Da. The four polypeptide chains are bound to each other by salt bridges, hydrogen bonds, and hydrophobic interaction. While Hb does not function physiologically as an electron transfer carrier, it does undergo oxidation and reduction at the haem center in certain cases in vivo [2]. Therefore the research on its electron transfer process might lead to a profound understanding of electron flow in biological systems.
To our knowledge, little work has been reported in the literature on electron transfer properties of human Hb in solution. For example, Topoglidis et al. [3] reported that titanium oxide and tin oxide allow the reduction of bovine metHb without the addition of any promoters and mediators. Recently, Ayato et al. [4, 5] reported that tin-doped indium oxide can induce the electron transfer of the haem (FeIII/FeII) redox center in bovine Hb molecules and that the protein directly adsorbed on the electrode surface of that material was not significantly denatured. Thus, semiconducting metal mixed oxides, e.g., tin-doped indium oxides, In2-xSnxO3, can act as both electron acceptors and electron donors, and can be considered a simple model system for mimicking a charge interface of the physiological binding domain. In order to begin a series of studies on this issue, the electron transfer properties of the haem (FeIII/Fen) redox center, in human Hb molecules, were investigated, in vitro, on commercial glass/tin-doped indium oxide (ITO) electrodes. Special emphasis is put in the Butler-Volmer model developed by Laviron for electron transfer between electrode and protein film, the morphological and structural properties of the electrode as well as the physiological milieu that was conditioned into the three-electrode cell system by means of a phosphate buffered saline (PBS) solution (0.01 mol L-1 Na3PO4, 0.015 mol L-1 NaCl, pH 7.2) and T = 25 °C.
Results and Discussion
Morphological, structural and electrochemical characterization of glass/ITO electrodes
Scanning electron microscopy
The surface morphology of a pretreated glass/ITO electrode was investigated using SEM (cf. Figure 1). The micrograph, taken at a 500 um scale, shows a well defined layer of ITO whose layer thickness was calculated to be ca. 90 um. Additionally, it is possible to observe a regular, uniform and flat electrodic surface. The superficial characterization of the electrode's roughness was carried out by means of a surface roughness tester HANDYSURF E-35A (TSK/Carl Zeiss®). The average roughness value obtained in this case was 0.017 μm which is comparatively lower than the average roughness value obtained for a common glass slide (0.024 μm).

X-ray diffraction
The structural characterization of a pretreated glass/ITO electrode was investigated using XRD (cf. Figure 2). Figure 2 shows the XRD pattern of a glass/ITO substrate used like a working electrode. All of the distinct diffraction peaks corresponded to the (211), (222), (400), (440) and (622) reflections of the BCC structure of ITO (In2-xSnxO3) (JCPDS Card File No. 89-4596). Almost all the peaks were very prominent and referred to the cubic rock salt structure of a very crystalline material. Moreover, strong (222) and (400) diffraction peaks are indicative of preferred orientations along the and directions, respectively [6]. An estimate of the mean crystallite or grain size for a given orientation was determined by using Scherrer's formula [7]:


where Dhkl is the crystallite size (nm), K is a constant (shape factor, about 0.90), λ is the X-ray wavelength (1.54 Å as mentioned before), βhkl = Δ(2θ) denotes the full width at half maximum (FWHM) or broadening of the diffraction peak (degree), and θ is the diffraction angle (degree). The average Dhkl was estimated to be approximately D222 = 17.9 nm for 2θ = 30.566°. It is worth mentioning that the calculated lattice constant a for the glass/ITO substrate using Bragg's equation was a = 1.01234 nm, which coincides with the reported value in the standard card.
Electroactive surface area determination
By measuring the peak current in cyclic voltammograms (CVs), the electroactive surface area of a pretreated glass/ITO electrode was determined according to the Randles-Ševčik equation for a reversible electrochemical process under diffusive control:

where Ipa is the anodic peak current (A), n is the number of electrons transferred in the redox reaction, F is Faraday's constant (96,485 C mol-1 of electrons), Ae is the electroactive surface area of the electrode (cm2), COX the bulk concentration of an oxidant molecule in the solution (mol cm-3), v is the scan rate (V s-1), D the diffusion coefficient of the oxidant molecule in solution, (6.50 ± 0.02) x 10-6 cm2 s-1, for hexacyanofer-rate (II) in 0.1 M KCl as supporting electrolyte at 25 °C [8], R is the gas universal constant (8.314 J K-1 mol-1), and T is the absolute temperature (K).
CVs for 4.0 x 10⁻³ M hexacyanoferrate (II) in 0.1 M KCl were registered to different scan rates (v = 10, 20, 30, 40, 50, 60, 70, 80, 90 and 100 mV s-1) with the glass/ITO electrode. The peak-to-peak potential separation was constant and linear relationships between the anodic and cathodic peak currents and the square root of the scan rate: I = 0.00101vi/2 - 5.8550 x 10⁻⁷, R2 = 0.9999; - Ipc = 0.00101vJ/2 + 3.2078 x 10⁻⁷, R2 0.9999, were achieved. From the slope of these equations, Ae was calculated to be 1.36 cm2. The roughness factor (ρ) of the GME, which is defined as the ratio (Ae/Ag) [9], was estimated to be 1.18.
Electrochemical behavior of human haemoglobin molecules
Figure 3 shows the CVs of glass/ITO electrodes in absence and presence of Hb molecules. Figure 3a, a CV recorded in PBS solution alone shows a non-Faradaic current behavior. The electrode had the largest background current in the non-electrolyte solution which reflected the properties of the electric double layer. The double layer capacitance (Cdl) can be estimated by dividing the sum of the anodic and cathodic current with twice the scan rate [9]. So, the capacitances of the glass/ITO and glass/ITO/Hb electrodes were calculated from Figs. 3a and 3b as 4.8 and 0.4 μF cm-2, respectively. In Fig. 3b, a pair of redox peaks, at around -0.117 V in the cathodic scan and at around -0.097 V in the anodic scan, were found in that Hb-containing solution. This fact indicated that a Faradic current was generated over the glass/ITO electrode, which can be adscribed to the haem (FeIII/FeII) redox center in Hb molecules.

Once capacitive effects are counted out, the amount of electrochemically active Hb molecules could be estimated from integration of the charge Q (in C) under each peak in those CVs acquired at slow scan rates (i.e., 0.1, 0.3 or 0.5 V s-1), given by Faraday's law:

where ΓT is total surface concentration of the protein molecule (mol cm-2), Ae is the electroactive surface area of electrode (cm2), F is Faraday's constant (96,485 C mol-1 of electrons) and n is the number of electrons transferred in the redox reaction:

The total surface concentration of electroactive Hb molecules was estimated to be ΓT = (4.69 ± 0.52) x 10-12 mol cm-2. On the other hand, the theoretical maximum coverage of a protein monolayer on the electrode surface was estimated as 4.89 x 10⁻¹² mol cm-2, considering that one human Hb molecule in PBS solution has a Stokes radius of 31.3 Å [10]. These data indicate that θ = ΓT/ΓTTheo = 0.96 of a protein monolayer was achieved.
Figure 4a shows CVs recorded with different scan rates, from 0.1 to 3.5 V s-1. Nearly symmetric anodic and cathodic peaks were observed; in addition, they have roughly equal heights. The anodic to the cathodic peak potential difference (ΔEp) was much greater than the ideal value of zero. At the lower scan rates, i.e., 0.1, 0.3 or 0.5 V s-1, the smaller redox peak currents were observed, while CVs with the largest redox peak currents corresponded to those acquired at the fastest scan rate, i.e., 3.5 V s-1. In such cases, the formal potential was taken as the midpoint potential between the oxidation and reduction peaks if there is a small separation between them. Considering this criterium, an E0' = -0.107 V (vs. Ag|AgCl in 3 M NaCl solution) was determined at 0.5 V s-1.
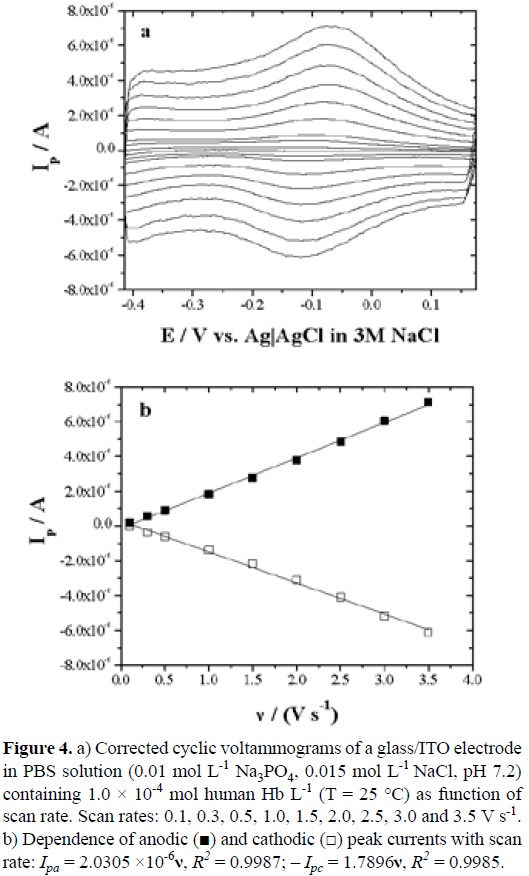
On the other hand, the anodic and cathodic peak currents, Ipa and Ipc, increased with increasing scan rates as observed in Figure 4b. These results are characteristic of quasi-reversible, surface confined electrochemical behavior, in which all electro-active proteins in their haem (FeIII) forms are reduced on the forward cathodic scan, and the reduced proteins in their haem (FeII) forms are then fully oxidized to the haem (FeIII) forms on the reversed anodic scan. When the peak currents were plotted against the scan rate, direct linear relationships were obtained, indicating a surface-controlled electrode process. The origin of this process is indicative that the diffusion of H3O+ ions towards the electrode surface was very fast. Therefore, the electron process can be expressed by Equation 4 as proposed above [11].
The linear regression equations for anodic and cathodic peak currents are as follows: Ipa = 2.0305 x 10⁻⁶v, R2 = 0.9987; - Ipc = 1.7896v, R2 = 0.9985.
Linear plots of Ip vs. v were in good agreement with the following equation [12]:

However, their width at half height is nearly 200 mV, much larger than the ideal 90.6/n mV at 25 °C.
Broadening or narrowing of CV peaks compared to the ideal 90.6/n mV at 25 °C suggests a breakdown of the ideal model assumptions of no interactions between redox sites that all have the same E 0'. Some authors have modeled voltammograms of protein films utilizing the concept of distributions in E 0' and electron transfer rate constants to account for the peak broadening [13-15]. Other factors, including counterion transport efficiency, could also influence peak widths, but have not been investigated in detail for protein films.
At scan rates < 0.5 V s-1, ΔEp was nearly constant in the films. As the scan rate increased, the peak potentials shifted negatively (Figure 5). This is consistent with the onset of limiting kinetic effects as scan rates increase.
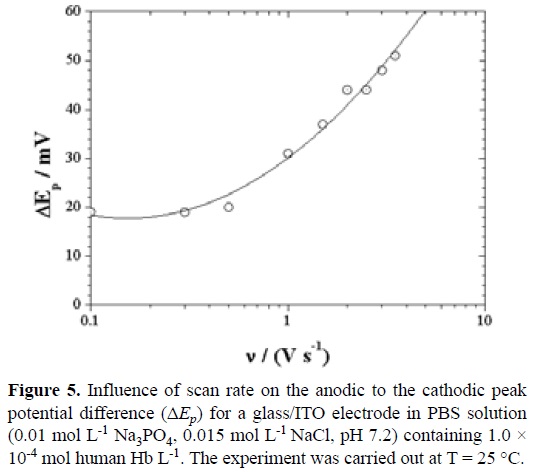
An increasing ΔEp as the scan rate is increased for an electroactive thin film suggests kinetic limitations of the electrochemistry [16] and is consistent with predictions of the Butler-Volmer model for electron transfer between an electrode and redox sites in a thin film on an electrode. Possible causes could be attributed to: (a) slow electron transfer between electrode and redox centers, (b) slow transport of charge within the film limited by electron or counterion transport, (c) uncompensated voltage drop within the film, and (d) structural reorganization of the protein accompanying the redox reactions.
When nΔEp < 200 mV, the surface electron transfer rate constant (ks) of the adsorbed Hb on the glass/ITO electrode can be estimated according to Laviron's equation for quasi-reversible thin-layer electrochemistry [17]:
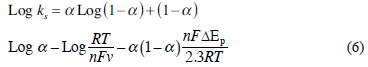
Our experimental results showed that the scan rate in the range 0.1 to 3.5 V s-1 did not affect the ks value, because nΔEp < 200 mV. Assuming a charge-transfer coFefficient a of 0.5, the ks of the adsorbed Hb on the glass/ITO electrode was 8.01 s-1 at the onset of limiting kinetic Feffects (500 mV s-1). This value is significantly higher than other previously reported values in the literature for different haemoglobin species and sort of electrodes. For comparison with data on bare or mediator-coated electrodes, ks was converted to the standard heterogeneous rate constant (k0') by using k0' = ks • d, where d is the film thickness [17]. See for example [3-5, 18, 19] and references cited in [19]. (Table 1).
This fact could be attributed to the morphological and structural properties shown by the electrode, i.e., surface roughness, crystallinity and hydrophilicity [20], and the physiological milieu of the three-electrode cell system that charged, negatively, to the working electrode [21] and protein [22]. All these factors played an important role in providing a more favorable microenvironment for the protein.
Conclusions
In this study, we clearly demonstrated that human Hb molecules directly physisorbed on glass/tin-doped indium oxide substrates exhibited direct electron transfer (DET) in PBS (0.01 M Na3PO4, 0.015 M NaCl, pH = 7.2) solution and T = 25 °C.
The experimental results suggest that acid-base equilibria and the water molecule coordinated to the haem group as the sixth ligand might play an important role in the electron transfer process between human haemoglobin and very crystalline and hydrophilic tin-doped indium oxide electrodes.
Experimental
Chemicals
Human Hb (Product No. H7379, MW = 64 500) and phosphate buffered saline (PBS) Packs (0.01 mol L-1 Na3PO4, 0.015 mol L-1 NaCl, pH 7.2), BupH™ were purchased from Sigma-Aldrieh® and Thermo Seientifie®, respectively, and used without further purification. The concentration of Hb was adjusted to 1 x 10⁻⁴ mol Hb L-1 using the PBS solution.
UV-Visible spectroscopy analysis
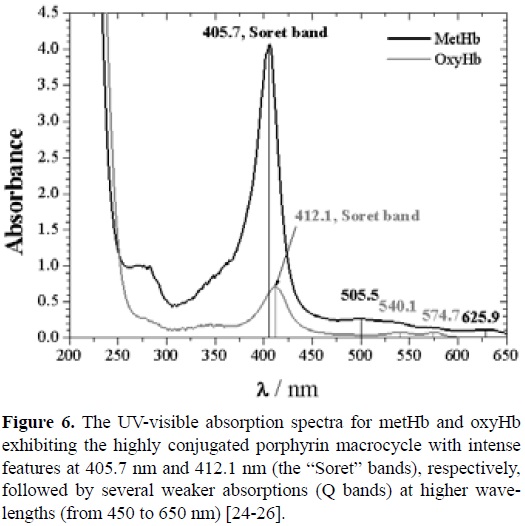
Absorption spectra of human Hb were measured at λ = 200 -1000 nm with an UV-Visible spectrophotometer GBC (Cintra 101), using the following parameters: step size = 0.16 nm, scan speed = 400 nm/min, slit width (SW) = 2 nm. The concentration of Hb referred above was estimated by this technique using the following absorptivity value: A1%540 = 5.97 cm-1 [23].
Scanning Electron Microscopy analysis
Scanning electron microscopy (SEM) micrographs were taken with a scanning electron microscope JSM-6510LV (JEOL) operated at an accelerating voltage of 15 KV.
X-Ray Diffraction Analysis
The structural characterization was determined by X-ray powder diffraction (XRD) using a diffractometer D8 Advanced (Bruker AXS), using the following parameters: U = 40 kV, I = 35 mA, Ni-filter, and Cu-Ka radiation, λ = 1.54 Å . A background diffractogram was subtracted using a glass/tin-doped indium oxide slide as blank. For qualitative analysis, XRD diffractograms were recorded in the interval 10° ≤ 2θ ≥ 800 at a scan speed of 2°/min.
Electrochemical systems
Glass/tin-doped indium oxide (ITO) substrates were purchased from TIRF Teehnologies, Ine. The ITO film surface was cleaned according to the following standard procedure [27]: immersion for 15 min each in a series of ultrasonically agitated solvents (acetone, ethanol, water) then for 15 min each in ultrasonically agitated a) 2.0% (v/v) phosphate-free detergent solution Hellmanex (Hellma™; sonification apparatus Super RK510, Sonorex), b) deionized water type I and c) ethanol at room temperature. In between the sonification steps the samples were rinsed in deionized water type I. Finally, the substrates were dried in a stream of nitrogen gas (Praxair, 99.999%) until further processing. The electrode potential was controlled with a potentiostat-galvanostat EW-4960 (Epsilon™ BASi) coupled to a PC/Processor Intel® Celeron, 3.06 GHz, using a three-electrode cell system. A glass/ITO substrate with a geometric area of 1.15 cm2 was used as working electrode. A platinum wire and a Ag|AgCl in 3 M NaCl solution electrode were used as counter and reference electrodes, respectively. This cell system was thermostated at 25 ± 0.1 °C. Prior to voltammetry, the Hb solution was purged with nitrogen gas (Praxair, 99.999%) for at least 30 minutes; then, a nitrogen atmosphere was maintained over the solution during experiments.
Acknowledgements
The authors would like to acknowledge the National Council for Science and Technology (CONACyT) for its financial support on this research project (FOMIX-QRO-2007-C01, Project Nr. 78809; CB-2008-C01, Project Nr. 101701; Salud-2009-01, Project Nr. 114166).
References
1. Perutz, M.F.; Wilkinson, A.J.; Paoli, M.; Dodson, G.G. Annu. Rev. Biophys. Biomol. Struet. 1998, 27, 1-34. [ Links ]
2. Schumacher, M.A.; Dixon, M.M.; Kluger, R.; Jones, R.T.; Brennan, R.G. Nature 1995, 375, 84-87. [ Links ]
3. Topoglidis, E.; Astuti, Y.; Duriaux, F.; Gratzel, M.; Durrant, J.R. Langmuir 2003, 19, 6894-6900. [ Links ]
4. Ayato, Y.; Itahashi, T.; Matsuda, N. Chem. Lett. 2007, 36, 406-407. [ Links ]
5. Ayato, Y.; Takaktsu, A.; Kato, K.; Matsuda, N. Jpn. J. Appl. Phys. 2008, 47, 1333-1336. [ Links ]
6. Meng, L.-j.; dos Santos, M.P. Thin Solid Films 1998, 322, 56-62. [ Links ]
7. Cullity, B.D. Elements of X-ray diffraetion. 2nd Ed., Addison-Wesley Publishing Company, Massachusetts, 1956. [ Links ]
8. Stackelberg, M. v.; Pilgram, M.; Toome, V. Zeitsehriftfür Elektro- ehemie 1953, 57, 342-350. [ Links ]
9. Bard, A.J.; Faulkner, L.R. Eleetroehemieal Methods: Fundamentals and Applieations. John Wiley & Sons, New York, 2001. [ Links ]
10. Gros, G. Biophysieal J. 1978, 22, 453-468. [ Links ]
11. Wang, C.; Yang, C.; Song, Y.; Gao, W.; Xia, X. Adv. Funet. Mater. 2005, 15, 1267-1275. [ Links ]
12. Rusling, J.F.; Zhang, Z., Thin films on electrodes for direct protein electron transfer, in: Handbook of Surfaees and Interfaees of Materials, Vol. 5, Nalwa, H.S., Ed., Academic Press, New York, 2001, 33-71. [ Links ]
13. Nahir, T.M.; Clark, R.A.; Bowden, E.F. Anal. Chem. 1994, 66, 2595-2598. [ Links ]
14. Zhang, Z.; Rusling, J.F. Biophys. Chem. 1997, 63, 133-146. [ Links ]
15. Nassar, A.-E.F.; Zhang, Z.; Hu, N.; Rusling, J.F.; Kumosinski, T.F. J. Phys. Chem. B 1997, 101, 2224-2231. [ Links ]
16. Murray, R.W., Chemically modified electrodes, in: Eleetroanalytieal Chemistry, Vol. 13, Bard, A.J., Ed., Marcel Dekker, New York, 1984, 191-368. [ Links ]
17. Laviron, E. J. Eleetroanal. Chem. 1979, 101, 19-28. [ Links ]
18. Huang, Q.; Lu, Z.; Rusling, J.F. Langmuir 1996, 12, 5472-5480. [ Links ]
19. Lu, Z.; Huang, Q.; Rusling, J.F. J. Eleetroanal. Chem. 1997, 423, 59-66. [ Links ]
20. Li, C.-z.; Liu, G.; Prabhulkar, S. Am. J. Biomed. Sei. 2009, 1, 303-311. [ Links ]
21. Lin, X.-Y.; Farhi, E.; Arribart, H. J. Adhesion 1995, 51, 181-189. [ Links ]
22. Beckwith, J.; Bell, R.M., Beychok, S. Bioehemistry, Vol. 1, Addison-Wesley, New York 1984. [ Links ]
23. Li, T.-K.; Johnson, B.P. Bioehemistry 1968, 8, 3638-3643. [ Links ]
24. Smith, K.M. Porphyrins and Metalloporphyrins. Elsevier, Amsterdam, 1975. [ Links ]
25. Boulton, M.; Rozanowska, M.; Rozanowski, B. J. Photoehem. & Photobiol. B 2001, 64, 144-161. [ Links ]
26. Sagun, E.I.; Zenkevich, E.I.; Knyukshto, V.N.; Shulga, A.M.; Starukhin, D.A.; Borczyskowski, C. v. Chem. Phys. 2002, 275, 211-230. [ Links ]
27. Hernandez-Lopez, J.L. Doetoral Dissertation. Johannes Gutenberg-Universitat, Mainz, 2003. [ Links ]

