


Servicios Personalizados
Revista
Articulo
 Inglés (pdf)
 Artículo en XML
 Referencias del artículo
 Enviar artículo por email
Indicadores
-
 Citado por SciELO
 -
 Accesos
Links relacionados
-
 Similares en
SciELO
Similares en
SciELO
Compartir

 Permalink
Journal of the Mexican Chemical Society
versión impresa ISSN 1870-249X
J. Mex. Chem. Soc vol.59 no.2 Ciudad de México abr./jun. 2015
Articles
Reaction Parameters for Controlled Sonosynthesis of Gold Nanoparticles
Alma Laura González-Mendoza1 and Lourdes I. Cabrera-Lara*2,3
1 Facultad de Química, Universidad Autónoma del Estado de México, Paseo Colón esq. Paseo Tollocan S/N; C.P. 50120 Toluca de Lerdo, Edo. México, Mexico.
2 Chemistry Institute, Universidad Nacional Autónoma de México.
3 Centro Conjunto de Investigación en Química Sustentable UAEMéx-UNAM, Km 14.5 Carr Toluca-Atlacomulco, Camus UAEMéx “El Rosedal”, San Cayetano-Toluca, C.P. 50200, Edo. México, México.
Received November 14th, 2014
Accepted February 19th, 2015
Abstract
The synthesis of gold nanoparticles by sonochemical technique has been previously performed with excellent results. The synthesis has been carried out in the presence of citric acid, a strong reducing agent, which allows the nucleation and growth of gold nanoparticles, at the same time that controls particle size. In this work, we report the use of sodium tartrate as a mild reducing agent that allows a better understanding of the effect of the reaction parameters during gold nanoparticle synthesis. A conventional sonication bath (37 kHz) was used for the sonochemical synthesis. This work focuses on the reaction temperature effect and the effect of sodium tartrate concentration. It was confirmed that particle size, and particle morphology is dependent of these two reaction parameters. Equally, colloidal stabilization was related to reaction temperature and sodium tartrate concentration. It was also determined that Ostwald ripening takes place during sonochemical reaction under our conditions, allowing us to understand the mechanism that takes place during synthesis. Gold nanoparticles with main particle size of 17 nm were achieved by this method.
Key words: Gold colloidal suspension; nanoparticles; sonosynthesis; sodium tartrate.
Resumen
La síntesis de nanopartículas de oro por el método de sonosíntesis ha sido previamente realizada con excelentes resultados. La síntesis se ha llevado a cabo en presencia de ácido cítrico, un agente redactor fuerte, el cual permite la nucleación y crecimiento de nanopartículas de oro, al tiempo que controla el tamaño de partícula. En este trabajo, se describe el empleo de tartrato de sodio como un agente redactor suave que permite dilucidar el efecto de los parámetros de reacción durante la síntesis de nanopartículas de oro. Un baño de ultrasonido convencional (37 kHz) fue utilizado para la síntesis sonoquímica. Este trabajo se enfoca en el efecto de la temperatura de reacción y concentración de tartrato de sodio. Se confirmó que el tamaño y morfología de las nanopartículas está en función de estos dos parámetros de reacción. De igual forma, la estabilización de la suspensión coloidal depende de la temperatura de reacción y de la concentración de tartrato de sodio. Se determinó que el fenómeno de maduración de Ostwald ocurre durante la reacción sonoquímica bajo nuestras condiciones, permitiendo comprender el mecanismo que ocurre durante la síntesis. Se lograron obtener nanopartículas de oro con un tamaño promedio de 17 nm por este método.
Palabras clave: Suspensión coloidal de oro; nanopartículas; sonosíntesis; tartrato de sodio.
Abbreviations
Surface plasmon resonance: SRP; gold nanoparticles: Au NPs; for example (exempli gratia): e.g.; kelvin: K; atmospheres: atm; trisodium citrate dehydrate: TCD; sodium dibasic tartrate: SDBT; millimolar: mM; minutes: min; milliliters: mL; revolutions per minute: RPM; hour: h; temperature: T; time: t; Fourier transformed infrared: FT-IR; X-ray diffraction: XRD; watts: W; ultraviolet-visible: UV/vis; nanometers: nm; atomic force microscopy: AFM;dynamic light scattering: DLS; ultra high resolution scanning electron microscopy: UHR SEM; kilovolts: kV; thermogravimetric analysis: TGA; centimeters: cm; approximately (circa): ca.; millimeter of mercury: mmHg; differential scanning calorimetry: DSC; λmax; polydispersity index: PDI; hydrodynamic diameter: Dh; standard deviation:σ; figure: Fig.
Introduction
Nanosized noble metal particles, because of their high surface-to-bulk ratio and quantum-size effects,[1] display many novel properties such as high catalytic activities, or interesting optical properties.[2] Therefore, the potentialities of nanoparticles relay on careful control of particle size, particle distribution, and stability.[3] Accordingly, considerable effort has been focused on the development of synthetic techniques for tailoring metal nanoparticles' shape, size and distribution.[1, 4]
In the past few decades, gold colloids have been the subject of great interest. Their uniformity and stability, as well as size-related electronic, magnetic, and optical characteristics, make them promising in the fields of catalysis, imaging, nanophotonics, nanomagnetic, nanoelectronic devices, biosensors, chemical sensors, and drug delivery, among others.[5-11]
Stabilization of the nanoparticles against coalescence into large aggregates is however prerequisite for their remarkable properties to be exploited in a variety of applications,[12] particularly the strong surface plasmon resonance (SPR) absorption.[8, 10, 11] For these applications, maintaining the stability of colloidal gold suspensions is paramount, and this is achieved by the adsorption of organic molecules with functional groups that bind to the gold nanoparticles (Au NPs) surface (e.g. carboxylic, phosphate, sulfhydryl, amino groups, etc.), which depends on the preparative conditions of Au NPs. [6, 10, 12].
As shown in the literature, many studies focus on the development of methods for the synthesis of Au NPs, which include photochemical, and controlled chemical reduction, microwave assisted heating, laser ablation, annealing from high-temperature solutions, metal evaporation, and sonochemical reduction.[13-15]
The sonochemical reduction has received much attention in recent years for Au NPs synthesis,[15-17] due to the low cost and effectiveness of the procedure.[18] The reaction routes induced by acoustic cavitation in solution (the formation, growth and implosive collapse of micro bubbles or gas cavities within a liquid),[17] provide extreme conditions of transient high temperature and high pressure estimated to be over 5000 K and 1000 atm respectively, cooling rates in excess of 1010 K s-1, shock wave generation, and water molecules dissociation into primary hydrogen radicals (H•) and hydroxyl radicals (•OH).[15, 18-26] This method allows the simple and effective preparation of fine powders on a nanometer scale and with homogeneous particle size distribution.[17]
It is reported that a number of factors influence cavitation efficiency, which in turn affects the chemical and physical properties of the products. The dissolved gas, ultrasonic power and frequency, temperature of the bulk solution, and solvent are all important factors that control the yield and properties of the synthesized materials, such as particle's crystallinity.[2, 16-19, 21, 22, 27-32]
An ultrasonic horn delivers from 10 to 100 watts of acoustic energy. Hence, the ultrasonic power output must be calibrated by calorimetry, a critical parameter commonly overlooked. The use of ultrasonic cleaning baths can be considered as an alternative. Ultrasonic cleaning baths have a power density that corresponds to a small percentage of that generated by an ultrasonic horn. The use of cleaning baths in sonochemistry is limited, considering that fully homogeneous particle size and morphology is not always reached. This is due to the physical effects of ultrasound over nucleation and growing processes.[33]
In the literature has been reported the formation of gold nanoparticles with different shapes and sizes (e.g., nanoprisms, nanodumbbells, spherical and triangular nanoparticles) by ultrasonic-assisted reduction of a gold precursor in an aqueous media in the sole presence of alcohol in solution.[18]
The size of gold particles depended strongly on the rate of gold (III) reduction, suggesting that this rate affects the initial nucleation of the gold particles.[21, 34] The rates of gold (III) reduction are strongly influenced by the cavitation phenomenon, hence dependent on reaction parameters. The size of the gold particles is correlated to the initial rate of gold (III) reduction, where the higher the rate of reduction, the smaller the particles.[21]
The sonochemical reduction of AuCl4- to Au(0) has been examined as a function of the concentration of various surface-active solutes.[21] It was found that the efficiency of reduction of AuCl4- in the presence of the surfactants such as sodium dodecyl sulfate,[11] chitosane,[14] amines, fatty acids, ammonium salts,[11] or octaethylene glycol monodecyl ether is related to the concentration of the surfactant in solution.[21, 35] Sonochemical formation of Au NPs with a narrow size distribution was also achieved with polyethylene(40)glycol monostearate, polyoxyethylene-sorbitan monolaurate, or polyvinylpyrrolidone.[13, 35] Stabilizing ligands also confine the growth in the nanometer regime and prevent agglomeration. The use of capping agents commonly produces spherical particles due to the low surface energy associated with such particles.[36]
Among the common stabilizing ligands, trisodium citrate dihydrate (TCD) is used as both a reducing agent of AuCl4- and as a stabilizer of the gold nanoparticles, where citrate ions bind physically at gold surfaces and stabilize the suspension (Fig. 1a).[37] Au NPs can be synthesized using TDC at room temperature under vigorous stirring for a couple of hours.[38] However, particle size distribution and morphology is not uniform. Both parameters can be improved by increasing the reaction temperature, or by varying gold (III) concentration and TCD concentration. Still, during the sonochemical generation of Au NPs using TCD, these have the tendency to aggregate in short period of time.[39]
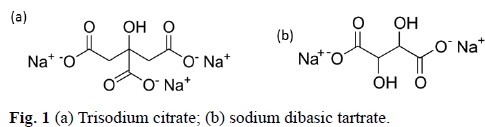
Sodium dibasic tartrate (SDBT) is an organic compound that resembles to TCD, and can also be used as a reducing agent for gold precursors, and as a stabilizer for Au NPs in a milder way (Fig. 1b). The application of ultrasound in a reaction media with SDBT present can promote the increase of the reaction kinetics, allowing a better control over the rate of gold (III) reduction, hence in Au NPs size and morphology. With these motivations, in this study, we report the sonosynthesis of Au NPs using SDBT, the effect of its concentration, reaction temperature and reaction time on the formation of Au NPs in the presence of constant ultrasonic power.[19]
In this work, the sonochemical synthesis of gold NPs was performed based on the use of SDBT as the promoter with a commercially-available low-frequency ultrasound cleaner bath (37 kHz).
Experimental
Sonochemical synthesis of Au nanoparticles
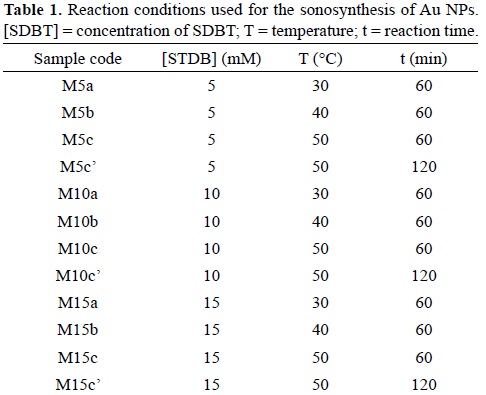
For the sonosynthesis of Au NPs, three reaction parameters were studied: sodium tartrate dibasic (SDBT) concentration, reaction time and reaction temperature. The concentrations of SDBT (Fluka, ≥98.0%) used for this work were: 5 mM, 10 mM, and 15 mM. The synthesis was performed at different temperatures: 30°C, 40°C, and 50°C. The reaction times under study were 60 min and 120 min.
In a round bottom flask, 10 mL of a 1 mM solution of HAuCl4 (Aldrich, 99.99%) was mixed with 10 mL of the SDBT solution. The round bottom flask was placed at the center of the sonication bath (Elmasonic S30), which water bath temperature was adjusted. The system was isolated from any light source. The reaction solution was bubbled with nitrogen gas during 20 minutes, after which the flask was sealed. After the sonochemical reaction was finished, the Au NPs suspension was concentrated by removing the excess of water. The Au NPs were removed by centrifugation at 3000 RMP for 30 min. The supernatant was discarded and the precipitated solid was washed with isopropanol. The Au NPs were resuspended in 5 mL of water and left for dialysis during 72 h. Table 1 presents the parameters used in each reaction.
Characterization techniques
To determine the concentration of non-reacted Au(III), the colorimetric method using NaBr salt was employed. For this method, 0.15 mL of a 2.4 M solution of NaBr was added to 1.5 mL aliquot of the sample to be studied. The wavelength of maximal absorption is found at ca. 382 nm.[15, 27, 40]
The Fourier transform infrared (FTIR) spectra were performed in a FTIR spectrometer Perkin Elmer Spectrum BX sweeping the energy region between 4,000 and 500 cm-1. The measurement resolution is of 2 cm-1. X-ray diffraction (XRD) data were collected using a monocrystal Bruker Apex-Duo diffractometer with a 3-circle goniometer for charge-coupled device detector using a micro source apex II copper radiation (Cu Kα) Incoatec ImS 30 W. The collection strategy used was as follows: exposure time 600 s, with a Phi scanning from 180° placing the detector in six different positions, with a 2Theta:Omega ratio 2:1 from -12°:174° to -72°:144° with a difference of 12:6 degrees between each position to cover the diffraction angles in the range of 0° to 83°. The data were processed by the suite APEX2, using software XRD2 Eval. The ultraviolet-visible (UV-Vis) spectra were performed in a Jasco V-670 spectrometer, recording the spectral region between 300 and 800 nm.
An atomic force microscope (AFM) was used in order to determine particle size of the synthetic product of reaction M10c by tapping mode. The AFM employed was an Asylum Research model FMP-3D Origin. The silicon AFM tips were used, also provided by Asylum Research, model AC 24OTS-R3 (f=45–95 KHz)with a tip radium of 9±2 nm. Zones of 2 µm x 2 µm, were measured in the presence of air. The number of scan lines were 426, scan rate was 0.25 Hz
Dynamic Light Scattering (DLS) measurements were performed on a ZETASIZER NANO ZS from Marvin Instruments. The energy source was a laser which emits a green light, and the angle between the sample and detector is 173°. DLS measurements were carried out on the tartrate-stabilized Au NPs at a temperature of 25°C.
Ultra high resolution scanning electron microscopy (UHR SEM) analysis was performed on a FEI Dual Beam Helios Nanolab 600 instrument operated at an accelerating voltage of 5 kV. Samples for SEM and analysis were prepared by placing a drop of diluted NP suspensions on carbon-coated copper grids, allowing the solvent to dry before the analysis was carried out. Particles morphology was studied, and particle size was determined from the measurement of 200 particles.
The thermogravimetric analyses (TGA) were performed using a Seiko TG/ATD 320 U, SSC 5200 equipment. The analyses were carried out from an initial temperature of 20°C to a final temperature of 550°C with an increasing temperature gradient of 10°C min-1 in the presence of air with a flow rate of 100 mL min-1 to allow the elimination of residues from the sample.
Results and discussion
The sonochemical synthesis of Au NPs has been well-documented, in which Au(0) is generated from the reduction of Au(III) (HAuCl4) in aqueous solution by radicals of H* (from H2O) followed by a number of Au(0) that nucleate and grow into gold NPs (Aun). The sonochemical method relies on anaerobic environment, due to the intervening reaction between free oxygen and H* radical.[41] For this reason, the HAuCl4 salt aqueous solution was placed under N2(g) atmosphere for 20 min after which the sonochemical reaction took place.
The stabilizing agent under study, SDBT, has two carboxylic groups that can coordinate to gold nanoparticle's surface, and can also provide stability in aqueous media. The initial clear yellow solution changed to a red or purple color upon ultrasonic irradiation, depending of the reaction conditions used (Table 1).
Concentration of SDBT was varied, in order to study if particle size and optical properties were dependent on this parameter. The concentrations selected were 5, 10 and 15 mM. Reaction kinetics was controlled by adjusting the reaction temperature. Reaction time was also studied to determine the optimum time in which most of the gold precursor was consumed. The reaction times selected were 60 and 120 minutes.
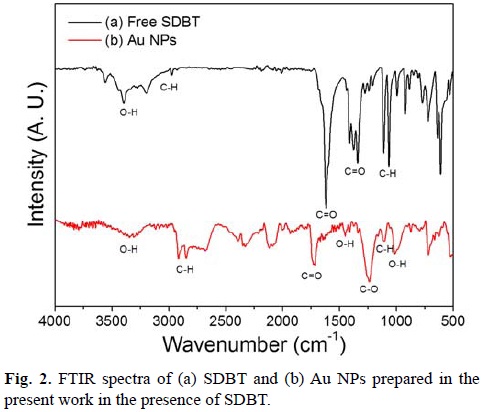
FTIR was employed to determine if SDBT was adsorbed to the surface of Au NPs. The spectrum for SDBT was generated for comparison (Fig 2a). The signal at 1617 cm-1 corresponds to C=O asymmetric stretching due to carbonyl group. On the other hand, the band at 1410 cm-1 corresponds to the symmetric vibration of the C=O group. The broad absorption band occurring around 3440 cm-1 is characteristic of O–H bending, revealing the presence of hydroxyl groups. The signal that corresponds to the C–H stretch is found at 2970 cm-1. Fig. 2b shows FTIR spectrum of Au NPs with SDBT. It can be observed the O–H stretching at around 3300 cm-1. The C=O stretching due to carbonyl group is observed around 1720 cm-1. The O–H out of plane bending is seen around 1000 cm-1. The C–O stretching vibration is observed around 1236 cm-1. The C–H stretching is also observed around 1103 cm-1. This suggests that SDBT adsorbs onto the surface of Au NPs through its carboxylic groups.[42]
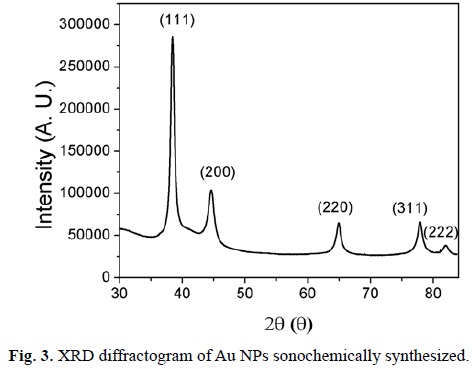
The Au NPs generated by this method are highly crystalline, as was confirmed by XRD (Fig. 3). The data were generated by a monocrystal Bruker Apex-Duo, by using a Cu source, since a powder diffractometer was not available for this work. Hence, for these cases, the calculation of crystallite size using Scherrer's formula was not performed. The X-ray diffractograms were very similar, reason why only one is shown. The characteristic peaks at 38.2°, 44.4°, 64.7°, 77.7° and 81.8° are assigned to the (111), (200), (220), (311) and (222) reflections of face centered cubic unit cell, which are typical for Au particles (JCPDS card no. 4-784).
TGA was performed for all cases after dialysis. The results were very similar, reason why we only show one thermogram. Fig. 4 shows that the Au NPs start losing mass at about 100°C (7% mass), which corresponds to the loss of water present on the surface of Au NPs. Water loss begins almost as soon as heating is initiated and a gradual sloping TG loss curve is observed.
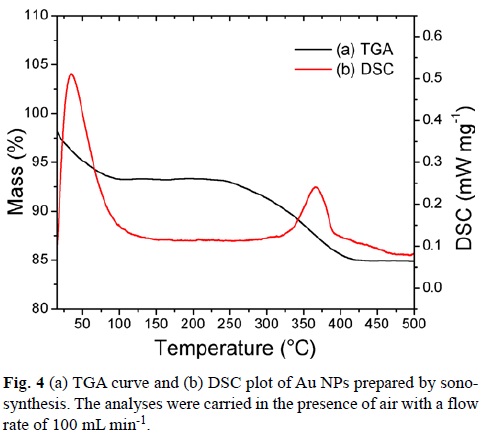
The second weight loss (ca. 8%) observed within the region of 250–400 °C is attributed to the decomposition of the SDBT absorbed to the Au surface. This is in agreement with the boiling point of SDBT, which is 399.3°C at 760 mmHg.[43] The TGA study shows that the weight loss occurs gradually, but more rapidly around the boiling point of the ligand. Differential scanning calorimetry (DSC) analysis shows two exothermic temperatures. The first one, a relatively broad DSC exotherm at 34°C corresponds to slow and gradual water loss. The second one at 368°C corresponds to an exothermic reaction, which may be due to the formation of gaseous products from SDBT.[44]
Effect of tartrate concentration during the sonochemical reaction for the generation of Au NPs
All the sonochemical reactions for this study were performed at 30°C during 60 minutes. SDBT concentration was varied, using 5 mM, 10 mM and 15 mM solutions (samples M5a, M10a, and M15a, respectively). SDBT is very similar to trisodium citrate, a weak base that has several roles in the formation of gold nanoparticles. It is a reducing agent, and its ligands protect the recently formed nanoparticle. However, citrate also changes the solution's pH as its concentration varies.[45] It has been reported that the reactivity of gold complexes changes with pH values.[45] Hence, it is of importance to study the response of the reaction towards the change in concentration of SDBT.
The effect of pH on the distribution of Au(III) complex ions has been studied by other groups,[46, 47] which have pointed out that low pH values facilitate the formation of well dispersed Au NPs, whereas high pH values lead to the formation of large ensembles and large Au aggregates.
At pH > 6, the predominant species is AuCl(OH)3-, and at pH > 10, Au(OH)4- is the predominant one, where both species are difficult to reduce. With the variation of the pH of the system, both Au(III) complexes as well as SDBT can markedly change their reactivity, inducing influence in the reaction pathways and rates.[48] It is the control of hydrolysis to tune the speciation of [AuClx(OH)4-x]- that subsequently influences Au nanoparticle's size.[49]
The pH of the reaction solutions was measured (X mM SDBT and 1 mM HAuCl4, X = 5, 10, 15), obtaining the values of pH 5.92 for M5a, pH 6.12 for the reaction mixture of M10a and pH 6.30 for M15a. Hence, it was assumed that AuCl2(OH)2- and AuCl(OH)-3 ions participate in the reactions.[50] The species AuCl2(OH)2- is easily reduced (probably present in M5a), which is an advantage for the synthesis of Au NPs, since the nucleation process is faster than the growth process, allowing the generation of finer Au colloids.[47] On the other hand, AuCl3(OH)- could be mostly present for M10a and M15a. This species may possibly reduce the reaction rate to achieve Au NPs, and might as well generate particles of higher dimensions.
All final suspensions showed a purple color (Fig 5a) at the end of each reaction. It was first determined the concentration of non-reacted Au(III) by addition of NaBr. A maximum absorbance appears at 380 nm.[15] The M10a reaction showed the lowest concentration of Au(III) was present at the end of its reaction (0.19 mM Au3+) when compared M5a (0.21 mM Au3+) and M15a (0.20 mM Au3+). In all the reactions, ca. 80% of the initial concentration of Au(III) was consumed in order to form Au NPs.
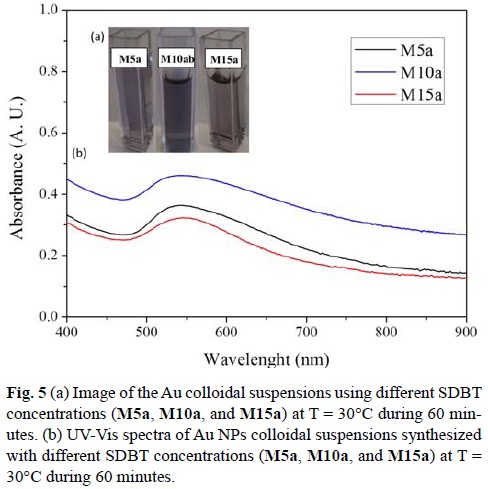
It has been reported that Au NPs with a diameter smaller than 25 nm show a strong absorption band due to surface plasmon resonance (SPR) ca. 520 nm.[18, 51] UV-Vis spectra for all cases showed the SPR absorption at wavelengths red shifted (Fig 5b). For M5a, SPR was located at λmax = 540 nm, for M10a λmax = 539 nm, and for M15a λmax = 541 nm. The shifting of the SPR absorption peak when compared to what has been reported, is an indication that particle size is greater than 25 nm.
Interestingly, at higher SDBT concentrations (15 mM), absorbance values decreased with respect to 10 mM. The concentration of free Au(III) is lower than the concentration found for the reaction performed with 5 mM of SDBT. It can be thought that the amount of Au(0) is greater for the reaction M10a. However, it appears that these particles are more aggregated than particles generated at M15a. At this concentration, the amount of carboxylic groups available is the one responsible to form these aggregates, which would explain the decrease in absorbance. The pH value of the reaction media could also allow the formation of aggregates.
It was also noticed in every case that the curve was not symmetrical. The SPR peak wavelength depends directly on the size and shape of the nanoparticles.[18, 52] As the light can no longer polarize the nanoparticles homogeneously, when the average diameter of gold nanoparticles is greater than 20 nm, retardation effects of the electromagnetic field across the particle cause the red shift and broadening of the SPR with increasing particle size.[18, 53] As mentioned by other groups, this implies that size distribution is broad or particles are aggregated. From the three concentrations studied, the reaction performed at 10 mM showed a higher absorbance, which implies that higher concentration of Au nanoparticles were produced, which is in agreement with the NaBr colorimetric technique.
From the DLS measurements, it was possible to determine their hydrodynamic size. For M5a, particle size was predominantly of 62 nm with a polydispersity index (PDI) of 0.588. For M10a, hydrodynamic particle size was ca. 50 nm (PDI = 0.277). For M15a, hydrodynamic particle size was ca. 45 nm (PDI = 0.553). As it can be observed, as SDBT concentration increases, particle size decreases (Table 2).
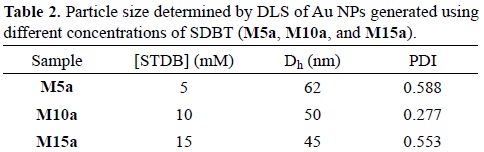
SDBT acts as a growth inhibitor that occupies active sites at the surface of gold nanoparticles. The diffusion of gold ions to the active sites is hindered by the SDBT molecules, not allowing the gold nanoparticles to grow more. Hence, as there is more amount of SDBT present in the reaction suspension, the smaller the particle size will be [54]. However the PDI is high for M5a and M15a. UV-Vis spectra interpretation is in agreement with DLS data, i.e. particle size distribution is broad.
The role of pH in these experiments is subtle. Species AuCl(OH)3- appears to be predominant for the reaction carried out with 15 mM of SDBT (pH 6.30). AuCl(OH)3- is more difficult to reduce than AuCl2(OH)2- species, which may be predominant for the reaction performed with 5 mM of SDBT (pH 5.92), explaining why UV-Vis absorbance of the former one was lower than that for 5 mM. However, at 5 mM there is not enough SDBT to promote the reduction of Au(III). For the reaction performed with 10 mM of SDBT, both species AuCl2(OH)2- and AuCl(OH)3- could be present (pH 6.12), but the amount of SDBT appears to be enough to promote the reduction of all AuCl2(OH)2- present.
From the experimental results generated in this section, that SDBT concentration of 10 mM was the one that was used for the rest of the experiments, it was the one that gave a better hydrodynamic diameter (Dh) with respect to the rest of the results.
Effect of temperature during the sonochemical reaction for the generation of Au NPs
The sonochemical reaction was performed at three different temperatures: 30°C (M10a), 40°C (M10b), and 50°C (M10c) during 60 min, using a SDBT concentration of 10 mM. Optical differences were observed (Fig. 6a). The final color of the colloidal suspension of the reactions carried out at 30 and 40°C (M10a and M10b) were purple, while the color of the colloidal suspension for the reaction performed at 50°C (M10c) slowly turned during the reaction from purple to red. (For the time vs λmax absorbance curves constructed for reactions M5b, M10b and M15b, with T = 40°C during 60 min, please refer to supplementary information).
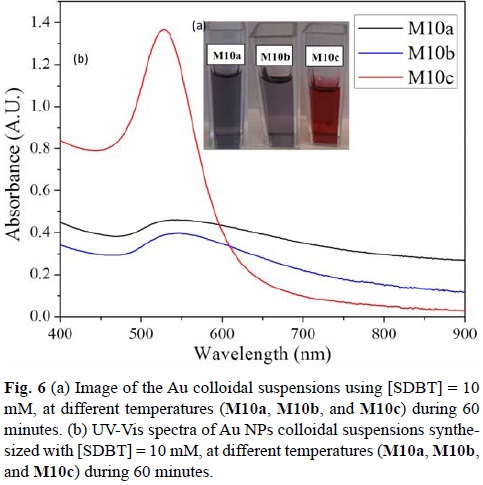
M10c showed the lowest concentration of Au(III) at the end of the reaction (0.12 mM Au3+) when compared to M10a (0.18 mM Au) and M10b (0.18 mM Au3+). It is at the highest temperature that ca. 90% of the initial concentration of Au(III) was consumed in order to form Au NPs.
In fig. 6b, the UV-Vis spectra of Au NPs generated at different reaction temperatures, all in aqueous suspension are presented. It can be observed that as the reaction temperature increases the Au NPs SPR peak is blue shifting (λM10a= 558 nm; λM10b=544 nm; λM10c=527 nm). For M10a and M10b, the absorption spectra show broad and unsymmetrical SPR peaks, which indicate that NPs size distribution is broad and that probably they are aggregated. For M10c, the SPR peak in this case is narrow and very symmetrical. Hence particle size is homogeneous and particles are very well dispersed
The M10c reaction was followed by UV-Vis spectroscopy. An UV-Vis spectrum was recorded every 10 minutes in order to study its optical behavior (supplementary information). For the first 10 minute reaction aliquot, a λmax= 546 nm corresponding to Au SPR was observed (the dispersion had a purple color). As the reaction continued, the λmax had a blue shifting. At the end of the reaction, lmax registered was at 527 nm (the dispersion had a red color).
In order to study the evolution of the particle size during the M10c reaction, we decided to analyze particle size by AFM using the tapping mode. Aliquots were taken at different reaction times: 10, 20, and 30 minutes. A drop of the reaction suspension was placed on a TEM copper grid. The sample was allowed to dry at room temperature and then it was analyzed by AMF. Figure 7 shows the images corresponding to the AFM analysis and the particle size distribution built for each case. Micrographies are shown as phase images, in which different densities are observed in the studied zone (2 mm x 2 mm). The darker tone corresponds to material of higher densities, in our case, Au NPs. As it can be observed after a 10 min reaction time (Fig. 7a), particles show aggregation, and a broad particle distribution, which covers from 30 nm to 85 nm, with an average particle size of 48 nm. At this point of the reaction, the reaction suspension had a purple color. Particle size was measured for M10c after a reaction time of 20 min (Fig. 7b). Average particle size was of 49 nm with a standard deviation (σ) of 7 nm. No significant change is observed, however, particle size distribution is narrower. The aliquot taken after a reaction time of 30 min showed an average particle size of 27 nm (Fig. 7c). It can also be observed in the image, that particles are aggregated. Particle distribution diagram takes in account this aggregates. At the end of the reaction, the NPs Au suspension had a red color.
AFM images confirm what was observed by UV-vis spectroscopy. As M10c reaction takes place, particle size evolves, from aggregates with an average size of 48 nm to well dispersed NP, with an average size of 17 nm at the end of the reaction. It can also be observed that particle size distribution narrows as the reaction time increases.
Hydrodynamic size differences were observed in DLS measurements. From this technique, the three reactions showed a high value for PDI. For the experiment M10a, the Dh was of ca. 50 nm (PDI = 0.277). For the reaction M10b, Dh was calculated to be of ca. 27 nm with a PDI of 0.556. In the case of the reaction M10c, hydrodynamic size was slightly reduced, with an average size of ca. 25 nm (PDI = 0.149). As it can be observed, as temperature increases, particle size decreases.[54]
The spectroscopical difference among the reactions performed at different temperatures can be explained based in this parameter. At T = 50°C, the reaction kinetics is increased. At 50°C, the reaction starts generating relatively big Au NPs (ca. > 30 nm). Under less energetic conditions, the evolution process of inhomogeneous particle size takes place, which is known as Ostwald ripening. However, in this case, the extra amount of energy allows that under this ultrasonic frequency, a higher number of Au(0) are available due to particle collision (i.e. particle erosion),[55] which will result in smaller Au NPs than when the reaction is carried out at 30 or 40°C. This is also observed optically, since the colloidal color changes during the reaction from purple to red, an indicative that particle size has changed.
The effect of temperature might not only be reflected on the reaction kinetics, but also the reaction mixture pH. As the temperature increases, pH value decreases,[56] allowing a predominance for the AuCl2(OH)2- species, which is easier to reduce than AuCl(OH)3-.
Effect of reaction time during for the generation of Au NPs
The study of the effect of reaction time for the generation of Au NPs under different temperatures was also performed.
For the three temperatures a kinetic study was performed during the 60 minute reaction. For these studies, an aliquot of the reaction mixture was taken every 10 minutes and its UV-Vis spectrum was generated. Curves of time vs. λmax absorbance were constructed (Fig. 8).
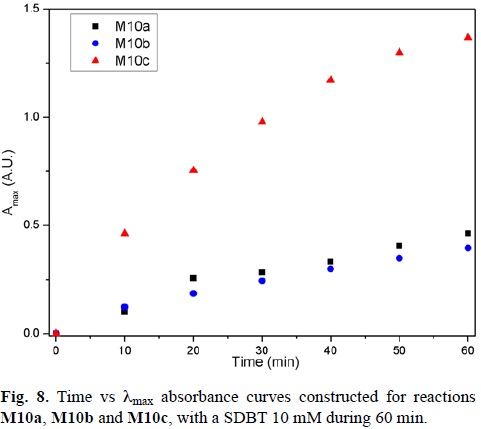
As it can be observed, the reactions M10a and M10b have reached an almost constant absorbance value at 0.5 after 60 minutes of reaction time. However, the reaction M10c has higher absorbance values, not reaching a plateau at the end of the reaction time.
Hence, the reaction time for the synthesis performed at 50°C was increased to 120 min (M10c') (Fig. 9a). It can be noticed, that after 80 minutes, the reaction has reached a maximum absorbance value after 80 minutes.
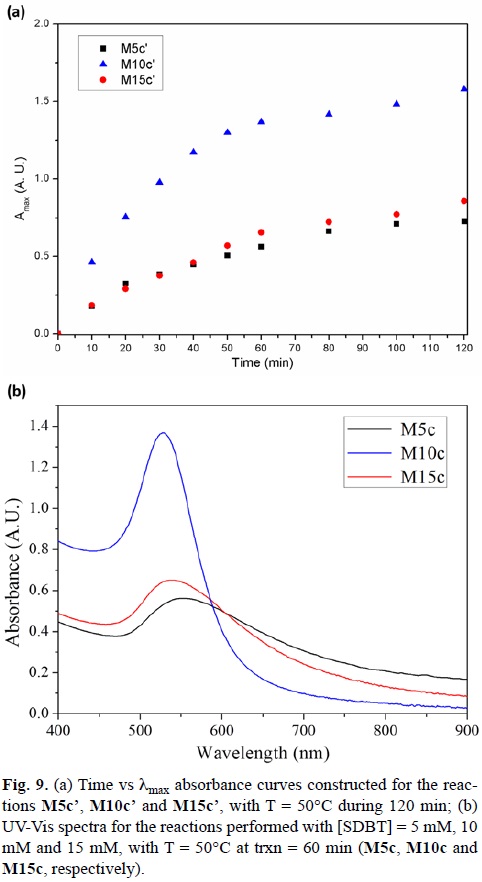
The same kinetic study was performed for the reactions using a SDBT concentration of 5 and 15 mM (M5c' and M15c', respectively). Fig. 9a shows the kinetic curves for a reaction time of 120 min. It is obvious that the reaction does not proceed via the same path as for M10c'. The kinetics is slower in both cases, and the amount of product in both reactions does not increase after a 60 min reaction.[56]
Fig. 9b shows the UV-Vis spectra generated after a 60 min time reaction for 5 m M (M5c), 10 mM (M10c) and 15 mM (M15c) SDBT concentrations. When comparing the final concentration of Au(III) at 30°C for all the reactions with the final Au(III) concentrations at 50°C, it is appreciated that the amount of Au(III) present has decreased, but not in a significant amount for the reactions performed at 5 mM and 15 mM of SDBT (Table 3).
UHR SEM micrographies were generated for these reactions. As it can be observed, NPs synthesized from M5c have a great particle size distribution (Fig. 10a,b). Their morphology is not homogeneous, and they are found forming aggregates. Au NPs synthesized from M10c are very well dispersed, and present an excellent Gaussian behavior (Fig. 10c,d). They present a semispherical morphology, a mean particle size of 17 nm with a standard deviation (σ) of 5 nm. The NPs generated from M15c are also semispherical and had a mean particle size of 19 nm (σ = 5 mn) (Fig. 10e,f). However, they formed aggregates (Fig. 10g). A closer look to the samples shows a great amount of organic surrounding the surface of the Au NP. This explains the UV-Vis results and Dh values. The hydrodynamic diameters of prepared gold nanoparticles are slightly larger than the mean diameter determined from UHR SEM images. This discrepancy can be accounted for by considering the thickness of the surfactant layers adsorbed on the surface of the Au NPs.[41]
As it can be noticed, the reaction performed at 50°C during 60 min in the presence of [SDBT] = 10 mM, generated gold nanoparticles with an average particle size of 17 nm and a Dh of 25 nm.
Conclusions
Au NPs were generated by sonochemical synthesis using a conventional ultrasonic bath. In order to achieve particles with very narrow particle distribution with a homogeneous morphology, reaction parameters such as ligand concentration, reaction temperature, pH value, and reaction time are important to consider. In this work, we were able to achieve Au NPs with a particle size ca. 17 nm with a σ = 5 nm by using a ligand concentration (SDBT) of 10 mM, a reaction temperature of 50°C, during a reaction time of 60 min, with a an initial solution pH value of 6.12, without adjusting it during the reaction synthesis.
Acknowledgements
The authors will like to acknowledge the financial support of PAPIIT UNAM with the project IIB200113-RR260113. UHR SEM was performed at IPICYT, at the division of advanced materials by Ph.D. Gladis Labrada Delgado. The authors want to acknowledge M. Sc. Lizbeth Triana, M. Sc. Alejandra Núñez, Ph. D. Diego Martínez, M. Sc. Melina Tapia Tapia, and Ph. D. Marisol Reyes for their support in the characterization of the material here described. The authors are also thankful to Professor Jorge Tiburcio Baez from Centro de Investigación y de Estudios Avanzados del Instituto Politécnico Nacional, for his support in the DLS measurement during the development of this work.
References
1. López-Cartes, C.; Rojas, T. C.; Martínez-Martínez, D.; de la Fuente, J. M.; Penadés, S.; Fernández, A., J. Phys. Chem. B. 2005, 109, 8761-8766. [ Links ]
2. Chen, W.; Cai, W.; Zhang, L.; Wang, G.; Zhang, L., J. Colloid Interf. Sci. 2001, 238, 291-295. [ Links ]
3. Jin, Y.; Wang, P.; Yin, D.; Liu, J.; Qin, L.; Yu, N.; Xie, G.; Li., Colloid Surface A. 2007, 302, 366-370. [ Links ]
4. Biradar, S. C.; Kulkami, M. G., RSC Adv. 2013, 3, 4261-4270. [ Links ]
5. Rouhana, L. L.; Jaber, J. A.; Schlenoff, J. B., Langmuir. 2007, 23, 12799-12801. [ Links ]
6. Brust, M.; Walker, M.; Bethell, D. Schiffrin, D. J.; Whyman, R., J. Chem. Soc., Chem. Commun. 1994, 7, 801-802. [ Links ]
7. Ma, Y.; Chechik, V., Langmuir. 2011, 27, 14432-14437. [ Links ]
8. Xie, M., Ding, L.; You, Z.; Gao, D.; Yang, G.; Han, H., J. Mater. Chem. 2012, 22, 14108-14118. [ Links ]
9. Jin, S.; Meng, X.; Jin, S.; Zhu, M., J. Nanosci. Nanotechnol. 2013, 13, 1282-1285. [ Links ]
10. Zakaria, H. M.; Shah, A.; Konieczny, M.; Hoffmann, J.; Nijdam, A. J.; Reeves, M. E., Langmuir. 2013, 29, 7661-7673. [ Links ]
11. Song, J.; Kim, D.; Lee, D., Langmuir. 2011, 27, 13854-13860. [ Links ]
12. Aqil, A.; Serwas, H.; Delplancke, J. L.; Jérôme, R.; Jérôme, C.; Canet, L., Ultrason. Sonochem. 2008, 15, 1055-1061. [ Links ]
13. Ou, K.-L.; Yang, K.-H.; Liu, Y.-C.; Hsu, T.-C.; Chen, Q.-Y., Electrochim. Acta. 2011, 58, 497-502. [ Links ]
14. Ou, K.-L.; Yu, C.-C.; Liu, Y.-C.; Yang, K.-H.; Wang, C.-C.; Chen, Q.-Y., Mat. Res. Bull. 2011, 46, 2333-2337. [ Links ]
15. Nagata, Y.; Mizukoshi, Y.; Maeda, Y., Radiat. Res. 1996, 146, 333-338. [ Links ]
16. Qiu, G.; Wang, Q.; Nie, M., Macromol. Mater. Eng. 2006, 291, 68-74. [ Links ]
17. Zhu, J.; Lu, Z.; Aruna, S. T.; Aurbach, D.; Gedanken, A., Chem. Mater. 2000, 12, 2557-2566. [ Links ]
18. Radziuk, D.; Grigoriev, D.; Zhang, W.; Su, D.; Möhwald, H.; Shchukin, D., J. Phys. Chem. C 2010, 114, 1835-1843. [ Links ]
19. Park, J.-E.; Atobe, M.; Fuchigami, T., Ultrason. Sonochem. 2006, 13, 237-241. [ Links ]
20. Belova, V.; Borodina, T.; Möhwald, H.; Shchukin, D. G., Ultrason. Sonochem. 2011, 18, 310-317. [ Links ]
21. Mastai, Y.; Gedanken, A. in: Sonochemistry and other novel methods developed for the synthesis of nanoparticles, in The Chemistry of Nanomaterials: Synthesis, Properties and Applications, Rao, C.N.R.; Müller, A.; Cheetham, A. K., Ed., Wiley-VCH Verlg GmbH & Co, Weiheim, 2005. [ Links ]
22. Teo, B. M.; Chen, F.; Hatton, T. A.; Grieser, F.; Ashokkumar, M., Langmuir. 2009, 25, 2593-2595. [ Links ]
23. Caruso, R. A.; Ashokkumar, M.; Grieser, F., Langmuir. 2002, 18, 7831-7836. [ Links ]
24. Oxley, J. D.; Mdleleni, M. M.; Suslick, K. S., Catal. Today. 2004, 88, 139-151. [ Links ]
25. Prozorov, T.; Rozorov, R.; Suslick, K. S., J. Am. Chem. Soc. 2004, 126, 13890-13891. [ Links ]
26. Teo, B. M.; Grieser, F.; Ashokknumar, M., Macromol. 2009, 42, 4479-4483. [ Links ]
27. Okitsu, K.; Ashokkumar, M.; Grieser, F., J. Phys. Chem. B. 2005, 109, 20673-20675. [ Links ]
28. Wongpisutpaisana, N.; Charoonsuk, P.; Vittayakorn, N.; Pecharapa, W., Energy Procedia. 2011, 9, 404-409. [ Links ]
29. Shen, B.; Zhai, W.; Lu, D.; Zheng, W., RSC Adv. 2012, 2, 4713-4719. [ Links ]
30. Fujimoto, T.; Terauchi, S.; Umehara, H.; Kojima, I.; Henderson, W., Chem. Mater. 2001, 13, 1057-1060. [ Links ]
31. Yu, J. C.; Wang, X.-X.; Wu, L.; Ho, W.-K.; Zhang, L.-Z.; Zhou, G.-T., Adv. Funct. Mater. 2004, 14, 1178-1183. [ Links ]
32. Geng, J.; Jiang, L.; Zhu, J., Sci. China Chem. 2012, 55, 2292-2310. [ Links ]
33. Xu, H.; Zeiger, B. W.; Suslick, K. S., Chem. Soc. Rev. 2013, 42, 2555-2567. [ Links ]
34. Okitsu, K.; Yue, A.; Tanabe, S.; Matsumoto, H.; Yobiko, Y.; Yoo, Y., Bull. Chem. Soc. Jpn. 2002, 75, 2289-2296. [ Links ]
35. Shchukin, D. G.; Radziuk, D.; Möhwald, H., Annu. Rev. Mater. Res. 2010, 40, 345-362. [ Links ]
36. Jana, N. R.; Gearheart, L.; Murphy, C. J., Adv. Mater. 2001, 13, 1389-1393. [ Links ]
37. Csapó, E.; Sebők, D.; Babić, J. M.; Šupljika, F.; Bohus, G.; Dékány, I.; Kallay, N.; Preočanin, T., J. Disp. Sci. & Tech. 2013, 815-825. [ Links ]
38. Chen, Z. H.; Tang, Y. B.; Liu, C. P.; Leung, Y. H.; Yuan, G.D.; Chen, L. M.; Wang, Y. Q.; Bello, I.; Zapien, J. A.; Zhang, W. J.; Lee, C. S.; Lee, S. T., J. Phys. Chem. C. 2009, 113, 13433-13237. [ Links ]
39. Lee, J.-H.; Choi, S. U. S.; Jang, S. P.; Lee, S. Y., Nanoscale Res. Lett. 2012, 7:420. [ Links ]
40. Okitsu, K.; Yue, A.; Tanabe, S.; Matsumoto, H.; Yobiko, Y., Langmuir. 2001, 17, 7717-7720. [ Links ]
41. Wei, M.-Y.; Famouri, L.; Carroll, L.; Lee, Y.; Fomouri, P., Ultrason. Sonochem. 2013, 20, 610-617. [ Links ]
42. Palacios-Hernández, T.; Hirata-Flores, G. A.; Contreras-López, O. E.; Mendoza-Sánchez, M. E.; Valeriano-Arreola, I.; González-Vergara, E; Méndez-Rojas, M. A., Inorg. Chimica Acta. 2012, 392, 277-282. [ Links ]
43. http://www.chemnet.com/India/Products/SODIUM-TARTRATE-DIBASIC-DIHYDRATE/Suppliers-0-0.html, accessed in February, 2014.
44. Binitha, M. P.; Pradyumnan, P. P., J. Therm. Anal. Calorim. 2013, 114, 665-669. [ Links ]
45. Ji, X.; Song, X.; Li, J.; Bai, Y.; Yang, W.; Peng, X., J. Am. Chem. Soc. 2007, 129, 13939-13948. [ Links ]
46. Ran, Y., Fu, J.; Rate, A. W.; Gilkes, R.J., Chem. Geol. 2002, 185, 33-49. [ Links ]
47. Wang, S.; Qian, K.; Bi, X. Z.; Huang, W., J. Phys. Chem. C. 2009, 113, 6505-6510. [ Links ]
48. Ojea-Jiménez, I.; Romero, F. M.; Bastús, N. G.; Puntes, V., J. Phys. Chem. C. 2010, 114, 1800-1804. [ Links ]
49. Young, J. K.; Lewinski, N. A.; Langsner, R. J.; Kennedy, L. C.; Satyanarayan, A. Nammalvar, V.; Lin, A. Y.; Drezek, R. A., Nanoscale Res. Lett. 2011, 6:428. [ Links ]
50. Wojnicki, M.; Rudnik, E.; Luty- Błocho, M.; Pacławsky, K.; Fitzner, K., Hydrometallurgy. 2012, 127-128, 43-53. [ Links ]
51. Amendola, V.; Meneghetti, M., J. Phys. Chem. C. 2009, 113, 4277-4285. [ Links ]
52. Ghosh, S. K.; Pal, T., Chem. Rev. 2007, 107, 4797-4862. [ Links ]
53. Mulvaney, P., Langmuir. 1996, 12, 788-800. [ Links ]
54. Natter, H.; Hempelmann, R., J. Phys. Chem. 1996, 100, 19525-19532. [ Links ]
55. Hardcastle, J. L.; Ball, J. C.; Hong, Q.; Marken, F.; Compton, R. G.; Bull, S. D.; Davies, S. G., Ultrason. Sonochem. 2000, 7, 7-14. [ Links ]
56. Barron, J. J.; Ashton, C.; Geary, L., The Effects of Temperature on pH Measurement, in TSP-01. 2011, Reagecon Diagnostics Limited: Shannon Free Zone, 1-7. [ Links ]

