


Services on Demand
Journal
Article
 English (pdf)
 Article in xml format
 Article references
 Send this article by e-mail
Indicators
-
 Cited by SciELO
 -
 Access statistics
Related links
-
 Similars in
SciELO
Similars in
SciELO
Share

 Permalink
Journal of the Mexican Chemical Society
Print version ISSN 1870-249X
J. Mex. Chem. Soc vol.59 n.1 Ciudad de México Jan./Mar. 2015
Article
Monoenzymatic Lipase Potentiometric Biosensor for the Food Analysis Based on a pH Sensitive Graphite-epoxy Composite as Transducer
Juan Carlos Escamilla-Mejía, José Antonio Rodríguez, Giaan Arturo Álvarez-Romero, and Carlos Andrés Galán-Vidal*
Universidad Autónoma del Estado de Hidalgo. Área Académica de Química. Carretera Pachuca Tulancingo km 4.5, 42184 Mineral de la Reforma, Hidalgo, México. galanv@uaeh.edu.mx.
Received June 26th, 2014
Accepted September 24th, 2014
Abstract
In this paper the development of a potentiometric biosensor based on the use of the enzyme lipase immobilized in a Nafion membrane on a graphite-epoxy transducer is reported. This device has been used to quantify triglycerides in food samples from the aqueous extracts obtained by emulsion with Arabic gum. The proposed methodology does not present significant differences with the spectrophotometric determination used as contrast. This work constitutes the first report of a potentiometric biosensor based on the detection of changes of pH using a graphite-epoxy composite transducer and the first potentiometric triglyceride biosensor which is not based in ISFET transducers. The methodology designed is a simple and inexpensive alternative that minimizes the use of organic solvents without affecting the precision and accuracy of the analysis in complex food samples such as butter, chips and pastries.
Key words: Triglycerides, Potentiometric Biosensor, Graphite-epoxy Composite, Food Analysis, Arabic Gum Extraction.
Resumen
En este trabajo se reporta el desarrollo de un biosensor potenciométrico basado en el uso de la enzima lipasa inmovilizada en una membrana de Nafion sobre un transductor de grafito-epoxi. Este dispositivo ha sido utilizado para cuantificar triglicéridos en muestras de alimentos a partir de los extractos acuosos obtenidos por emulsión con goma arábiga. La metodología propuesta no presenta diferencias significativas con la determinación espectrofotométrica utilizada como contraste. Este trabajo constituye el primer reporte de un biosensor potenciométrico basado en la detección de cambios de pH utilizando un transductor de composite grafito-epoxi y el primer biosensor potenciométrico de triglicéridos que no está basado en transductores ISFET. La metodología diseñada es una alternativa simple y de bajo costo que minimiza el uso de disolventes orgánicos sin afectar la precisión y exactitud de los análisis en muestras de alimentos complejos, tales como mantequilla, papas fritas y pan dulce.
Palabras clave: Triglicéridos, biosensor potenciométrico, composite grafito-epoxi, análisis de alimentos, extracción con goma arábiga.
Introduction
Triglycerides TG are biologically relevant lipids which play an important role in our metabolism as a source of energy [1]. Nevertheless the triglycerides are synthetized in liver and stored in the adipose tissue, the principal source of them is through diet [1-3]. High levels of triglycerides in blood are related to cardiovascular diseases and obesity; consequently its determination in blood and food is important in order to improve our health and promote a better life style [3].
Nowadays various methods are available to quantify triglycerides in blood serum or food samples [4, 5]. The analytical techniques involve high performance liquid chromatography [6-13], gas chromatography [6, 10, 13-18], mass spectrometry [19, 20], spectrophotometry [21-23] and electrochemical biosensors [4]; however, most of the methods listed above require a complicated and long-time of analysis, as well as, the availability of expensive instrumentation and qualified personnel.
Electrochemical sensors are considering as a simple way to quantify triglycerides because the use of low cost instrumentation, as well as high selectivity and sensitivity [4]. In these sense, most of the reports are amperometric and use a protocol of detection multienzymatic, immobilized on expensive materials as Pt electrode, which increase the cost of the analysis, demanding relative long time of response and hindering the analytical conditions [4, 24-28]. These devices report linear range and detection limits compatible with the analysis of blood serum, but to the best of our knowledge, only one device has been applied to the food analysis (vegetal oils) [27].
On the other hand, reported potentiometric biosensors have not been used on real samples and all of them are based on ISFET's (Ion-Selective Field Effect Transistors) which demand expensive instrumentation, made complicated its development and finally increase their cost [4, 29].
As a simple and low cost alternative for the quantification of lipids in food samples, in this work we report a monoenzymatic lipase potentiometric biosensor based on a pH sensitive graphite-epoxy composite as transducer [30].
Experimental
Materials, solutions and instrumentation
All solutions were prepared from commercially available A.C.S. reagents with deionized water (resistivity ≥ 18 MΩ cm; MilliQ Millipore, USA). Tributyrin, KCl, KH2PO4, K2HPO4, graphite powder 1-2 µm, lipase from Candida rugosa E.C. 3.1.1.3 (5.4 U/mg), Nafion 5% w/v (grams per 100 mL) in a mixture of lower aliphatic alcohols and water (Sigma-Aldrich, USA), lactic casein, egg albumin, soluble starch, sacarose, glucose, sodium benzoate, citric acid, NaCl (Reasol, Mexico). All food samples were purchased at a local supermarket.
All chronopotentiometric measurements were performed using a potentiostat/galvanostat PGSTAT 30 AUTOLAB electrochemical system (Eco Chemie, The Netherland) controlled by means of version 4.5 of GPES software. A conventional three-electrode cell was used for all the experiments integrated with a reference Ag/AgCl double junction electrode with KNO3 10% w/v external solution E = SCE (Orion 900200, Switzerland), a commercial Pt counter electrode and a graphite-epoxy transducer or biosensor as working electrode.
All the lipid emulsions were obtained in a 4% w/v Arabic gum solution by means of 30 minutes of ultrasound dispersion [31]. The stock tributyrin emulsion was prepared weekly and kept at 4 °C until use. The tributyrin standard emulsions were prepared from the stock emulsion by dilution with a pH 7.0 PBS phosphate buffer solution 1 mM in KCl 0.1 M.
Construction of transducer and biosensor
The transducer was constructed as described previously using a cylindrical acrylic tube as electrode body and a copper disc soldered to a shielded cable, where the graphite-epoxy composite is deposited [30]. The weight proportion of graphite-epoxy is 50% w/w (grams per 100 g) graphite powder (Aldrich) and 50% w/w resin: catalyst mixture. One hundred parts of resin (Araldyt HY956, Ciba Geigy) are mixed with 20 parts in mass of catalyst (REM 001, Ciba Geigy). The composite is allowed to cure for 24 h at 40 °C, and once the material is hardened, it is polished to obtain a shining, flat surface.
Once transducer was fabricated, TG biosensors were prepared by means of adding 20 µl of an enzymatic cocktail mixture on the surface of graphite-epoxy composite electrode and evaporating the solvent at room temperature. After evaporation, the biosensor was immersed in PBS (1 mM, pH 7.0) and stored at 4 °C until use. The enzyme cocktail contain 10.6 U of lipase and 0.71% v/v of Nafion in 140 µL of PBS (1 mM, pH 7.0).
Food analysis methodology
In a polypropylene tube are added between 20 and 80 mg of food sample and 8.0 mL of the solution of Arabic gum. The mixture is placed in a water bath at 65 °C for 5 min. The mixture was stirred and filtered; afterward the liquid phase is diluted to 10 mL with deionized water. An aliquot of 1.0 mL of the suspension containing the extracted lipid is added to the electrochemical cell containing 25.0 ml of PBS. TG quantification in the sample was determined by the standard addition method with the triglyceride biosensor.
In order to compare the technique proposed with the Soxhlet conventional 920.39 AOAC analysis method of total fat, food samples were analyzed using petroleum ether as the solvent [32].
TG extracted with Arabic gum, were also determined spectrophotometrically at 505 nm, using the LQ-Triglycerides (SPIREACT, Girona, Spain) kit. The colorimetric method is based in a multienzymatic scheme and the measurement of the absorbance of quinoneimine dye which is obtained after TG proportional hydrogen peroxide reacts with 4-aminophenazone and pchlorophenolin in presence of peroxidase [33]. TG quantification in the sample is done by interpolation on the calibration curve.
Results and discussion
Biosensor optimization
The operation of the designed biosensor is based on the record of the pH changes by the graphite-epoxy electrode, as result of the recognition reaction between triglycerides and the lipase. In this sense, the optimal operation of a biosensor depends on the successful immobilization of biological recognition agent on the transducer surface, preserving its biological activity and stability under working conditions of pH, temperature and ionic strength [34]. After a literature review, we decided the use of a physical entrapment immobilization with Nafion because of the good results obtained [35-37].
In vitro studies for Candida rugosa lipase show that according to the method of immobilizing, the enzyme could work in a pH range of 5.0 to 9.0; nevertheless we can expect a maximum enzyme activity under pH 7.0 because it is the optimum working pH of these biocatalysts [38].
The response of the graphite-epoxy composite transducer showed a sensitivity of -5.3 mV pH-1 in the pH range of interest 6.0-7.0 where we expected the maximum enzyme activity.
The composition of the membrane (enzyme-Nafion) in the construction of biosensors is important because of the control of surface phenomena such as diffusion and reactivity depends on it. The Nafion is an anionic polymer which allows the diffusion of H+ and protecting the electrode surface from interferences in the sample as proteins, carbohydrates and anions. The construction of numerous biosensors based on the use of Nafion, has demonstrated physicochemical and biocompatibility advantages with the recognition agent; increased sensitivity, selectivity and long-term stability of these devices [36, 37].
The effect of the amount of lipase and Nafion concentration on the sensitivity of the potentiometric biosensor of TG, was studied using a full factorial design with three levels 32. Membrane formulations were set by varying the amount of lipase (5.30-15.90 U) and final concentration Nafion (0.36-1.07% v/v) in 140 μL of PBS (1 mM, pH 7.0). Once constructed biosensors, the analytical sensitivity was determinate in the range from 0.08 to 0.48 mM. The matrix design and results obtained are shown in Table 1.
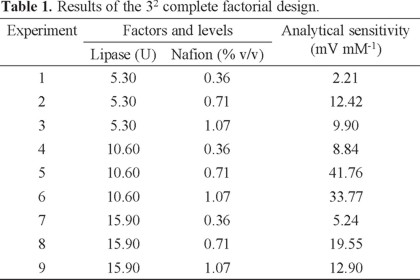
The experimental results were analyzed by analysis of variance in order to estimate the contribution of each variable by means of MINITAB V 15.1 software. program. The obtained analysis shows that both variables are critical, with a percentage of contribution to the overall variance of 49.81% and 43.79% for the concentrations of enzyme and Nafion, respectively. Likewise, the binary interaction is critical to the system. According to the average contributions plot a 10.60 U amount of lipase and 0.71% v/v of Nafion were selected as the optimum (Fig. 1).

The results obtained in this study show that a low level of the amount of enzyme is not enough to obtain a good sensitivity. When operating at the enzyme high levels, an increase in the viscosity of the lipase-Nafion solution is obtained, resulting in a thicker membrane and consequently a decrease in the signal is observed. In agreement with previous reports, the use of approximately 10 U is adequate to perform the TG determination in the range of interest [29, 39].
Nafion optimal concentrations of 0.25-1.00% v/v have been described in the literature and are in agreement with our results. High concentrations of Nafion promote a decrease in the signal, which is also attributed to the increase in the thickness of the membrane [35, 40, 41].
Analytical parameters and interferences
Using the optimal conditions found above, three different biosensors were made and calibration curves were constructed using TB concentrations between 0.08 and 0.48 mM; Fig. 2 shows the potentiometric record obtained. The calibration curve fits to a linear model respect to the concentration of TB (mM) solution according to the equation E/mV = 41.76 ± 1.94 mV/mM [TB] + 12.76 ± 0.64 mV with a value of r2 = 0.998. The limit of detection expressed as 3.29 Se/b1 was 0.02 mM where Se is the square root of the residual variance of the calibration curve and b1 is the analytical sensitivity. The limit of quantification expressed as 10Se/b1 was 0.06 mM and the response time was 2 minutes. The proposed biosensor reaches a limit of detection comparable with potentiometric biosensors described in the literature, but with a shorter response time and linear response range suitable for quantification of TG in food samples [42].
The determination of repeatability and reproducibility was performed using TB concentrations of 0.1, 0.2 and 0.4 mM. The repeatability expressed as RSD% obtained were 7.79, 3.73 and 1.84 (n = 3 independent electrodes measurement on the same day). Reproducibility, expressed as RSD% was 9.02, 8.44 and 5.27, respectively (n = 9, 3 independent electrodes measurements, 3 consecutive days). The values shown in this work are less than 10%, which are suitable for the analysis of TG in food samples.
The main components found in commercial foods are proteins, carbohydrates and additives. Albumin, casein, citric acid, glucose, saccharose, sodium benzoate, sodium chloride and starch, were studied in order to determine if they could cause interference in the quantification of TG. Table 2 shows the levels of interference added to a tributyrin solution, according to the specified on the label of the products tested. The results show recoveries over 95% for all the compounds tested and consequently no significant interferences were found.
Food analysis
The fat extracts obtained by Soxhlet and Arabic gum emulsion, were analyzed by triplicate using the optimized biosensor, quantifying the TB% (% wTB/w) by standard addition method. The validation of the results obtained by the biosensor was performed by enzymatic-UV/Vis methodology [33].
The lipid content extracted for each food group by the Soxhlet method using Arabic gum emulsion, was analyzed by the potentiometric biosensor developed. The TG content by both extraction methods is shown in Table 3. Using statistical analysis t-test, it can be concluded that there is a significant difference between the content of TG obtained by analyzing the extract Soxhlet respect to the obtained with the emulsion in foods rich in protein (chorizo and pate) and fat (mayonnaise); nevertheless, for samples of butter, chips and pastries, the results are statistically equivalent in both cases (Table 3).
Significant differences in the TG content obtained with both extraction methods can be attributed to the difficult separation of lipid from complex samples as cell matrices with lipids covalently bonded to carbohydrates and proteins. Thus, the results of the extraction, differ due to the low efficiency of extraction by emulsion method in the cases where a complete recovery of lipids may require longer time or a combination of solvents in order to solubilize the lipids from the matrix [1].
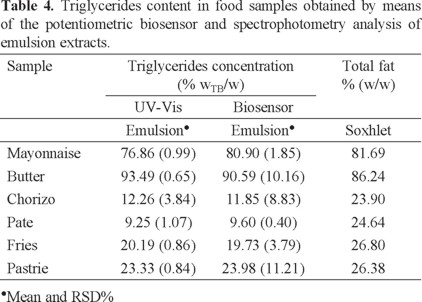
With the aim of validate the developed biosensor, TG content obtained for each food group was obtained by means of the potentiometric biosensor and UV/Vis spectrophotometry using the emulsion extraction of triglycerides technique (Table 4). The TG average values obtained in both cases, were contrasted by one way analysis of variance. The calculated value of F is lower than the tabulated value of F (F1,10 = 4.93, p = 0.05); thus, we can confirm that there are no significant differences between the methods of analysis contrasted and the developed biosensor can be successfully used as a simple and low cost methodology for the triglycerides quantification.
Contrasting the fat content obtained by Soxhlet with TG found by analysis of the emulsion and considering that about 90% of fat are TG; it is possible to distinguish unexpected differences. These results could be attributed to the complicated physical and chemical changes which TG undergoes when are heated to high temperatures, causing dehydration of food and some gases which provoke the hydrolysis of TG. Moreover, the degradation of TG in food products has been associated with high content of carbohydrates and bicarbonates which promote decomposition by hydrolysis [34]. Additionally, it is important to consider that oxygen accelerates oxidation or rancidity of TG [1].
Conclusions
The simple and low cost potentiometric biosensor developed in this work, is the first device which is successfully applied to the quantification of triglycerides in complex samples of food and is based on a novel detection mechanism of pH changes by means of a composite graphite-epoxy as transducer. The analytical methodology for the extraction of TG from food with Arabic gum emulsion, is a solvent free alternative, useful to the analysis of triglycerides.
Acknowledgements
This work was partially supported by Universidad Autónoma del Estado de Hidalgo and CONACyT (Ref: 62462, and the CONACyT project INFR-2014-22799). J.C.E.M. is grateful for studentship granted by CONACyT (441228). The authors also wish to thank the SNI for the distinction of their membership and the stipend received.
References
1. Akon, C.C.; Min D.B. Food Lipids, Marcel Dekker, New York, 2008. [ Links ]
2. Berglund, L.; Sacks, F.; Brunzell, J.D. Clin. Lipidol. 2013, 8, 1-4. [ Links ]
3. Miller, M.; Stone, N.J.; Ballantyne, C.; Bittner, V.; Criqui, M.H.; Ginsberg, H.N.; Goldber, A.C.; Howard, W.J.; Jacobson, M.S.; Kris-Etherton, P.M.; Lennie, T.A.; Levi, M.; Mazzone, T.; Pennathur, S. Circulation 2011, 123, 2292-2333. [ Links ]
4. Pundir, C.S.; Narang, J. Int. J. Biol. Macromol. 2013, 61, 379-389. [ Links ]
5. Dillon, J.T.; Aponte, J.C.; Tarozo, R.; Huang, Y. J. Chromat. A. 2012, 1240, 90-95. [ Links ]
6. Aparicio, R.; Aparicio-Ruı́z, R. J. Chromat. A. 2000, 881, 93-104. [ Links ]
7. Turtygin, A.V.; Deineka, V. I.; Deineka, L.A. J. Anal. Chem. 2013, 68, 558-563. [ Links ]
8. Adlof, R.O.; Menzel, A.; Dorovska-Taran V. J. Chromat. A. 2002, 953, 293-297. [ Links ]
9. Redden, P.R.; Huang, Y.S.; Lin, X.; Horrobin, D.F. J. Chromat. A. 1995, 694, 381-389. [ Links ]
10. Lipp, M. Food Chem. 1995, 54, 213-221. [ Links ]
11. Bernal, J.L.; Martín, M.T.; Toribio, L. J. Chromat. A. 2013, 1313, 24-36. [ Links ]
12. Okazaki, M.; Komoriya, N.; Tomoike, H.; Inoue, N.; Usui, S.; Itoh, S.; Hosaki, S. J. Chromat. B. 1998, 709, 179-187. [ Links ]
13. Buchgraber, M.; Ulberth, F.; Emons, H.; Anklam, E. Eur. J. Lip. Sci. Tech. 2004, 106, 621-648. [ Links ]
14. Simoneau, C.; Hannaert, P.; Anklam, E. Food Chem. 1999, 65, 111-116. [ Links ]
15. Buchgraber, M.; Ulberth, F.; Anklam, E. Eur. J. Lip. Sci. Tech. 2003, 105, 754-760. [ Links ]
16. Bosque-Sendra, J.M.; Cuadros-Rodríguez, L.; Ruiz-Samblás, C.; Paulina de la Mata, A. Anal. Chim. Acta 2012, 724, 1-11. [ Links ]
17. Buchgraber, M.; Ulberth, F.; Anklam, E. J. Chromat. A. 2004, 1036, 197-203. [ Links ]
18. Mayer, B.X.; Zöllner, P.; Lorbeer, E.; Rauter, W. J. Sep.ion Sci. 2002, 25, 60-66. [ Links ]
19. Byrdwell, W.C.; Emken, E. A.; Neff, W. E.; Adlof, R.O. Lipids 1999, 31, 919-935. [ Links ]
20. Gerbig, S.; Takáts, Z. Rap. Commun. Mass Spectrom. 2010, 24, 2186-2192. [ Links ]
21. Grigoriadou, D.; Tsimidou, M.Z. Eur. J. Lip. Sci. Tech. 2006, 108, 61-69. [ Links ]
22. Klotzsch, S.G.; McNamara, J.R. Clinical Chem. 1990, 36, 1605-1613. [ Links ]
23. McGowan, M.W.; Artiss, J.D.; Strandbergh, D.R.; Zak, B. Clinical Chem. 1983, 29, 538-542. [ Links ]
24. Wu, C.; Liu, X.; Li, Y.; Du, X.; Wang, X.; Xu, P. Biosen. Bioelectr. 2014, 53, 26-30. [ Links ]
25. Jeong, C.Y.; Han, Y.D.; Yoon, J.H.; Yoon, H.C. J. Biotech. 2014, 175, 7-14. [ Links ]
26. Phongphut, A.; Sriprachuabwong, C.; Wisitsoraat, A.; Tuantranont, A.; Prichanont, S.; Sritongkham, P. Sensors and Actuators B: Chemical 2013, 178, 501-507. [ Links ]
27. Ben Rejeb, I.; Arduini, F.; Amine, A.; Gargouri, M.; Palleschi, G. Anal. Chim. Acta 2007, 594, 1-8. [ Links ]
28. Tkac, J.; Svitel, J.; Novak, R.; Sturdik, E. Anal. Lett. 2000, 33, 2441-2452. [ Links ]
29. Kumar Reddy, R.R.; Basu, I.; Bhattacharya, E.; Chadha, A. Curr. Appl. Phys. 2003, 3, 155-161. [ Links ]
30. Rodríguez Huerta, L.A.; Galán-Vidal, C.A.; Álvarez Romero, G.A.; Páez-Hernández, M.E. Rev. Mex, Fís. 2006, 52, 17-19. [ Links ]
31. Jurado, E.; Camacho, F.; Luzón, G.; Fernández-Serrano, M.; García-Román, M. Biochem. Eng. J. 2008, 40, 473-484. [ Links ]
32. Helrich K. (ed). Official methods of analysis of the Association of Official Analytical Chemists. AOAC Inc., Arlington, 1990. [ Links ]
33. Bucolo, G.; David, H. Clinical Chem. 1973, 19, 476-482. [ Links ]
34. Sassolas, A.; Blum, L.J.; Leca-Bouvier B.D. Biotechnol. Adv. 2012, 30, 489-511. [ Links ]
35. Lukachova, L.V.; Karyakin, A.A.; Karyakina, E.E.; Gorton, L. Sensors and Actuators B: Chemical 1997, 44, 356-360. [ Links ]
36. Jue, L.; Lawrence, T.; Drzal; Robert, M.; Worden; Ilsoon, L. Chemistry Materials 2007, 19, 6240-6246. [ Links ]
37. Vamvakaki, V.; Chaniotakis, N.A. Sensor and Actuators B. 2007, 126, 193-197. [ Links ]
38. Wu, Z.; Zhou, W.; Jiang, X.; Ma, J.; Zhang, H.; Song, H. Process Biochem. 2012, 47, 953-959. [ Links ]
39. Fernandez, R.E.; Bhattacharya, E.; Chadha, A. Appl. Surf. Sci. 2008, 254, 4512-4519. [ Links ]
40. Syed, M.; Usman, A.; Nura, O.; Willandera, M.; Danielsson, B. Sensors and Actuators B. 2010, 145, 869-874. [ Links ]
41. Syed, M.; Usman, A.; Alvia, N. H.; Ibupotoa, H.; Nura, O.; Willandera, M.; Danielsson, B. Sensors and Actuators B. 2011, 152, 241-247. [ Links ]
42. Tkac, J.; Vostiar, I.; Gorton, I.; Gemeiner, P.; Sturdik, E. Biosensors and Bioelectronics 2003, 18, 1125-1134. [ Links ]

