


Services on Demand
Journal
Article
 English (pdf)
 Article in xml format
 Article references
 Send this article by e-mail
Indicators
-
 Cited by SciELO
 -
 Access statistics
Related links
-
 Similars in
SciELO
Similars in
SciELO
Share

 Permalink
Journal of the Mexican Chemical Society
Print version ISSN 1870-249X
J. Mex. Chem. Soc vol.59 n.1 Ciudad de México Jan./Mar. 2015
Article
Chemometrics as a Tool in the Study of Lead Toxicity in Rats
Judith Amador-Hernández,1,3,* Leticia Guadalupe Navarro Moreno,1 Miguel Velázquez Manzanares,1† Iliana Margarita de la Garza Rodríguez,2 Edith Madaí Colunga Urbina,2 and Mariazel Hernández Sánchez1
1 Instituto of Biotecnología, Universidad del Papaloapan, Circuito Central 200, 68301 San Juan Bautista Tuxtepec, Oaxaca, México.
2 Faculty of Chemistry, Universidad Autónoma de Coahuila, Blvd. V. Carranza s/n, 25280 Saltillo, Coahuila, Mexico.
3 Present address: Facultad de Química. Universidad Autónoma de Coahuila, Blvd. V. Carranza s/n, 25280 Saltillo, Coahuila, México. amadorjudith@live.com.mx
Received May 7th, 2014
Accepted August 18th, 2014
Abstract
In this work, chemometric tools were applied to establish correlations between biomarkers for identifying the most significant ones in relation to acute exposure of Wistar rats to Pb. The metal content in biological matrices (serum, urine, liver, brain, and kidney), biochemical parameters (protein content, activity of the Glutathione S-Transferase enzymes, and urinalysis), apart from morphological measurements of organisms, were estimated in both the exposed and the control groups and submitted to Significance tests, Principal Component Analysis, Hierarchical Cluster Analysis, and Generalized Procrustean Analysis. It could be observed that Pb in serum, but not in erythrocytes, was the biomarker associated with the Pb content in kidney and other parameters related to this organ. In the same way, Pearson correlation coefficients emphasized the relation between Pb in serum and these variables, with the exception of kidney weight. Additionally, Pb in serum was found to be the biomarker with the greatest difference between the control and the exposed groups, which converts it into the most sensitive biomarker in the present study.
Key words: Chemometrics, Pb, Toxicity, Rats, Kidney.
Resumen
En el presente trabajo, se aplicaron herramientas quimiométricas para establecer las correlaciones entre biomarcadores e identificar los más significativos en relación a la exposición aguda de ratas Wistar a Pb. El contenido del metal en matrices biológicas (suero, orina, hígado, cerebro y riñón), parámetros bioquímicos (contenido de proteína, la actividad de enzimas Glutatión S-Transferasas y análisis de orina), además de mediciones morfológicas a los organismos, se estimaron en los grupos control y expuesto y fueron sometidos a Contrastes de Significación, Análisis de Componentes Principales, Análisis Jerárquico de Conglomerados y Análisis de Procrustes Generalizado. Pudo observarse que el Pb en suero y no en eritrocitos fue el biomarcador asociado con el Pb en riñón y otros parámetros relacionados con este organismo, lo que pudo corroborarse a través de los coeficientes de correlación de Pearson, a excepción de Pb en suero y peso del riñón. Además, el contenido de Pb en suero fue el biomarcador con la mayor diferencia entre el grupo control y el expuesto, lo que lo convierte en el biomarcador más sensible en el presente estudio.
Palabras clave: Quimiometría, Pb, toxicidad, ratas, riñón.
Introduction
Lead (Pb) is a nonessential heavy metal for living organisms. Unique properties of lead, such as its softness, low melting point, high density and relative low conductivity, as well as its high resistance to corrosion, have resulted in many industrial applications. For example, it is used in storage batteries, cable covering, plumbing, ammunition, paints, and glazed pottery [1]. As a result, it is widely distributed in air, water, soil, and food [2-4].
Acute and prolonged exposure to lead causes severe health damage in humans and animals, by affecting the gastrointestinal, hematopoietic, cardiovascular, nervous, immune, reproductive and excretory systems [5, 6]. One way to determine lead toxicity in living organisms is its quantification in body fluids, especially in serum and urine. It has been shown that this procedure should be accompanied by clinical evidence and biochemical assays in order to make a good diagnosis of poisoning by this element [7, 8].
Several analytical techniques can be used to determine Pb in biological samples, such as Atomic Absorption Spectrometry (AAS), Inductively Coupled Plasma-Atomic Emission Spectrometry (ICP-OES), and Voltammetry. Particularly, Electrothermal Atomic Absorption Spectrometry (ETAAS) offers enough sensitivity to quantify the element at trace levels in a wide variety of matrices [9-11].
On the other hand, different parameters have been considered as biomarkers for lead exposure, whose measurement may change as a result of direct or indirect exposure to the metal [5, 12-14]. In general, biomarkers include chemical, biochemical, physiological, histological, and morphological determinations related to the state of health of living beings, such as enzymatic activity, stress proteins, gene expression, size, and weight, among others.
Nowadays, the necessity to carry out the quantification of physical, chemical and/or biochemical parameters in living beings in order to study the toxicity of pollutants from a holistic point of view has been clearly recognized. However, the analysis of information is difficult, given the heterogeneity in a) the nature and magnitude of the evaluated parameters, b) the uncertainty of the measurement procedures, and c) the response of the organisms. Therefore, several chemometric tools were applied in this work to establish the correlation between biomarkers and to identify the most significant ones in relation to lead exposure.
Results
Initially, an evaluation of the normal distribution of data belonging to biomarkers was performed, based on statistical tests used through the work focus on this condition. Most of them showed a normal distribution, except for the activity of the enzyme Glutathione S-transferases (GSTs); therefore, data were converted to their logarithmic form [15]. Also, the Dixon and Grubbs tests were applied to eliminate outliers of data sets.
Statistically significant biomarkers in exposure and control groups
In order to test whether the difference in the variances between the control and the exposure data sets was significant, the F-test was applied to all the parameters under study. Depending on whether a difference between the variances was significant or not, distinct t-test equations were used to compare the arithmetic means of control and exposure groups [16]. In summary, the variables that showed significant variations between both groups were nine: kidney weight (Ki-We), liver weight (Li-We), urine volume at the end of study (Ur-En), lead in serum (Pb-Se), lead in erythrocytes (Pb-Er), lead in kidney (Pb-Ki), proteins in blood (Pr-Bl), proteins in brain (Pr-Br), and GSTs in kidney (GST-K).
Interrelation of biomarkers and lead exposure
At this point, parametric tests were applied in an effort to estimate relationships between the nine biomarkers that showed significant differences between the control and the exposed groups.
Initially, the Pearson correlation coefficients (r) were performed to identify correlations between pairs of variables; data of control (five specimens) and exposed rats (6 specimens) were included in all cases. The results are shown in Table 1, in which highlighted values were recognized as significant according to the t-test for r [15]. The highest statistical correlation was observed for urine volume at the end of the study with GSTs in kidney, taking into account the eleven specimens, followed by kidney weight and GSTs in kidney. In general, biomarkers related to kidney function were highly correlated.
For Principal Component Analysis (PCA), data were arranged in a matrix with the eleven objects (control and exposed specimens) described by nine independent variables (biomarkers); autoscaling was used as pre-processing strategy, since the variables were expressed in different units. The selection of the optimal number of PCs (Principal Components) was carried out according to the F-test criterion for variances [17]. Two factors were considered as optimal to describe the information. The criteria of the minimum PRESS value (Prediction Error Sum of Squares) as well as its first local minimum were also applied and coincided with the selection of factors through the F-test criterion [18, 19]. No data were identified as outliers according to the Mahalanobis distance, and two PCs were considered optimal.
The distribution of the control and exposed specimens in the new space defined by the two PCs can be observed in Fig. 1, in which two groups are distinguished along the first PC, the most significant in data compression [20]. Later, Cluster Analysis (CA) via the K-means technique (K-means CA) with two a priori groups was applied, where the scores of the two significant PCs were considered as data. As a result, the groups framed by the ovals were identified according to this technique of unsupervised pattern recognition. A clear distinction between exposed and control specimens was found as expected when considering biomarkers screened by previous Significance tests.

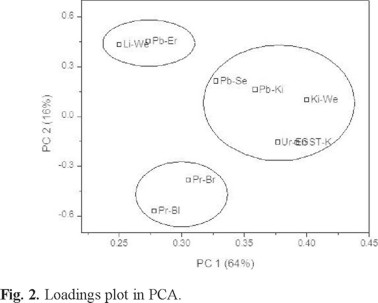
On the other hand, the distribution of biomarkers in the new space defined by the two PCs can be observed in Fig. 2 (loadings graph). As can be seen, there are four parameters on the right side of PC 1 which are clearly associated with each other: Pb in serum, Pb in kidney, final urine volume, kidney weight and kidney GSTs. Further, Pb in erythrocytes and liver weight showed a second trend at the upper extreme of PC 2, while at the bottom of the same PC, proteins in brain and in blood were distinguishable as another group. Associations described by the ovals were identified by K-means CA, considering three a priori groups, which coincides with the visual inspection of the PCA graph. As can be observed, Pb in serum was related to the kidney group and liver weight, while Pb in erythrocytes forms a second group, and proteins in blood and brain are in a third one.
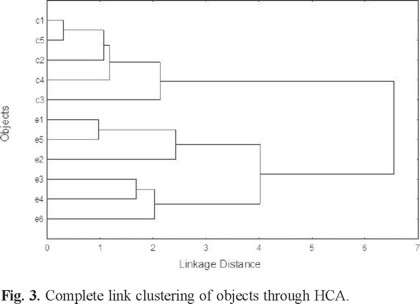
Subsequently, Hierarchical Cluster Analysis (HCA) was applied to control and exposed specimens characterized by the nine significant biomarkers to explore if analogous results to PCA/K-means CA could be obtained. In this case, HCA was based on the euclidean distance to identify similarity between objects. Single, complete and centroid link clustering algorithms were used. Single and complete link clustering coincided in almost all cases; therefore, the third option was selected through the work. It can be highlighted that complete link clustering resulted in virtually the same associations as in PCA (see Figs. 3 and 4). Control and exposed groups was clearly differentiated, as can be observed in Fig. 3. On the other hand, proteins in blood and brain were identified in a subgroup; at a second level of hierarchy, a subset of liver weight and Pb in erythrocytes was recognized, while the other parameters remained in a third subset (see Fig. 4).

When reviewing the Pearson coefficients r with PCA and K-means CA results, it was observed that Pb in serum showed significant correlations with Pb in kidney, GSTs in kidney and final volume of urine; only kidney weight had no significant correlation with it (0.60). Therefore, K-means CA established this parameter within the kidney group. Moreover, proteins in blood and brain showed the highest correlation if compared individually with the rest of variables, coinciding with their integration into a group by unsupervised pattern recognition techniques. Pb in erythrocytes and liver weight were not significantly correlated, although both parameters were associated with the same group by PCA and K-means CA, or HCA.
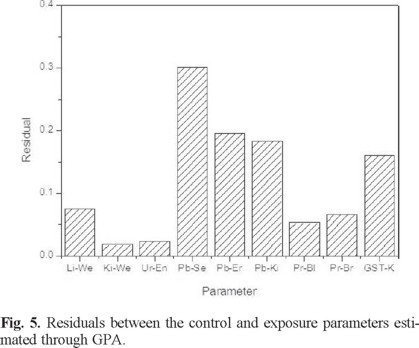
Later, a comparison of biomarkers was performed through the Generalized Procrustes Analysis (GPA) to identify those which show the greatest difference between the control and the exposed group. This technique involves transformations of data (i.e., translation, rotation, reflection) to provide optimal comparability [15, 21]. In this case, two matrices of nine rows (significant biomarkers) and six columns (specimens) were considered. Because the control group only had five organisms, a column with zero (padding) was added, since the technique requires the same number of columns in both data sets. Also, it was necessary to normalize data in each row, to reduce the scaling effect in each variable. According to a multiple Analysis of Variance (ANOVA), rotation and translation showed significant transformation of data, in contrast to the rescaling due to the previous normalization.
Fig. 5 represents the residuals by object. As can be seen, Pb in serum showed the least consensus (or similarity) between the two groups (control and exposed), while kidney weight showed the greatest similitude. In other words, Pb in serum showed the greatest difference between the control and the exposed group, which converts it into the most sensitive biomarker for lead exposure in this study.
Finally, urinalysis (UA) parameters (namely glucose, ketone bodies, bilirubin, urine specific gravity, blood, pH, protein, urobilinogen, nitrites, and leukocytes) were considered for PCA, HCA and GPA. First, data corresponding to both nominal (e.g. nitrites) and ordinal (e.g. blood) variables were transformed to integers [22] and submitted to autoscaling before the application of exploratory techniques.
Unsatisfactory results were observed, because the control and the exposed group were indistinguishable; in consequence, discriminatory capacity between biomarkers was in doubt. It is probable that better results may be obtained by Multicategoric Logistic Regression, which analyzes associations among multiple categorical response variables, but that is beyond the scope of this work. Therefore, only urinalysis results were used to complete the diagnosis of the health status of organisms.
Discussion
It is well known that Pb can damage a large number of vital organs in humans and other living beings [23, 24]. Tissues are more likely to accumulate it in high concentrations, especially in the kidney, where morphological and biochemical alterations are known as nephrotoxicity [25-28]. Particularly, the presence of this metal in mammals induces extensive damage in renal proximal tubule cells [30].
In the next step, only those parameters that showed significant differences between the values of the exposed and the control groups will be discussed; undoubtedly, changes in the route of entry, the dose of Pb supplied, or the exposure period, could lead to the recognition of other biomarkers as significant.
Statistically significant biomarkers in exposure and control groups
The weight of the liver (7.4 ± 0.8 g) and kidney (2.2 ± 0.3 g) of rats exposed to lead was greater than the weight of these organs in the control animals (5.0 ± 0.5 g for liver, 1.3 ± 0.1 g for kidney). It is probable that the organisms respond to the osmotic stress produced by the presence of Pb in the cells by increasing the amount of water to reduce its concentration, thus causing edema in organs. A similar result was found by the group of Rader et al., who reported a significant change in the kidney weight of rats upon a chronic exposure to lead [31]. However, Luján et al. did not find significant changes in the liver weight of pregnant rats exposed to lead for 21 days [32].
As expected, lead concentration in the kidney of control rats was not detectable, in contrast to the level determined in the same organ of exposed rats (38 ± 19 mg kg-1), similar to the results reported by Rader et al. [31]. It has been suggested that the proximal tubule cells of the kidney possess mechanisms for transferring lead through the membrane, such as the transport of divalent cations reported for mammalian renal cells [33].
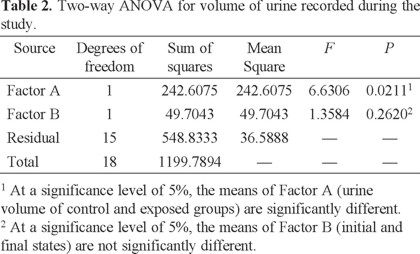
Another significant biomarker of renal malfunction was the volume of urine. While measuring this volume collected over a period of 12 h at the beginning of the treatment, a non-significant variation between the control and the exposed organisms was observed (13 ± 7 mL and 13 ± 8 mL, respectively). However, a significant difference between both groups (8 ± 4 mL and 24 ± 4 mL, respectively) was noted at the end of the experimental period, which was corroborated by the Two-Way ANOVA (Table 2).
Also, the blood lead content (sum of lead in serum and erythrocytes) was statistically different between exposed (690 ± 56 mg/ kg) and control rats (30 ± 32 mg kg-1), analogous to the results obtained by other research teams [32, 34-36]. Studies suggest that blood cells have a high affinity for lead; about 99% of the metal in blood is localized in erythrocytes, making them more vulnerable to oxidative damage than many other cells [37]. It has been proposed that in erythrocytes lead cell uptake occurs through anion exchange [38].
The determination of protein in biological samples was necessary to adjust its content before measuring the activity of GSTs. Additionally, it was observed that protein in the blood (0.96 ± 0.09) and brain (0.64 ± 0.04) of the exposed group was statistically different from that obtained in control rats (0.83 ± 0.06 and 0.57 ± 0.02, respectively). Unfortunately, these values are not usually reported by other authors, and therefore such a comparison cannot be done.
On the other hand, GSTs are a family of cytosolic enzymes involved in the detoxification of a range of xenobiotic compounds by conjugation to glutathione. GSTs have been proposed as sensitive markers of renal cell integrity [39], whose activity can increase with the presence of xenobiotics, depending on GSTs isoforms and the organ of interest. It explains why GSTs in kidney showed significant differences between the control (1.5 × 10⁻³ ± 4.0 × 10⁻⁴) and the exposed group (4.2 × 10⁻³ ± 4.0 × 10⁻⁴) as a consequence of damage caused by the element, similar to that reported by Dagget [40].
In urinalysis, the increase of blood and protein in samples of the exposed group indicated glomerular damage. Also, the change in pH indicated damage in the loop of Henle and the distal tubule, and ketone and bilirubin increases indicated a disturbance in ketone levels in the body's metabolism and hemoglobin.
Interrelation of biomarkers and lead exposure
Through studies on animals and humans, it has been observed that the Pb absorbed by organisms is distributed rapidly and simultaneously to blood, soft tissue and bone. In both humans and rats, the highest concentrations of Pb in the soft tissue have been found in liver and kidney, with a much smaller proportion in the brain [1]. In this work, several exploratory chemometric techniques were used in an effort to find relationships between the biomarkers under study.
It is recognized that lead in blood is mainly associated with erythrocytes, rather than with plasma or serum [41]. However, several authors have proposed that Pb in serum is better in reflecting the fraction of the element that is available for exchange with the kidney or the central nervous system [42-44]. It explains why Pb in serum and not in erythrocytes was the biomarker associated with the Pb concentration in the kidney and other parameters related to this organ (GSTs in kidney, kidney weight and final volume of urine), as was observed in Figs. 2 (PCA/K-means CA) and 4 (HCA). In the same way, Pearson correlation coefficients emphasized the relation between Pb in serum and these variables, with the exception of kidney weight. Additionally, Pb in serum was found to be the variable with the greatest difference between the control and the exposed groups after the application of GPA (Fig. 5), followed by Pb in erythrocytes and Pb in kidney.
Related to these results, O'Flaherty found that the Pb concentration in the urine excretion of humans was directly proportional to the Pb concentration in serum, but not with blood concentration [45]. Another aspect to be considered is that the relationship between the Pb concentration in both blood and serum is not nonlinear, which in part is due to the limited sites for the erythrocytes to bind to the metal [46]. Therefore, the fraction of the element in serum increases disproportionately at high concentrations of Pb in blood [47]. It can explain why Pb in erythrocytes and Pb in serum do not correspond to the same group.
In relation to the association of other variables with kidney in the same group, it is clear that this is the result of the nephrotoxicity of the element. Acute exposure to this metal causes changes in the proximal tubule, such as intra-nuclear inclusions composed of Pb and proteins bound to Pb, which act as reservoirs for the metal that could not be diffused; hence the high concentrations of Pb identified in this organ. Also, an increase in urinary excretion as in this work has been observed elsewhere [1]. The weight gain of the organ may be associated with a generalized renal failure. Finally, GSTs mediated the detoxification of the organism in the presence of exogenous compounds [48-50], and therefore it was found in appreciable concentrations in this organ.
With respect to Pb in erythrocytes and liver weight, a physiological relationship between them could not be identified; its association probably responds to the ability of lead to interfere in several biochemical processes at the cellular level. The inclusion of additional liver biomarkers could be of relevance to explore the possibility of a similar interrelationship to that observed for kidney biomarkers.
Regarding the protein in blood and in brain, an increase in the content of low molecular weight proteins in urine, blood and certain soft organs in humans exposed to this element has been identified as a result of the detoxification process [51-53].
In conclusion, Pb caused a broad spectrum of multisystem adverse effects on organisms. Chemometric strategies were useful to compare control and exposed groups and to identify the most significant parameters in Pb poisoning. These results were in line with those found by other authors in similar studies.
In particular, the multivariate techniques of PCA, K-means CA, HCA, and GPA helped to identify associations between variables according to the physiology of poisoned specimens. Pb in serum and Pb in erythrocytes were the most relevant biomarkers identified by GPA, since major differences between control and exposed specimens were found. These results are of great interest, considering that GPA has not been used previously to analyze toxicological results, as far as it is known by the authors, and taking into account that it can be widely justified from a physiological point of view. Pb in serum showed the greatest difference between the control and the exposed group, which converts it into the most sensitive biomarker in the study of lead exposure.
Experimental
Apparatus and reagents
An Atomic Absorption Spectrometer (model Analyst 400) was used, coupled with a graphite furnace (model HGA-900) and an auto-sampler (model AS-800), all from Perkin Elmer. An electrode-less discharge lamp for Pb was also used, as well as a UV-Visible spectrophotometer model LAMBDA 25 from Perkin Elmer. Metabolic cages for rats were from Nalgene.
All reagents and solvents were at least analytical grade. A standard solution of Pb 1 000 mg mL-1 in 2% HNO3 V/V was acquired from High-Purity Standards. Nitric acid (HNO3), hydrochloric acid (HCl), hydrogen peroxide (H2O2), and ammonium dibasic phosphate ((NH4)2HPO4) from Sigma Aldrich were applied for metal analysis. Ultrapure water was also used, obtained through a ThermoBarnstead system.
Groups of study
Eleven Wistar male and female rats with body weights of approximate 200 g were placed in sterile cages with sawdust beds at constant ambient conditions (three rats per cage, 16 to 20 °C of temperature). Rodents were fed a normal diet and drinking water. A control group (five rats) and one group that was exposed to Pb (six rats) were submitted to identical analyses. For the latter group, rats were intoxicated intraperitoneally with 25 mg of lead acetate per kilogram of body weight per dose. The intoxication period was of 15 days, in which time seven doses were administered (once every 48 h).
Weight control of rats was carried out from the start, each third day. Serum and urine were sampled at the beginning and the end of the experiment. For urine samples, the animals were placed in metabolic cages under normal feeding conditions and the samples were collected after periods of 12 h. The blood samples were obtained directly from the renal artery putting the rat to death, and serum was separated from erythrocytes. The liver, kidneys, and brain samples were collected after cervical dislocation of the animal and were kept in a phosphate buffer pH 7.4 under frozen conditions until analysis.
Determination of lead in biological samples
Sample treatment and analysis of both serum and erythrocytes were carried out in accordance with the Mexican Standard Method [54]. Urine samples were stored at 2-8 °C and passed through nylon syringe filters of 0.45 µm pore size before ETAAS analysis. Portions of 0.1 to 0.5 g of dry solid samples were weighed carefully upon availability and submitted to wet acid digestion. To those, successive aliquots of aqueous HNO3 (1:1, V/V), HNO3, H2O2 at 30% V/V and HCl were added and heated under reflux conditions for at least two hours [55]. After digestion, the samples were filtered, transferred to 50 mL volumetric flasks, and filled up with ultrapure water. Operating conditions of ETAAS were those suggested by the manufacturer.
Biochemical assays
Protein quantification was carried out according to the Lowry method, using serum albumin for the calibration curve. Sample aliquots were successively mixed with sodium deoxycholate, sodium carbonate, sodium hydroxide, sodium potassium tartrate, cupric sulphate, and the Folin-Ciocalteu reagent; absorbance was registered at 750 nm against a reagent blank.
The activity of the GSTs was measured in liver, kidney and brain samples after removal of the tissue and homogenization in a solution of phosphates, ethylenediaminetetraacetic acid disodium salt and potassium chloride. A total protein content of 1 mg mL-1 was adjusted in each sample. Then, aliquots of the samples, a phosphate buffer pH 6.5, dinitrochlorobenzene as substrate, and reduced glutathione were transferred to a spectrophotometric cell to follow the enzyme kinetics at 350 nm.
The urinalysis (UA) was performed using a kit (URI-10P). The results were obtained by following the instructions for each test.
Chemometric analysis of toxicological data
Initially, the normal distribution of data was tested according to the Shapiro-Wilk and Anderson-Darling algorithms through the statistical package XLSTAT v2012.5.01 by Addinsoft. Identification of outliers (Dixon and Grubbs tests) as well as the comparison of variances (F-test) and means (t-test) was performed through spreadsheets generated from Microsoft Office 2010. A Two-Way ANOVA was used to look for significant differences in urine volume between control and exposed groups, through the package Origin Pro 8 by Origin Lab Corporation. Correlation between pairs of biomarkers was established by means of the Pearson correlation coefficient r through the statistical package Statistica 99 of StatSoft Inc. When required, a significance level of 5% was considered in all cases (α= 0.05).
The algorithms of the Principal Component Analysis and the Hierarchical Cluster Analysis (Pirouette v3.11 of Infometrix), as well as the unsupervised pattern recognition technique of the K-means (Statistica 99 of StatSoft Inc.) were applied for the simultaneous analysis of biomarkers. Finally, the Generalized Procrustean Analysis (XLSTAT v2012.5.01 of Addinsoft) was used to identify the variable with the most significant difference between the control and exposed values [15, 16].
Acknowledgements
The authors gratefully acknowledge the facilities and funds provided by the Universidad del Papaloapan and the Universidad Autónoma de Coahuila to perform this work.
References
1. IARC, International Agency of Research on Cancer. Inorganic and organic lead compounds. World Health Organization, Lyon France, 2006. Available from: http://www.inchem.org/documents/iarc/vol87/volume87.pdf, cited 2014 May 4th. [ Links ]
2. Laidlaw, M. A. S.; Zahran, S.; Pingitore, N.; Clague, J.; Devlin, G.; Taylor, M.P. Environ. Pollut. 2014, 184, 238-246. [ Links ]
3. Pradit, S.; Pattarathomrong, M.S.; Panutrakul, S. Procedia Soc. Behav. Sci. 2013, 91, 573-580. [ Links ]
4. Mushak, P. Lead and public health: science, risk and regulation. Elsevier, Amsterdam, 2011. [ Links ]
5. Kang-Sheng, L.; Jia-Hu, H.; Yu, Z.; Fan-Chun, D.; Ping-Qing, G. Chinese Med. Sci. J. 2013, 28, 178-188. [ Links ]
6. García-Lestón, J.; Méndez, J.; Pásaro, E.; Laffon, B. Environ. Int. 2010, 36, 623-636. [ Links ]
7. Yazbeck, C.; Cheymol, J.; Dandres, A.M.; Barbéry-Courcoux, A.L. Arch. Pediatrie 2007, 14, 15-19. [ Links ]
8. Boris, N.W.; Hagino, O.R.; Steiner, G.P. J. Am. Acad. Child. Psy. 1996, 35, 1050-1054. [ Links ]
9. Daftsis, E.J.; Zachariadis, G.A. Talanta. 2007, 71, 722-730. [ Links ]
10. Stupar, J.; Dolinsek, F.; Erzen, I. Ecotox. Environ. Safe. 2007, 68, 134-143. [ Links ]
11. Pereira Santos, L.F.; Sitonio Trigueiro, I.N.; Azevedo Lemos, V.; Nóbrega Furtunato, D.M.; Vieira Cardoso, R.C. Brazil. Food Control. 2013, 33, 193-199. [ Links ]
12. McCarthy, J.F.; Shugart, L.R. (eds.). Biomarkers of environmental contamination. Lewis Publishers, Boca Raton, FL. 1990. [ Links ]
13. Hambach, R.; Droste, J.; D'Haese, P.; Lison, D.; François, G.; De Schryver, A.; van Sprundel, M. Toxicol. Lett. 2012, 211, S37. [ Links ]
14. Andrade, V.; Mateus, M.L.; Batoréu, M.C.; Aschner, M.; Marreilha dos Santos, M.P. NeuroToxicology 2013, 38, 33-41. [ Links ]
15. Massart, D.L.; Vandeginste, B.G.M.; Buydens, L.M.C.; De Jong, S.; Lewi, P.J.; Smeyers-Verbeke, J. Handbook of chemometrics and qualimetrics: parts A and B. Elsevier, Amsterdam, 1997. [ Links ]
16. Miller, J.N.; Miller, J.C. Statistics and chemometrics for analytical chemistry, sixth edition. Pearson Education Canada, Toronto, 2010. [ Links ]
17. Haaland, D.M.; Thomas, E.V. Anal. Chem. 1988, 60, 1193-1202. [ Links ]
18. López-de-Alba, P.L.; López-Martínez, L.; Wrobel-Kaczmarczyk, K.; Wrobel-Zasada, K.; Amador-Hernández, J. Anal. Chim. Acta 1996, 330, 19-29. [ Links ]
19. López-de-Alba, P.L.; López-Martínez, L.; Wrobel-Kaczmarczyk, K.; Wrobel-Zasada, K.; Amador-Hernández, J. J. Radioanal. Nucl. Chem. Letters. 1997, 220, 167-171. [ Links ]
20. Naes, T.; Isaksson, T.; Fearn, T.; Davies, T.A. User-friendly guide to multivariate calibration and classification. NIR Publications, Chichester, UK. 2002. [ Links ]
21. Igual, L., Perez-Sala, X., Escalera, S., Angulo, C., De la Torre, F. Pattern Recogn., 2014, 47, 659-671. [ Links ]
22. Gifi, A. Nonlinear Multivariate Analysis. Wiley, New York, 1990. [ Links ]
23. Villeda-Hernández, J.; Barroso, R.; Méndez, M.; Nava, C.; Huerta, R.; Ríos, C. Brain Res. Bull. 2001, 55, 247-251. [ Links ]
24. El-Sokkary, G.H.; Kamel, E.S.; Reiter, R.J. Cell. Mol. Biol. Lett. 2003, 8, 461-470. [ Links ]
25. Loghman-Adham, M. Environ. Health Perspect. 1997, 105, 928-938. [ Links ]
26. Patra, R.C.; Swarup, D.; Dwidedi, S.K. Toxicology 2001, 162, 81-88. [ Links ]
27. Antonio García, T.; Corredor, L. Ecotox. Environ. Safe. 2004, 57, 184-189. [ Links ]
28. Muntner, P.; Menke, A.; Batuman, V.; Rabito, F.A.; He, J.; Tood, A.C. Environ. Res. 2007, 104, 396-401. [ Links ]
29. Wang, L.; Chen, D.; Cao, J.; Liu, Z. Hum. Exp. Toxicol. 2009, 28, 221-229. [ Links ]
30. Navarro-Moreno, L.G.; Quintanar-Escorza, M.A.; González, S.; Mondragón, R.; Cerbón-Solorzano, J.; Valdés, J.; Calderón-Salinas, J.V. Toxicol. in Vitro 2009, 23, 1298-1304. [ Links ]
31. Rader, J.I.; Celesk, E.M.; Peeler, J.T.; Mahaffey, K.R. Toxicol. Appl. Pharm. 1983, 67, 100-109. [ Links ]
32. Luján, M.E.; Corredor, L.; Antonio, M.T. J. Trace Elem. Med. Bio. 2007, 21, 210-216. [ Links ]
33. Sabath, E.; Robles-Osorio, M.L. Nefrología. 2012, 32, 279-86. [ Links ]
34. Adonaylo, V.N.; Oteiza, P.I. Toxicology. 1999, 135, 77-85. [ Links ]
35. Shalan, M.G.; Mostafa, M.S.; Hassouna, M.M.; El-Nabi, S.E.H.; El-Refaie, A. Toxicology 2005, 206, 1-15. [ Links ]
36. Hamed, E.A.; Meki, R.M.A.; El-Mottaleb, N.A.A. J. Physiol. Biochem. 2010, 66, 143-151. [ Links ]
37. Gurer, H.; Neal, R.; Yang, P; Oztezcan, S.; Ercal, N. Hum. Exp. Toxicol. 1999, 18, 27-32. [ Links ]
38. Bannon, D.I., Olivi, L., Bressler, J. Toxicology. 2000, 147, 101-107. [ Links ]
39. Kilty, C.; Doyle, S.; Hassettm, B.; Manning, F. Chem-Biol. Interact. 1998, 111-112, 123-135. [ Links ]
40. Daggett, D.A.; Oberley, T.D.; Nelson, S.A.; Wright, L.S.; Kornguth, S.E.; Siegel, FL. Toxicology 1998, 128, 191-206. [ Links ]
41. Bergdahl, I.A.; Vahter, M.; Counter, S.A.; Schütz, A.; Buchanan, L.H.; Ortega, F.; Laurell, G.; Skerfving, S. Environ. Res. 1999, 80, 25-33. [ Links ]
42. Manton, W.I.; Cook, J.D. Br. J. Ind. Med. 1984, 41, 313-319. [ Links ]
43. Schütz, A.; Bergdahl, I.A.; Ekholm, A.; Skerfvingm, S. Occup. Environ. Med. 1996, 53, 736-740. [ Links ]
44. Hernandez-Avila, M.; Smith, D.; Meneses, F.; Sanin, L.H.; Hu, H. Environ. Health. Perspect. 1998, 106, 473-477. [ Links ]
45. O'Flaherty, E.J. Toxicol. Appl. Pharmacol. 1993, 118, 16-29. [ Links ]
46. Marcus, A.H. Environ. Res. 1985, 36, 473-489. [ Links ]
47. Manton, W.I.; Rothenberg, S.J.; Manalo, M. Environ. Res. 2001, 86, 263-273. [ Links ]
48. Hayes, J.D.; Pulford, D.J. Crit. Rev. Biochem. Mol. Biol. 1995, 30, 445-600. [ Links ]
49. Sharma, A.; Patrick, B.; Li, J.; Sharma, R.; Jeyabal, P.V.S.; Reddy, P.; Awasthi, S.; Awasthi, Y.C. Arch. Biochem. Biophys. 2006, 452, 165-173. [ Links ]
50. Board, P.G.; Menon, D. BBA-Gen. Subjects. 2013, 1830, 3267-3288. [ Links ]
51. Gonick, H.C. J. Toxicol. 2011, 1-10. doi:10.1155/2011/686050. [ Links ]
52. Raghavan, S.R.V.; Gonick, H.C. Proc. Soc. Exp. Biol. Med. 1977, 55, 164-167. [ Links ]
53. Raghavan, S.R.V.; Culver, B.D.; Gonick, H.C. Environ. Res. 1980, 22, 264-270. [ Links ]
54. NOM-199-SSA1-2000. Salud ambiental. Niveles de plomo en sangre y acciones como criterios para proteger la salud de la población expuesta no ocupacionalmente. Available from: http://www.salud.gob.mx/unidades/cdi/nom/199ssa10.html, cited 2013 Dec 15th. [ Links ]
55. US EPA. Method 200.9. Trace elements in water, solids, and biosolids by stabilized temperature, graphite furnace atomic absorption spectrometry, EPA-821-R-01-011. Available from: http://water.epa.gov/scitech/methods/cwa/bioindicators/upload/2008_11_25_methods_method_biological_200_9-bio.pdf, cited 2013 Dec 15th. [ Links ]

