


Serviços Personalizados
Journal
Artigo
 Inglês (pdf)
 Artigo em XML
 Referências do artigo
 Enviar este artigo por email
Indicadores
-
 Citado por SciELO
 -
 Acessos
Links relacionados
-
 Similares em
SciELO
Similares em
SciELO
Compartilhar

 Permalink
Journal of the Mexican Chemical Society
versão impressa ISSN 1870-249X
J. Mex. Chem. Soc vol.58 no.4 Ciudad de México Out./Dez. 2014
Article
Use of Mass Spectrometry for Identification and Quantitation of Tensoactive Agents in Synthetic Latex Samples
Cristina Fonseca-Corona,1,3 Luz Elena Vera-Avila,1 and José-Luis Gallegos-Pérez*,2
1 Facultad de Química, Departamento de Química Analítica, Universidad Nacional Autónoma de México. Coyoacán 04510, México, D.F.
2 Mass Spectrometry Laboratory, Proteomics Facility, Instituto Nacional de Medicina Genómica. Mexico City.
3 Centro de Investigación en Polímeros, Tepexpan, Edo. de México.
* Current address: ABSciex, Demo Lab., Framingham, MA. USA. gallego7@gmail.com
Received May 9th, 2014
Accepted July 21st, 2014.
Abstract
Separation, characterization and quantification of surfactants in different matrices is important due to the continuously increasing use of these products in industry and the adverse effects of their degradation products in the environment. However, surfactant separation and identification is a real challenge because of the wide chemical diversity of this type of compounds. In this report, HPLC-UV or HPLC-Evaporative light scattering detector combined with electrospray ionization (infusion)-high resolution mass spectrometry (ESI-HRMS) was used for the study of main compo-nents in four commercial surfactants. In a second stage, size-exclusion chromatography and off-line ESI-MS were combined for quantification of surfactants in a synthetic latex sample by standard-additions method. This strategy allowed unambiguous determination of the structure of tensoactive agents in commercial products, and further use of obtained data for the selective determination of surfactants in the complex polymeric matrix of an industrial latex.
Keywords: High Resolution Mass Spectrometry, Surfactants, Synthetic Latex, Orbitrap.
Resumen
La separación, caracterización y cuantificación de surfactantes en diferentes matrices es importante debido al continuo incremento en el uso de estos productos en la industria y los efectos adversos de sus subproductos de degradación en el medio ambiente. Sin embargo, la identificación y determinación de surfactantes es un verdadero reto por la gran diversidad química de este tipo de compuestos. En este trabajo se utilizó una combinación de CLAR-UV o CLAR-Detector de dispersión de luz y espectrometría de masas de alta resolución con ionización por electrospray (ESI-HRMS) en modo infusión, para el estudio de los componentes principales en 4 surfactantes comerciales. En una segunda etapa, combinando cromatografía de exclusión y ESI-MS fuera de línea, se cuantificaron los surfactantes en un látex sintético por el método de adiciones patrón. Esta estrategia permitió determinar sin ambigüedad la estructura de los agentes tensoactivos en los productos comerciales y utilizar los datos obtenidos para la determinación selectiva de surfactantes en la compleja matriz polimérica de un látex industrial.
Palabras clave: Espectrometría de Masas de Alta Resolución, Surfactantes, Látex Sintético, Orbitrap.
Introduction
Surfactants are widely used in manufacture of housecleaning products, pesticides, medicine and plastics, as well as in leather, textile, petrochemical and metallurgic industries [1-5]. Separation, characterization and quantification of commercial surfactants in different matrices is important due to the continuously increasing use of these products in industry and their adverse effects in the environment. Surfactants themselves are in most cases of little toxicity, but their breakdown products can sometimes be extremely harmful for living organisms, and especially for aquatic life; this is the case of alkylphenol ethoxylates, whose degradation products, nonylphenol and octylphenol, are known to exhibit estrogen-like properties and carcinogenic effects [6-8]. However, surfactant separation and identification is a challenge because of their wide chemical diversity. Although several analytical methodologies have been developed to identify and quantify surfactants mainly in environmental waters and wastewater [9-20], reports are scarce for analysis in other complex matrices, such as plating baths, synthetic rubbers, and other industrial formulations. Total surfactant concentration has been determined by means of potentiometric, spectrophotometric, gravimetric and volumetric approaches [4, 5]. These methods show high detection limits and can be affected by matrix interferences. Other analytical techniques, such as Nuclear Magnetic Resonance and Infrared Spectroscopy have limited application for surfactant determination due to matrix effects and sensitivity issues. Surfactants can be also separated and their components analyzed independently. Surfactant separation by analytical techniques such as precipitation and thin layer chromatography is only used for substance-class identification. Separation and quantitation by gas chromatography (GC) coupled to mass spectrometry (MS), although highly specific and sensitive, often requires intensive sample pretreatment and chemical derivatization [4, 16, 17, 21]. High performance liquid chromatography (HPLC) is the technique of choice for the separation of surfactant components [12, 17]. HPLC-fractions can be analyzed either on- or off-line by mass spectrometry. MS detection provides high selectivity and structural information by means of MS/MS experiments. Mixtures of oligomers have been characterized by Matrix Assisted-Laser Desorption Ionization (MALDI) coupled to Time of Flight (TOF) m/z analyzers [22, 23] and by electrospray ionization (ESI) coupled to HPLC [3, 18-20, 22-26]; however, few reports show the use of MS for quantitative determinations in complex surfactant mixtures [27, 28]. Even though there are reports of surfactant analyses using MS for a variety of environmental samples, we did not find one for the determination of these products in polymeric matrices such as synthetic latexes.
Synthetic latexes are used in the coating industry for the formulation of waterproof varnishes, adhesives, printing paste resins, interior and exterior wall emulsion paints, and many other products. These latexes are obtained by emulsion polymerization of suitable monomers with addition of tensoactive agents to the reaction mixture. Commonly an ionic and a non-ionic surfactant are used in the synthesis. The total amount of surfactants in the latex, their nature and molecular mass distribution may have an important impact on the properties of the final product (adherence, luminosity, water resistance, etc.).
Here, we report the development of an analytical methodology for characterization of ionic and non-ionic ethoxylated surfactants in commercial formulations, and their quantification in a latex sample. Main constituents of the commercial surfactants were isolated by means of HPLC-evaporative light scattering detector (ELSD) or HPLC-UV, and characterized using high-resolution mass spectra (HRMS) acquired with an LTQ-Orbitrap mass spectrometer. For each surfactant, the most abundant oligomer detected in the mass spectra was used as indicator of its presence in the latex sample. After surfactants were isolated from the polymeric matrix of latex using Size Exclusion Chromatography (SEC), the whole fraction was injected into the mass spectrometer for subsequent quantification by direct injection (infusion)-MS.
Results and discussion
Identification and characterization of main components in commercial surfactants
Four commercial surfactants, labeled M1, M2, M3 and M4, were studied for characterization of their main tensoactive components. The nominal composition of each product according to supplier data is given in Table 1.
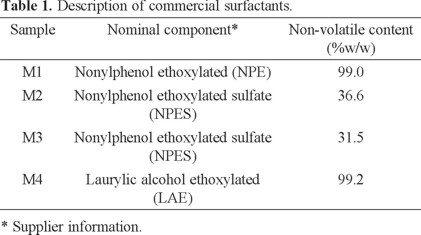
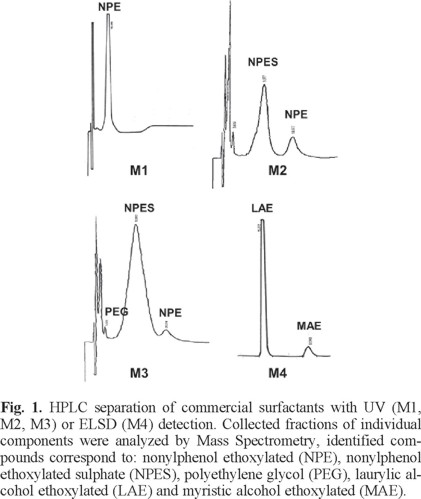
Figure 1 shows the chromatograms obtained from HPLC separation of the surfactant samples. Under optimized conditions (described in experimental section), major peaks were well resolved and could be easily collected in individual fractions for MS characterization. Alkyl phenol ethoxylates, whether ionic or non-ionic, have a good chromophore group; thus, samples M1, M2 and M3, where this type of surfactants was expected, were detected by UV. Ethoxylated alkyl alcohols, expected in sample M4, have poor spectroscopic properties; therefore, the universal ELSD was used for detection of this sample. Although the sensitivity of this detector is significantly lower than that of spectroscopic detectors, this was not a problem as injected sample solutions for fraction collection were quite concentrated (2 mg/mL).
Collected fractions were analyzed by direct introduction into an ESI-LTQ-Orbitrap mass spectrometer. Identification of surfactant components was achieved by data analysis of the high resolution mass spectra. Main series presented in the spectra m/z value differences between adjacent peaks lower than 10 ppm for the oligomer unit (OCH2CH2, 44.0262 Da) in all cases. It has been explained and demonstrated elsewhere [29, 30] that in some cases a mass accuracy even lower than 1 ppm is not enough to identify a chemical compound, however, if some information on the potential formulas is available in advance, deduction of compound identities from HRMS is straightforward. Theoretical values for the expected polymers were, thus, compared with experimental data and the polymer composition in the four analyzed samples was unambiguously determined (Table 2).
Next, a summary of components found in the studied surfactant samples.
M1: Only one fraction was separated by HPLC. MS analysis confirmed the presence of nonylphenol ethoxylated (NPE) as the major component in this sample. Quaternary ammonium adducts [M+NH4]+ were observed in the main ion series of the spectrum.
M2: Two fractions were separated by HPLC and injected into the MS-system. According to results, nonylphenol ethoxylated sulfate (NPES) and nonylphenol ethoxylated (NPE) were identified as the major components. For NPES, the positive mode mass spectra showed the neutral loss of SO3 with formation of the ammonium adduct. In the negative mass spectra, ions of the deprotonated molecules were observed leading to an easy identification of the mass distribution. In the case of NPE the [M+Na]+ adducts were observed.
M3: In this surfactant three fractions were collected and identified, polyethylene glycol (PEG, fraction 1), NPES (fraction 2) and NPE (fraction 3). PEG fraction corresponds to the small peak eluting just after injection perturbations in the chromatogram (see Figure 1); it is probably a residue of incomplete reaction during the synthesis of the surfactant or comes from hydrolysis of some ethoxylated chains in major products. The main chromatographic peak was fraction 2, identified as NPES oligomers that presented a larger number of structural units (n) than the NPES oligomers in sample M2. Interestingly, NPES showed the neutral loss of SO3 as it was observed in sample M2, however, molecules were doubly quaternary ammonium-charged in positive ESI. It seems that experimental conditions and longer polymer chains promote the double charge of the polymer in a reproducible way, as it has been reported for other polymer types elsewhere [31]. As shown in Figure 2, no other component was found in these spectra. PEG and NPE showed quaternary ammonium and potassium adducts for their main ion series, respectively.
M4:Two fractions were separated by HPLC. Mass spectra interpretation showed that the main compound in this sample was laurylic alcohol ethoxylated (LAE) and the minor fraction corresponded to myristic alcohol ethoxylated (MAE). In both cases the [M+NH4]+ adducts were observed as the most intense ion series (Figure 3).
Analysis of commercial surfactants M3 and M4 in a synthetic latex sample
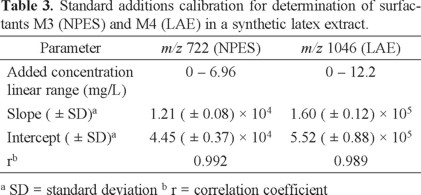
An industrial latex sample was analyzed for quantitative determination of surfactants M3 and M4, used in the synthesis of this product. A standard additions based method was developed for surfactant determination. After preparation of spiked and non-spiked sample solutions (see experimental section), size exclusion chromatography (SEC) with refractive index detector was used to separate target analytes from the latex matrix (chromatogram not shown). SEC separation gave two well resolved peaks eluting at retention times of 20 min (baseline width 18-23 min) and 25 min (baseline width 23.5-27 min). First peak corresponded to the high molecular weight copolymer matrix and the second one to the mixture of surfactants. The collected surfactant fraction was further evaporated, reconstituted in appropriate solvent and directly injected into the ESI-LTQ-Orbitrap system for analysis. According to the previous characterization of commercial surfactants, measurements for analysis of the latex extract solution were based on the main component detected by HPLC for each surfactant and its most intense ion in the positive mass spectra. Thus, quantitation was carried out using Selected Ion Monitoring (SIM) at the m/z average values of 722 for NPES in surfactant M3 and 1046 for LAE in surfactant M4. Former ion corresponds to the double charged adduct of NPES oligomer with n = 27 (see Table 2 and Figure 2); the second m/z value corresponds to the monocharged sodium adduct of LAE oligomer with n = 19.
Table 3 shows the parameters obtained from linear regression analysis of experimental data (Peak Area vs. Added Surfactant Concentration) for M3 and M4 in the latex extract. Assuming no analyte losses during sample preparation, the concentration range of added surfactants in the final extract solution was 0-6.96 and 0-12.2 mg/L for M3 and M4, respectively. Sample solutions with higher concentration of added surfactant were also assayed (corresponding to 9.27 mg/L for M3, and 16.2 mg/L for M4 in the final extract), however, obtained peak areas were significantly out of the linear range of calibration curves, so these data were not considered in regression analysis.
Surfactant concentration in the latex sample was determined using the interpolation method for standard additions proposed by Andrade et al. [32]. This concentration, reported in Table 4, corresponds to the latex extract solution that was analyzed by MS. Surfactant content in the original latex (w/w %) was back calculated considering the injected volume in SEC (50 µL), the concentration of dried latex in the injected solution (9.06 mg/mL) and the non-volatile content of latex (54.0%). Results for latex are also reported in Table 4. As observed, effective surfactant content in the latex was < 2% (w/w) for M3 and M4, in accordance with manufacturer specifications.
The proposed strategy for quantification of surfactants in synthetic latexes is based on the fact that industrial reagents (commercial surfactants) used as emulsifiers in the polymerization reaction for production of a particular latex batch, are known in advance (nominal composition), are well identified (furnisher, lot number, etc.) and are available at place. Therefore, the same reagents can be used for calibration in the standard addition method, if their total surfactant content (non-volatile content) is known or previously determined. This ensures that quality control of the finished product (the latex batch) is made using "calibration standards" of same composition and molecular mass distribution as the target analytes, which is crucial for selective and reliable surfactant determination by ESI-MS/SIM. In the developed method, standard additions to latex samples are made at the first stage of sample preparation, thus, eventual analyte losses due to incomplete recovery during the following steps of the procedure are compensated by proportional losses of added surfactants, if recoveries are independent of concentration. Constant recovery (%R) can safely be assumed in the linear range of the calibration curve. So, standard addition method, coupled to MS analysis, is the most appropriate option for determination of surfactant mixtures in synthetic polymeric matrices.
The surfactant content in synthetic latexes is in the low percent level (commonly more than 1%, w/w); therefore, very high sensitivity is not a requirement for the analytical method. Indeed, detection and quantification limits of the proposed method for determination of surfactants in synthetic latexes cannot be evaluated because the sample contains those surfactants at much higher level. On the contrary, care must be exerted when choosing standard addition concentrations because the response of ESI-MS/SIM as function of surfactant concentration has a limited linear range. According to our experimental results, in the case of a mixture of M3 and M4, linearity is no longer ensured for total concentrations in the analyzed solution higher than ~13 mg/L and ~19 mg/L, respectively. Here, total concentration accounts for the standard addition plus the surfactant concentration coming from the sample itself.
In this work, an LTQ-Orbitrap MS system was used for complete characterization of commercial surfactants, whose spectra are quite complex and require high resolution data to ensure unambiguous identification of the different species. However, a full characterization of commercial surfactants is not necessary for application of the proposed methodology to the routine determination of surfactants in industrial latexes; for the latter, it is sufficient to identify the most abundant oligomer-adduct ion in the main series of the spectra obtained for the principal component of each surfactant. The average m/z value of this ion is then used to confirm the presence of a surfactant in the latex sample and the ion current produced by this species is measured for quantification by ESI-MS/ SIM. Therefore, the analytical method can easily be adapted for quality control of synthetic latexes using other mass spectrometers that are more commonplace in industry.
Conclusions
An analytical method for identification and selective determination of surfactant mixtures in industrial latexes was developed based on the high-resolution capability of an LTQ-Orbitrap system combined with chromatographic techniques. Commercial formulations of tensoactive agents, commonly used in industry as emulsifiers in the synthesis of latexes, are first characterized for identification of their surfactant components and molecular mass distributions using HPLC-UV or HPLC-Evaporative light scattering detection and ESI (infusion)-high resolution mass spectrometry. Then the latex sample is analyzed applying the standard addition method for quantification of surfactants in the complex polymeric suspension. HPLC-SEC is used to separate high molecular mass constituents of latex from surfactants, with further MS/SIM determination of identity and quantity of each commercial surfactant, based on the most abundant oligomer of their main component. Our results suggest that: 1) the proposed methodology is a reliable option for quality control of raw material (commercial surfactants) and finished product (latex) in industry, 2) this method is relatively simple; separation of analytes from the polymeric matrix is straightforward without the need of tedious and extensive labor procedures, 3) the same methodology may be applied for determination of different commercial surfactant mixtures (whether ionic or non-ionic) in industrial latexes, only requirement is complete solubility of the polymeric matrix (dried resin) in a solvent or solvent mixture that can be easily evaporated after SEC fractionation.
Materials and methods
Chemicals. HPLC-grade methanol, tetrahydrofuran (THF) and acetonitrile (J. T. Baker, Mexico), and type 1 reagent water obtained from a Nanopure deionizer (Barnstead Thermolyne, model 04747), were used for extraction, solution preparation and chromatographic separations. Ammonium acetate analytical grade (Fluka, France) was used as ion pairing agent for chromatographic separation of ionic surfactants. Acetic acid analytical grade (J.T. Baker, Mexico) was used as additive for ESI.
Samples. The four commercial surfactants (labeled M1, M2, M3, M4) and the synthetic latex sample studied in this work were kindly provided by Centro de Investigación en Polímeros S.A. de C.V. Individual solutions of the four surfactants were prepared in methanol-water 1:1 (v/v) at concentration of 2 mg/mL for HPLC separation. Surfactant concentration in all sample solutions is always referred to the non-volatile content of each product (effective concentration).
The synthetic latex mainly consisted of a styrene-acrylic polymer with a molecular weight of ~250,000 Da. The total non-volatile content of the latex was 54.0% (w/w). According to manufacturer specifications, the effective surfactant content of M3 and M4 in the latex should be lower than 2% (w/w) each.
Instrumentation. The HPLC equipment consisted of two Gilson pumps (model 305 and 306), a manometric module (Gilson 805), a Rheodyne 7125i injection valve with a 20 µL loop, a Shimadzu UV detector (model SPD-10AVVP), an evaporative light scattering detector (Polymer Laboratories PL-ELSD 1000) and a Hewlett-Packard integrator (model 3396 Series II). The SEC equipment was a modular chromatographic system from Waters, consisting of an autosampler 717, an isocratic pump 510, a column oven 010731, a refractive index detector (RI) 410, and an automatic fraction collector II. Equipment control and data acquisition was effected by Millenium 3.1 software (Waters, USA).
The mass spectrometer was a hybrid system consisting of a linear ion trap coupled to an Orbitrap analyzer (LTQ-Orbitrap from Thermo, USA); it was used with an ESI ion source. In ESI mode, samples can be injected chromatographically or by direct injection (infusion); ionization takes place using nano-, micro- or regular- ESI sources. Control and data acquisition were carried out by Xcalibur 2.0 software (Thermo, USA).
Characterization of commercial surfactants
HPLC and MS parameters. Component separation in commercial surfactants was performed with a 5 µm Hypersil ODS column (150 x 4.6 mm I.D., Thermo Scientific). A methanol-water 80:20 (v/v) mobile phase was used for the separation of non-ionic surfactants (M1 and M4); the same mixture was used for ionic surfactants (M2 and M3) but ammonium acetate (0.1 M) was added to provide a suitable counterion (NH4+) for optimal retention. To facilitate fraction collection, a flow rate of 0.7 mL/min was used for the separation of samples M2 and M3, which showed lower resolution of chromatographic peaks. Samples of M1 and M4 presented very well-defined peaks in chromatograms and were separated at 1 mL/min. UV detection at 235 nm was used in the separation of samples M1, M2 and M3. In the case of M4, the ELSD was used; operating conditions were: nitrogen flux of 0.5 L/ min, nebulization and evaporation temperatures of 40 °C and 70 °C, respectively. Collected fractions were analyzed by infusion into ESI-LTQ-Orbitrap using a micro-spray system operated at 2 µL/min; other conditions were: spray voltage 1.95 kV, capillary voltage 49 V, capillary temperature 200 ºC, cone voltage 160 V. Fractions corresponding to ionic surfactants (M2 and M3) were detected both in positive and negative mode, whereas fractions corresponding to non-ionic surfactants (M1 and M4) were only detected in positive mode. Scanned mass range was m/z 100-2000. Spectra were collected both in low and high resolution. In order to improve signal intensity, collected fractions of M2 and M3 were evaporated and redissolved in acetonitrile-water 1:1 (v/v), containing 1 mM acetic acid prior to MS analysis.
Mass Spectra Data Analysis. Separation and identification of the commercial surfactants components was carried out off-line because several experimental conditions were tested to obtain an adequate retention and separation of M2 and M3 using, in some cases, non-compatible additives with the ESI ion source. Collected fractions from the HPLC separation were injected by direct infusion into ESI-LTQ-Orbitrap system and high-resolution mass spectra were acquired. LTQ-Orbitrap is capable to work below 5 ppm in the m/z working mass range [33,34]. Thus, based on experimental data, chemical formulas were computed within an accuracy of 5 ppm using the molecular weight calculator software [35]. Formula calculation took into account formation of possible hydrogen, sodium, potassium and ammonia adducts. Formulas were analyzed based on the knowledge, in advance, of the possible main components in commercial surfactants.
Determination of surfactants in synthetic latex
SEC separation. Aliquots of the latex sample were dried and reconstituted in THF for surfactant extraction. Solutions were injected in SEC (injection volume 50 µL) to separate analytes from the copolymer matrix; a column set consisting of 3 KF-801 columns and one KF-802 column (Shodex) was used. Other separation conditions were: carrier solvent THF, flow rate 1 mL/min, oven and RI detector temperatures 38 °C and 35 °C, respectively. Collected surfactant fractions (3.5 mL) were evaporated to dryness under a gentle N2 steam for complete THF removal. Dried fractions were reconstituted in 3 mL of acetonitrile-water 1:1 (v/v), containing 10 mM acetic acid.
Surfactant quantitation in latex. Quantitation of surfactants in the latex sample was performed by the standard addition method. A stock solution of surfactants M3 and M4 at effective concentration (based on the non-volatile content of commercial products; Table 1) of 1.39 and 2.44 mg/mL, respectively, was prepared in THF. Prior to SEC separation, carefully weighted amounts of dried latex were dissolved in THF (9.06 mg/mL) and spiked with the stock surfactant solution. Added concentrations in the resin solution were in the range 0-0.417 and 0-0.731 mg/mL for M3 and M4, respectively. After SEC separation, drying and reconstitution of collected fractions (described above), independent duplicate analyses of non-spiked and spiked sample solutions were conducted by direct introduction into ESI-LTQ-Orbitrap, operated under the previously described conditions. Total Ion Current (TIC) plots were acquired for the m/z values of 722 (NPES, [M - SO3 + 2NH4]2+) and 1043 (LAE, [M+Na]+]), and peaks were integrated. Calibration curves for M3 and M4 were constructed by plotting peak areas as function of added surfactant concentration in the analyzed solution.
Acknowledgements
C.F.C. acknowledges Fondo Sectorial para la Educación, CONACyT for graduate student fellowship and financial support (project 46558). Authors wish to thank Instituto Nacional de Medicina Genómica (INMEGEN) and Centro de Investigación en Polímeros, S.A. de C.V. for facilitating the use of MS equipment and providing the samples for this study. We also thank M. Sc. María del Rosario Covarrubias-Herrera, for her valuable technical assistance.
References
1. Jönsson, B.; Lindman, B.; Holmberg, K.; Kronberg, B. Surfactants and Polymers in Aqueous Solution. John Wiley, Chichester, 1998. [ Links ]
2. Kirk, R. E.; Othmer, D. F.; Kroschwitz, J. I.; Howe-Grant, M. Encyclopedia of Chemical Technology., Vol. 23, 4th ed., Wiley, N.Y., 1997. [ Links ]
3. Lunar, L.; Rubio, S.; Pérez-Bendito, D. J. Chromatogr. A 2004, 1031, 17-25. [ Links ]
4. Schmitt, T. M. Analysis of Surfactants, 2nd ed., Marcel Dekker, N.Y., 2001. [ Links ]
5. Ullmann, F. Ullmann's Encyclopedia of Industrial Chemistry, 6th ed., Wiley-VCH, Weinheim, 2003. [ Links ]
6. Cserháti, T.; Forgács, E.; Oros, G. Environ. Int. 2002, 28, 337-348. [ Links ]
7. Ying, G.-G. Environ. Int. 2006, 32, 417-431. [ Links ]
8. Scott, M. J.; Jones, M. N. Biochim. Biophys. Acta 2000, 1508, 235-251. [ Links ]
9. Bear, G. R. J. Chromatogr. 1988, 459, 91-107. [ Links ]
10. Wang, Z.; Fingas, M. J. Chromatogr. 1993, 637, 145-156. [ Links ]
11. Kosá, A.; Dobó, A.; Vékey, K.; Forgács, E. J. Chromatogr. A 1998, 819, 297-302. [ Links ]
12. Liu, X.; Pohl, C. A.; Weiss, J. J. Chromatogr. A 2006, 1118, 29-34. [ Links ]
13. Márquez, N.; Antón, R. E.; Usubillaga, A.; Salager, J. L. J. Liq. Chromatogr. 1994, 17, 1147-1169. [ Links ]
14. Park, H. S.; Ryu, H. R.; Rhee, C. K. Talanta 2006, 70, 481484. [ Links ]
15. Houde, F.; DeBlois, C.; Berryman, D. J. Chromatogr. A 2002, 961, 245-256. [ Links ]
16. Trehy, M. L.; Gledhill, W. E.; Orth, R. G. Anal. Chem. 1990, 62, 2581-2586. [ Links ]
17. Di Corcia, A. J. Chromatogr. A 1998, 794, 165-185. [ Links ]
18. López de Alda, M. J.; Díaz-Cruz, S.; Petrovic, M.; Barceló, D. J. Chromatogr. A 2003, 1000, 503-526. [ Links ]
19. Lunar, L.; Rubio, S.; Pérez-Bendito, D. Environ. Technol. 2004, 25, 173-184. [ Links ]
20. Petrovic, M.; Barceló, D. Anal. Bioanal. Chem. 2006, 385, 422-424. [ Links ]
21. Field, J. A.; Miller, D. J.; Field, T. M.; Hawthorne, S. B.; Giger, W. Anal. Chem. 1992, 64, 3161-3167. [ Links ]
22. López-Luna, A.; Gallegos, J. L.; Gimeno, M.; Vivaldo-Lima, E.; Bárzana, E. J. Mol. Catal. B: Enzym. 2010, 67, 143-149. [ Links ]
23. Schnöll-Bitai, I.; Ullmer, R.; Hrebicek, T.; Rizzi, A.; Lacik, I. Rapid Commun. Mass Spectrom. 2008, 22, 2961-2970. [ Links ]
24. Altuntas, E.; Krieg, A.; Baumgaertel, A.; Crecelius, A. C.; Schubert, U. S. J. Polym. Sci., Part A: Polym. Chem. 2013, 51, 1595-1605. [ Links ]
25. Bernhard, M.; Eubeler, J. P.; Zok, S.; Knepper, T. P. Water Res. 2008, 42, 4791-4801. [ Links ]
26. Hercules, D. M. Anal. Bioanal. Chem. 2008, 392, 571-573. [ Links ]
27. Ulaszewska, M. M.; Hernando, M. D.; Moreno, A. U.; Valverde García, A.; García Calvo, E.; Fernández-Alba, A. R. Rapid Commun. Mass Spectrom. 2012, 27, 747-762. [ Links ]
28. Walterová, Z.; Horský, J. Anal. Chim. Acta 2011, 693, 82-88. [ Links ]
29. Draper, J.; Enot, D. P.; Parker, D.; Beckmann, M.; Snowdon, S.; Lin, W.; Zubair, H. BMC Bioinf. 2009, 10, 227. [ Links ]
30. Kind, T.; Scholz, M.; Fiehn, O. PLoS One 2009, 4, e5440. [ Links ]
31. Brooks, J. East Carolina University (Greenville, NC), 2010. [ Links ]
32. Andrade, J. M.; Terán-Baamonde, J.; Soto-Ferreiro, R.M.; Carlosena, A. Anal. Chim. Acta 2013, 780, 13-19. [ Links ]
33. Makarov, A.; Denisov, E.; Lange, O.; Horning, S. J. Am. Soc. Mass Spectrom. 2006, 17, 977-982. [ Links ]
34. Watson, J. T.; Sparkman, O. D. Introduction to Mass Spectrometry: Instrumentation, Applications, and Strategies for Data Interpretation, 4th ed., John Wiley & Sons, Chichester, England; Hoboken, N.J., 2007. [ Links ]
35. Monroe, M. Molecular Weight Calculator Software, 6.19 ed., 2002. [ Links ]

