


Servicios Personalizados
Revista
Articulo
 Inglés (pdf)
 Artículo en XML
 Referencias del artículo
 Enviar artículo por email
Indicadores
-
 Citado por SciELO
 -
 Accesos
Links relacionados
-
 Similares en
SciELO
Similares en
SciELO
Compartir

 Permalink
Journal of the Mexican Chemical Society
versión impresa ISSN 1870-249X
J. Mex. Chem. Soc vol.58 no.2 Ciudad de México abr./jun. 2014
Article
Determination of Nitrites in Commercial Sausages by Anthocyanins Degradation. Experimental Design and Optimization
Carlos Andrés Galán-Vidal,1 Araceli Castañeda-Ovando,1* Ma. Elena Páez-Hernández,1 and Elizabeth Contreras-López1
Universidad Autónoma del Estado de Hidalgo, Área Académica de Química, Ciudad Universitaria, Carretera Pachuca-Tulancingo km 4.5, 42184 Mineral de la Reforma, México. ovandoa@uaeh.edu.mx
Received December 13th, 2013
Accepted February 28th, 2014
Abstract
With the purpose of obtaining the main factors in the nitrite quantification by bleaching Roselle anthocyanins, an experimental design (23) was carried out. The control factors were ultrasound, time and temperature at two levels (-, +). Results for sausages analysis were obtained by the colorimetric method of AOAC 973.31, and the proposed spectrophotometric method. Statistical analysis show that results do not differ significantly. A better linear calibration range is obtained using this new method. The main advantage is the reagents that are used are cheaper.
Key words: Nitrite, anthocyanins, Roselle, spectrophotometric method, sausage.
Resumen
Se realizó un diseño experimental (23) con la finalidad de obtener los principales factores en la cuantificación de nitrito por degradación de antocianinas de la flor de jamaica. Los factores de control fueron ultrasonido, tiempo y temperatura a dos niveles (-, +). Los resultados para el análisis de embutidos fueron obtenidos por el método colorimétrico de AOAC 973.31 y el método espectrofotométrico propuesto. El análisis estadístico muestra que los resultados no difieren significativamente. Utilizando el nuevo método se obtiene un mejor intervalo de calibración lineal. La principal ventaja es que los reactivos que se utilizan son más baratos.
Palabras clave: Nitrito, antocianinas, flor de jamaica, método espectrofotométrico, embutido.
Introduction
The Roselle extract (Hibiscus sabdariffa L.) with brilliant red color and unique flavor is used widely in Taiwan to make jellies, jams and beverages. The abundant natural red pigment in Roselle is due to anthocyanins, which are also the main source of its antioxidant capacity [1, 2]. However, the pigment is quite unstable during both processing and storage. Light, pH, temperature, oxygen, ascorbic acid and sugar are considered to be important factors influencing its degradation or stability [3].
Several papers have described reactions between anthocyanins and oxidants, reductors, nucleophiles (as nitrite ion) and electrophiles species [4]. Some condensation reactions might lead to anthocyanin discoloration. Certain amino acids, catechins, or other nucleophiles, when condensed in the presence of flavylium salts, will yield colorless products which are reactive and undergo further changes [5, 6].
One of the most important bleaching anthocyanin reactions is carried out between monomeric anthocyanins with bisulfite at the pH of most foods and beverages to form a colorless sulfonic acid adduct. Some researchers have established that the position of the sulfonate adduct was the C-4 position [7].
Fichtner and co-workers [8] have studied the kinetics of the reactions of the flavylium ion with π-nucleophiles (different from nitrite ion) and have described that the nucleophilic reactions happen more quickly in the C-4 position than in the C-2 position. Due to these results, the authors have concluded that the substitution happens mainly in the C-4 position.
On the other hand, official methods for the determination of nitrite in meat products (NOM-213-SSA1-2002 [9] and AOAC 973.31 [10]) are based on the Griess reaction. The fundament of these methodologies reaction is the reaction between nitrite ion sulfanilamide in acidic medium. After, diazo compound synthetized reacts with N-(1-Naphthyl)-ethylenediamine dihydrochloride (NED). This part of the process generates an azoic deep red compound [11]. The final products of the Griess reaction are waste azocompounds that have a high toxicity grade [12].
Therefore, the aim of this study was to develop a spectrophotometric method to determine nitrites in cured meat by the degradation of anthocyanins and to compare the difference between the proposed method and the Griess method [10].
Results and discussion
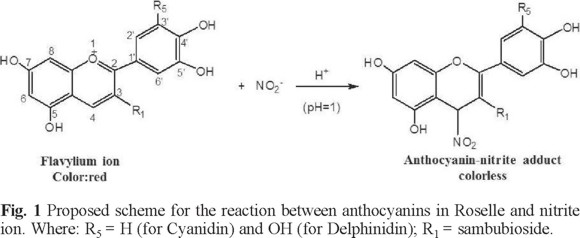
The total monomeric anthocyanins content in the Hibiscus sabdariffa extract was 356.82 mg L-1, according to the spectroscopic data of Cyanidin-3-glucoside [13]. Fig. 1 shows a proposed reaction scheme according to these results and considering that the anthocyanin: nitrite ion ratio is equimolar, in agreement with the reaction of anthocyanins with others nucleophiles. It is also taken into consideration that the main anthocyanins in the Hibiscus sabdariffa extracts are Cyanidin-3-sambubioside and Delphinidin-3-sambubioside, which have been identified as the main anthocyanins in Roselle flowers [14]. They would be the compounds to react with nitrites in the bleaching reaction.
Design results
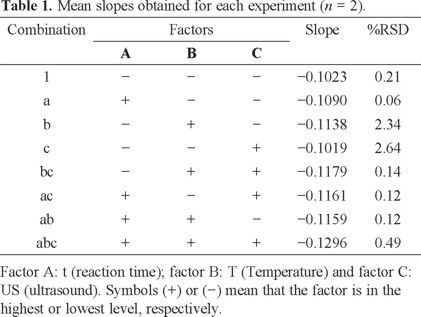
The pH factor was set at 1 because under these conditions, flavylium ion is the predominant anthocyanin specie which allows the nucleophilic attacks [15, 16]. Flavylium ion presents an absorption band in UV-vis region (λmax = 515 nm) [13] facilitating the nitrite determination by bleaching reaction. Design results were shown in Table 1, where are considered the slope as the response.
In addition, the effects for each factor (individual effect) and the different interactions (interaction effect) in the response were calculated.
To test whether each of the effects are significant (H0: the factor does not affect the response), each mean square was compared with the residual mean square (MSres), Fcalculated. This value was obtained from a two-way ANOVA test of the individual measures having a value of 1.17 × 10⁻⁵ (P = 0.05). The results are presented in Table 2.
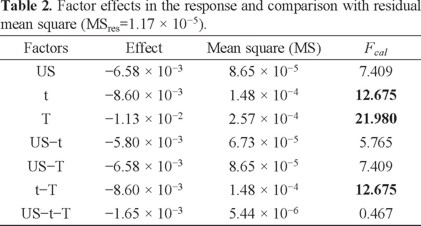
According to the degrees of freedom (DF), Ftheoretical = 8.073 (P = 0.05), which suggests that factors t, T and t-T have significant effects under the slope, because Fcalculated > Ftheoretical. In fact, ultrasound (US) is the only factor that has no significant effect on the responses in addition to the interaction between the three factors is not significant.
Because US factor has no significant effect, the experiments considered to present the best conditions are: 1, a, b and ab, with slopes of -0.1023, -0.1090, -0.1138 and -0.1159. However, according to Table 1, T is the factor with the most significant effect; therefore, the combination b (t = 5 min, T = 60 °C and without US) was chosen for the next experiments. The main advantage is that the analysis is carried out in less time.
Validation procedures
The calibration curves of the proposed method were carried out under the conditions of t=5 min, T = 60 °C and without US, using standard solutions in the concentration range between 0 and 5 mg L-1 of nitrite and performing five replicates of each. Calibration curves of the Griess method were obtained using standard solutions in the concentration range between 0 and 1 mg L-1 of nitrite. Regression parameters are shown in Table 3 for both methods.
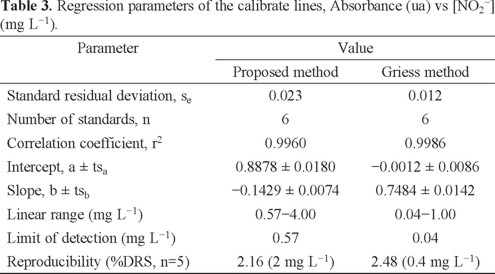
Although the Griess method has lowest limit of detection (LOD) than the proposed method, the second one has the greatest linear range allowing for a wider application, especially to determine nitrites in any kind of sausage.
Nitrite ion concentration was determined in all samples using both methods (Griess and proposed); the mean of the contents are shown in Table 4. A correlation analysis in order to compare these methods was carried out. Where y is the results of the proposed method, and x the results of the reference method. The regression equation was y = 1.1645 x - 0.9136.

Both methods had a good correlation (r2 = 0.9998); despite, the values of regression parameters (slope and intercept) mean that there was a constant systematic error in both, the proposed and the reference method [17]. Additionally, an analysis of variance (ANOVA) was carried out [18] to evaluate the significant differences between them [H0: There was no significant difference between the means of the results obtained with Griess method (x1) and proposed method (x2)].
Fcalculated value (1.36) was compared with Ftheoretical (F1,10 = 6.94, 2-tailed, 95% confidence level). As Fcalculated < Ftheoretical, so H0 was accepted. Results obtained by both methods did not differ significantly [18].
Experimental section
Reagents and plant material
All chemicals were used as received. Hydrochloric acid and NaNO2 were obtained from J. T. Baker (NJ, USA); Hibiscus sabdariffa flowers were purchased from the supermarket. Deionized water (18.2 MΩ cm) from a Milli-Q equipment of Millipore (MA, USA) was used to prepare the solutions.
Solutions
Roselle extract was obtained by mixing 50 g of the flowers (previously dried at room temperature for a week) with approximately 700 mL of deionized water, which set overnight. The mixture was then filtered and the solution was transferred to a volumetric flask and water was added until a final volume of 1 L was reached.
The monomeric anthocyanin content of crude extract was determined by the pH-differential method [11]. Two extract solutions were prepared with pH values 1 and 4.5, and the UV-vis spectra were obtained in a spectral window of 250-750 nm.
The total monomeric anthocyanin content was calculated using the equation (1), which Wrolstad and co-workers [19] obtained through experimentation with different extracts. The absorbance at 700 nm is taken as correction when there are sediments or colloidal material in the sample.

Where:
A = (Aλ vis-max - A700 nm)pH1 - (Aλ vis-max - A700 nm)pH4.5 (2)
MW= molecular weight of the most common anthocyanin (Cyanidin-3-glucoside, MW= 449 g mol-1). DF= Dilution factor. ε = molar absorptivity of the most common anthocyanin (Cyanidin-3-glucoside, ε510 nm = 26 900 cm-1mol-1 L at pH 1.0). ℓ = path length.
Instrumentation
The temperature was controlled with a LAUDA Brinkmann bath circulator (Delran, NJ). The absorbance measurements were carried out in a Lambda 40 spectrophotometer from Perkin-Elmer (MA, USA) at 515 nm for the proposed method and 540 nm for the standard method using quartz cells with 10-mm path length of Perkin Elmer (MA, USA).
Experimental design
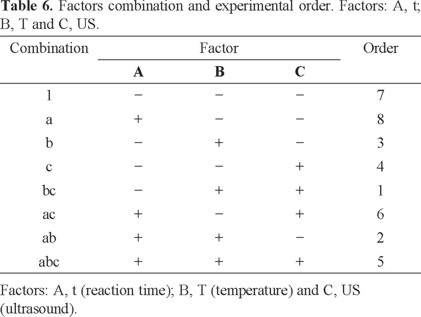
Optimization of nitrite quantification was carried out by a factorial design. A three-factor and three-level design consisting of eight experimental runs was employed including three replicates. In the factorial design the control factors were: 1) reaction time (t), temperature (T) and ultrasound (US). The experimental conditions are shown in Table 5. These control factors were chosen according with previous studies [20].

The slope (sensitivity of the analytical method) was the response to optimize. The experimental runs or combinations were randomized (Table 6).
Analysis of real samples
Six commercial sausages were used as real samples (two pate samples of different brands, cooked ham, and three banger samples of different brands) and were analyzed in 3 replicates. The sample treatment was as follows:
About 30 g (%RSD = 0.66, n = 6) of each sample were weighed out accurately, minced, and transferred into a 250-mL beaker together with 50 mL of water. The mixture was heated to 80 °C for 15 min and transferred to a 200 mL volumetric flask. Enough hot water was added to bring the volume to about 150 mL. The flask was transferred to a stream bath for 2 h and shaken occasionally. The solution was cooled to room temperature, and 10 mL of Al(NH4)(SO4)2 suspension was added. Then the mixture was centrifuged to clear it (17500 rpm, for 25 min). Next, two phases were separated and finally, the aqueous solution volume was completed at 200 mL with deionized water (working solution).
Griess method
A NED solution was prepared by dissolving 0.2 g of N-(1-naphthyl)-ethylenediamine·2HCl in a 150 mL of acetic acid solution (15% v/v). A sulfanilamide solution was prepared by dissolving 0.5 g of the reagent in 150 mL of acetic acid solution (15% v/v).
A stock solution of nitrite (100 mg L-1) for both methods was prepared weekly from NaNO2. For calibration, a set of solutions of increasing NO2- concentration in the range of 0-1 mgL-1 was prepared by successive dilutions of the stock solution, adding 1.25 mL of NED solution and 5 minutes later 1.25 mL of sulfanilamide solution was also added and reaching a volume of 25 mL with deionized water. The absorbance measures were taken 5 minutes after the solution was complete at 540 nm.
To determine the nitrites in real samples 10 mL of the working solution were taken and transferred to a 25 mL volumetric flask. They received the same treatment according to the standards.
Proposed method
A set of solutions of increasing NO2- concentration in the range of 0-5 mgL-1 was prepared by successive dilutions of the stock solution, adding 2.5 mL of HCl 1 mol L-1, 1 mL of Hibiscus sabdariffa extract and completing the volume to 25 mL with deionized water.
The flasks were placed in a thermostated bath at 60 °C for 5 minutes. After, absorbance measurements were taken at 515 nm.
To determine the nitrites in real samples, 25 mL of the working solution were taken and transferred to a 50 mL volumetric flask. They received the same treatment according to the standards.
Conclusions
The statistical analysis of the completed experimental design, shows that the main factors that have an effect in the proposed method were time and temperature, the latter having the greatest effect. The statistical analysis between both methods (Griess and proposed) shows that there were not significant differences at 95% confidence level.
According to the results obtained, this work proposes the use of a cheaper method, because it uses raw natural material (Hibiscus sabdariffa extract) and generates waste that can be considered non-toxic (colorless compound), unlike those obtained in the Griess reaction (azoic compounds with high toxicity). This method can be applied in several foodstuffs, such as sausages.
Acknowledgements
The authors acknowledged SNI (CONACyT) for the stipend received. ACO gratefully thanks PROMEP for financial support.
References
1. Tsai, P. J.; McIntosh, J.; Pearce, P.; Camden, B.; Jordan, B. R. Food Res. Int. 2002, 35, 351-356. [ Links ]
2. Tsai, P. J.; Huang, H. P. Food Res Int. 2004, 37, 313-318. [ Links ]
3. Castañeda-Ovando, A.; Pacheco-Hernández, M. L.; Páez-Hernández, M. E.; Rodriguez, J. A.; Galán-Vidal, C. A. Food Chem. 2009, 113, 859-871. [ Links ]
4. Iacobucci, G. A.; Sweeny, J. G. Tetrahedron, 1983, 39, 3005-3038. [ Links ]
5. Hrazdina, G. Phytochemistry 1971, 10, 1125-1130. [ Links ]
6. Markakis P., in: Anthocyanins as food colors, Markakis, P., Ed., Academic Press, New York, 1982, 245-252. [ Links ]
7. Berké, B.; Chèz, C.; Vercauteren, J.; Deffieux, G. Tetrahedron Lett. 1998, 39, 5571-5574. [ Links ]
8. Fichtner, C.; Remennikov, G.; Mayr, H. Eur. J. Org. Chem. 2001, 2201, 4451-4456. [ Links ]
9. NOM-213-SSA1-2002 Productos y servicios. Productos cárnicos procesados. Especificaciones sanitarias. Métodos de prueba. Declaratoria de vigencia publicada en el Diario Oficial de la Federación el 11 de julio de 2005. [ Links ]
10. Association of Official Analytical Chemists Official. Methods of Analysis. 973.31 Nitrites in cured meat. Colorimetric method. Association of Official Analytical Chemists, Arlington, 1990. [ Links ]
11. Jay, B.F. Anal. Chem. 1979, 51(9), 1493-1502. [ Links ]
12. Mathur, N.; Bhatnagar, P. J. Environ. Biol. 2007, 28(1), 123-126. [ Links ]
13. Giusti, M. M.; Wrolstad, R. E., in: Current protocols in food analytical chemistry, Wrolstad, R. E., Ed., John Wiley & Sons, New York, 2001, F1.2.1-F1.2.13. [ Links ]
14. Giusti, M. M.; Rodriguez-Saona, L. E.; Griffin, D.; Wrolstad, R. E. J. Agric. Food Chem. 1999, 47, 4657-4664. [ Links ]
15. Mazza, G.; Brouillard, R. Food Chem. 1987, 25, 207-225. [ Links ]
16. García-Viguera, C.; Bridle, P. Food Chem. 1999, 64, 21-26. [ Links ]
17. Massart, D. L.; Vandeginste, B.G.M.; Deming, S.N.; Michotte, Y.; Kaufman, L. Chemometrics: a textbook, Ed. Elsevier, 1988. [ Links ]
18. Miller, J. N.; Miller, J. C. Estadística y Quimiometría para Química Analítica, Ed. Prentice Hall, 2002. [ Links ]
19. Wrolstad, R. E.; Durst, R. W.; Lee, J. Trends Food Sci. Tech. 2005,16, 423-428. [ Links ]
20. Castañeda-Ovando, A.; Galán-Vida, C. A.; Rodríguez, J. A.; Rangel E., in: Innovations in Food Science and Food Biotechnology in Developing Countries, Regalado, C.; García, B. E., Ed., Asociación Mexicana de Ciencia de los Alimentos, Querétaro, 2010, 26-47. [ Links ]

