


Services on Demand
Journal
Article
 English (pdf)
 Article in xml format
 Article references
 Send this article by e-mail
Indicators
-
 Cited by SciELO
 -
 Access statistics
Related links
-
 Similars in
SciELO
Similars in
SciELO
Share

 Permalink
Journal of the Mexican Chemical Society
Print version ISSN 1870-249X
J. Mex. Chem. Soc vol.58 n.1 Ciudad de México Jan./Mar. 2014
Article
Study of Structure and Spectral Characteristics of the Zinc(II) and Copper(II) Complexes With 5,5-Dimethyl-2-(2-(3-nitrophenyl) hydrazono)cyclohexane-1,3-dione and Their Effects on Optical Properties and the Developing of the Energy Band Gap and Investigation of Antibacterial Activity
Nevin Turan,1* Bayram Gündüz,2* Hanifi Körkoca,3 Ragip Adigüzel,4 Naki Çolak,5 and Kenan Buldurun1
1 Chemistry Department, Faculty of Arts and Sciences, Mus. Alparslan University, 49250 Mus., Turkey. nevintrn@hotmail.com
2 Department of Science Education, Faculty of Education, Mus. Alparslan University, 49250 Mus., Turkey. bgunduz83@hotmail.com
3 Nursing Department, School of Health, Mus. Alparslan University, 49250 Mus., Turkey
4 Department of Chemical Engineering, Faculty of Engineering, Tunceli University, 62000 Tunceli, Turkey.
5 Chemistry Department, Faculty of Arts and Sciences, Hitit University, 19000 Corum, Turkey.
Received July 19, 2013.
Accepted October 14, 2013.
Abstract
A new chelating ligand, 5,5-dimethyl-2-(2-(3-nitrophenyl) hydrazono)cyclohexane-1,3-dione (L), and four transition metal complexes were synthesized. The ligand and its complexes were characterized by IR, 1H and 13C-NMR spectra, elemental analyses, magnetic susceptibility, mass spectra, UV-Vis. and thermogravimetry-differential thermal analysis (TGA-DTA). The metal complexes showed different geometric structures. Antibacterial tests of the ligand and complexes were also done. The Zn(II) complexes showed antibacterial activity against Staphylococcus aureus ATCC-25923 at middle level. The optical properties of the ligand and its complexes were extensively investigated by optical measurements. The average transmittance value of the ligand was the highest value, while the average transmittance value of the [CuL2(NO3)2]·6H2Ocomplex was the lowest value. The optical band gap of the ligand, [(Zn)2L(OH)4]·2DMF, [ZnL(NO3)2(H2O)2]·5H2O, [CuL2(OAc)]·OAc·3.5H2O and [CuL2(NO3)2]·6H2O complexes were calculated and 3.121 eV, 2.180 eV, 1.551 eV, 2.489 eV and 1.556 eV values were found, respectively. The complexes decreased the optical band gap of the ligand. The optical band gap value of the [ZnL(NO3)2(H2O)2]·5H2O complex is the lowest value. The optical band gap value of the ligand is the highest value. The complexes decrease the angle of incidence of the ligand, while complexes increase the angle of refraction of the ligand. The electric susceptibility of the ligand decreases with its complexes.
Keywords: Characterization, hydrazono, antibacterial activity, optical properties, energy band gap, metal complexes.
Resumen
En este trabajo se presenta la síntesis de un nuevo agente quelante, 5,5-dimetil-2-(2-(3-nitrofenil)hidrazono)ciclohexano-1,3-diona (L) y de sus complejos con iones de cuatro metales de transición. Los compuestos obtenidos fueron caracterizados mediante espectroscopia de infrarrojo, resonancia magnético nuclear (1H y 13C), por medio del análisis elemental, susceptibilidad magnética, espectros de masas, espectrofotometría UV/Vis y por termogravimetría diferencial. Los complejos de metales mostraron diferentes estructuras geométricas. Se realizaron las pruebas de actividad antibacteriana para el ligando y para sus complejos. El complejo de Zn(II) mostró actividad bactericida contra Staphylococcus aureus ATCC-25923 en nivel mediano. El más alto valor promedio de transmitancia se obtuvo para el ligando, mientras que el valor más bajo correspondió al complejo [CuL2(NO3)2]·6H2O. Se calcularon las energías de bandas prohibidas para L, [(Zn)2L(OH)4]·2DMF, [ZnL(NO3)2(H2O)2]·5H2O, [CuL2(OAc)]·OAc·3.5H2O y [CuL2(NO3)2]·6H2O, obteniéndose los valores 3.121 eV, 2.180 eV, 1.551 eV, 2.489 eV y 1.556 eV, respectivamente. Los valores encontrados para los complejos fueron más bajos respecto al ligando, siendo [ZnL(NO3)2(H2O)2]·5H2O el complejo de más bajo valor de energía de banda prohibida. El ángulo de incidencia fue más alto para L; mientras que los complejos presentaron valores relativamente más bajos. Por otro lado, la formación de complejos resultó en un aumento del ángulo de refracción respecto el valor obtenido para L. La susceptibilidad eléctrica de L se vio disminuida al formar los complejos con iones metálicos.
Palabras clave: Caracterización, hidrazona, actividad antibacteriana, propiedades ópticas, energía de banda prohibida, complejos de metales.
Introduction
Hydrazones are compounds whose molecules contain the >C=N-NH- triatomic linkage [1]. Hydrazones of the azome-thine class are distinguished from imines or oximes by two adjacent N atoms. Hydrazones have a variety of applications such as hole transporting agents [2] in organic layer photo conductors, as drugs for treatment of cancer, schizophrenia, leprosy, etc. [2-5]. Furthermore, the metal complexes of hydrazones have gained attention due to their biological activity and ability to act as inhibitors for many enzymes [6,7]. Many of the hydrazones show analytical applications such as metal extracting agent, sensor etc. [8]. Nonlinear optical properties shown by some hydrazones and their metal complexes offer their use in optoelectronic devices [9]. Extensive studies have been carried out on reactions of hydrazone derivatives with transition metals [10].
Hydrazones have several coordination sites and they can coordinate to transition metals either in the enol or keto form [11]. In addition, since the tautomers of a compound usually differ in thermodynamic stability, the equilibrium constants of complexation should differ for different tautomers of a ligand [12].
The optical constants, such as refractive index, extinction coefficient, dielectric and optical constant are important parameters to design the optical materials and they include the valuable information for technological applications of studied materials. Optical properties of any organic compound and metal complex are important for optical applications, because their optical properties are directly related to the structural and electronic properties of them. The optical constants, such as refractive index, absorption index and dielectric constant can be analyzed by transmittance and reflectance spectra [13] and these constants are calculated using Kramers-Kronig (KK) transformations.
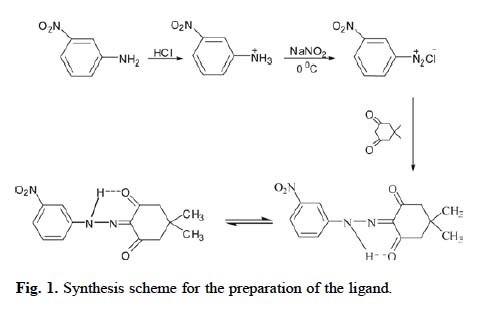
We describe here, consequently, the synthesis and characterization of several typical transition metal complexes of 5,5-dimethyl-2-(2-(3-nitrophenyl)hydrazono)cyclohexane-1,3-dione. All of the synthesized compounds were tested for their antibacterial activities against Escherichia coliATCC-25922, Enterococcus faecalis ATCC 29212, Staphylococcus aureus ATCC 25923 and Salmonella typhimurium CCM 583. Then, the test results were analyzed. The structure of the ligand was shown as in Fig. 1. In addition to effect on optical properties of the complexes the energy band gap of the ligand and complexes was examined. The optical absorption and reflectance spectra were analyzed to determine the optical constants.
Results and Discussion
Spectra-analytical studies IR, 1H and 13C-NMR, UV-VIS, TGA-DTA, magnetic susceptibility, mass spectrophotometer and elemental analysis measurements corroborated the structure of all the synthesized compounds. They are insoluble in common organic solvents, but they are soluble in DMF and DMSO. The elemental analyses show that all the complexes have 1:1, 1:2 and 2:1 stoichiometry.
Infrared spectra
The IR spectra of the newly synthesized ligand and complexes of zinc and copper are recorded in the region of 400-4000 cm-1. The IR spectrum of the isolated L shows aromatic and aliphatic CH vibrations at 3335-2900 cm-1. ν(C=O) (1671 cm-1), ν(C=O...H) (1626 cm-1) and ν(C=N) (1558 cm-1) also support the H-bonded hydrazone structure in the solid state.
The ligand shows absorption peaks at 1626 cm-1 and 1671 cm-1corresponding to two (C=O) groups. The first band is affected slightly in all complexes of ligand, while the second band is shifted to lower and/or high frequencies (16, 31 cm-1). This situation, the shift of ν(C=O) at lower wave number, can be attributed to the intramolecular hydrogen bond (C=O...HN). Sharp and less intense bands corresponding to NH stretching frequency are observed at 3435-3109 cm-1 region in all the compounds. The observed shift in values towards the longer wave number region can be also accounted again by the aforementioned possible intermolecular hydrogen bonding. Ligand has a characteristic ν(C=N) band at 1558 cm-1 which shifts in all the complexes (1540-1532 cm-1), indicating that nitrogen coordinates. The ν(N-N) band is observed at 1025 cm-1 and 1043 cm-1 in the spectra of ligand. Shifting of this band to the higher frequency region is observed in the spectra of all the complexes. This observation also indicates the participation of nitrogen in the coordination. The spectra of the complexes show new absorption bands in the 596-514 cm-1 and 483-458 cm-1 ranges, ssigned to ν(M-O) and ν(M-N) vibrations, respectively. From the above results it can be concluded that the free ligand behaves as a monoanionic, bidentate ligand, via one of the oxygen of the carbonyl group and the neighboring nitrogen atom of the azo group [14].
A broad band at 3548-3435 cm-1 maybe assigned to stretching, rocking and wagging modes ofcoordinated water molecules with together new bands 882-976 cm-1 and 632 cm-1 in the spectrum of the[ZnL(NO3)2(H2O)2]·5H2O complex [15].
The spectrum of [CuL2(OAc)]·OAc·3.5H2O displays a medium-strong band at 1555 cm-1 and a band at 1352 cm-1. This shows characteristic of monodentate coordinated acetate group with Δν = 203 cm.-1
The coordinated NO3 group incomplexes[CuL2(NO3)2]·6H2O and [ZnL(NO3)2(H2O)2]·5H2O shows 4 cm-1 and at 1304-1369 cm-1. The both bands may be assigned to the asymmetric and symmetric stretches ν1 and ν2 of the nitrate group. We can conclude that the NO3 group is coordinated in a monodentate manner [18, 19]. The spectra of [(Zn)2L(OH)4]·2DMF shows intense broad band at 3434-3500 cm-1 due to ν(OH) molecules [20]. Also the IR spectrum of the complex show strong bands around 1665 cm-1 assigned to a ν(C=O) vibration of the dmf molecules [21].
1H-NMR and 13C-NMR spectra
The spectrum of the ligand shows different peaks at 0.96 (s), 1.27 (s), 2.48 (s), 14.50 (s), and 7.62-8.00 (m). These peaks are attributed to -CH3, -CH2, -NH, and aromatic protons, Study of Structure and Spectral Characteristics of the Zinc(II) and Copper(II) Complexes respectively. The observed deshielding can be accounted for by considering the intramolecular hydrogen bonding of -NH proton with the electronegative oxygen. The intramolecular hydrogen bonding results in creation of six-member pseudoring as shown in Fig. 1. We find that the peaks specialized to -OH proton and new strong broad peak at 3.50 ppm in the 1 H-NMR spectrum of Zn(II) complexes. 3.50 ppm can be assigned to the H-proton of H2O, which attached to the Zn(II) metal to complete the coordination sphere [22]. The 1H-NMR spectra of the Cu(II) complexes were not obtained due to para-magnetism.
Electronic spectra and magnetic susceptibility
The electronic by spectra of ligand and complexes were measured in DMF (10-3 molL-1). In spectra of ligand, two intense bands at 218-242 nm and 316-393 nm were observed. The first is assigned to π→π* transition. The second is assigned to the π→* transition associated with C=N and C=O of ligand[23].
The electronic spectra of the complexes in DMF shows bands in the regions 557-311 nm (ε = 321-1427). These bands are also observed in the spectra of the ligand and are assigned to charge transfer and intraligand transitions.
The effective magnetic moment values of [CuL2(NO3)2]·6H2O and [CuL2(OAc)]·OAc·3.5H2O complexes are 1.86 and 2.01 B.M, respectively. The higher magnetic moment values of these complexes can be rationalized in terms of the orbital contribution of donor atoms toward the spin-only value. [CuL2(NO3)2]·6H2O complex shows an effective magnetic moment μeff 1.86 BM, which is higher than that of the spin only value (1.73 BM) and indicates the presence of an unpaired electron for mononuclear copper ion [24]. Thus, the magnetic moment value and spectral data support distorted octahedral geometry for [CuL2(NO3)2]·6H2O [25, 26].
The measured values of the magnetic moments for the [CuL2(OAc)]·OAc·3.5H2O complex have 2.01 B.M., somewhat higher than the spin-only value. Such divergence is not uncommon in mononuclear Cu(II) complex due to mixing-in of some angular momentum from the closely lying excited states via spin-orbit coupling. Magnetic moment value and spectral data support square pyramidal geometry [27].
The diamagnetic Zn(II) complexes don't show any d-d bands and their spectra are dominated only by charge transfers bands. Zn(II) complexes show strong absorptions at 351-400 nm for charge transfer. In the [ZnL(NO3)2(H2O)2]·5H2O complex, the charge transfer band at 253-287 nm is assigned as due to 2Eg→T2g transition possibly in an octahedral environment [28].
Thermal studies
The TGA of the complexes over the temperature range 50-800 °C show good agreement with the formulas suggested from analytical data. The decomposition stages, temperature range, decomposition product and the found (Calcd) weight loss % of some complexes are given in Table 1.
The thermogram of [CuL2(OAc)]·OAc·3.5H2O is characterized by two degradation steps in the range 50.20-245.50 °C, 245. 50 - 470.60°C, the first corresponding to loss of lattice waters and acetate molecules, found 21.54% (Calcd. 22.00%), the second from loss of C28H28N6O7; found 67.42% (Calcd. 68.08%). The DTA curve of the Cu(II) complex shows endo-thermic peak at 238.30 °C corresponding to the loss of molecules of hydration water and one exothermic peak at 440.16 °C. The exothermic peak is likely due to elimination and/or decomposition of ligand [29].
The curve of [(Zn)2L(OH)4]·2DMF shows stability at 70.00 °C, above which a weight loss by 10.76% (Calcd. 11.51%) corresponds to removal of 2DMF molecules. The second stage ending at 230.81-260.12 °C is assigned to the elimination of 4OH molecules from the ligand accompanied by a weight loss of 10.76% (Calcd. 10.72%) [30,31]. The DTA curve of the Zn(II) complex shows two endothermic peak at 145.70 °C and 150.35 °C corresponding to the loss of 2DMF and one exothermic peak at 250.50 °C. The exothermic peak is likely due to the remove of 4OH molecules.
The thermal analysis of [CuL2(NO3)2]·6H2O is performed to determine the lattice water in the complex. [CuL2(NO3)2]·6H2O shows that an endothermic peak at 230 °C, accompanied by slightly weight loss of 12.31% (the calculated value is 12.36%), which corresponds to the loss of six lattice water molecules. The second decomposition step in the temperature range 210.00425.55 oC, the experimentally found weight loss is 55.39% (calculated weight loss of 55.74%). This may be attributed to the elimination of two NO3 and C14H25N3O8 molecules. These are consistent with the conclusion from the IR and NMR spectra.
The decomposition curve of [ZnL(NO3)2(H2O)2]·5H2O begins by a step at 90.00-290.50 oC, displaying (found weight loss of 15.38% agrees well with the calculated weight loss of 15.03%) weight loss corresponding to the removal of hydrated water molecular. The second decomposition step in the temperature range 290.50-310.00 °C, the experimentally found weight loss is 6.15% (calculated weight loss of 6.68%). This may be attributed to the elimination of two water molecules. The DTA curve of the complex shows two exothermic peaks at 255.50 °C and 410.25 °C. The two stages of the complex decomposition are irreversible [32].
In Table 1 uncompleted parts referee to the remaining parts that between last examined temperatures and 800 °C for each complexes.
Mass spectra
The molecular ion peaks of [CuL2(NO3)2]·6H2O and [CuL2(OAc)]·OAc·3.5H2O complexes were observed m/z: 874.31 [M+H]+ and m/z: 823.39 [M+H]+, respectively. On the other hand [M-3OH-2H]+ complex ion was observed m/z: 580.23 in highly abundance instead of ion peak in the [(Zn)2L(OH)4]·2DMF complex. It is thought that ammonium ion was bounded to [ZnL(NO3)2(H2O)2]·5H2O complex. Ammonium ion was bounded to the molecule during the dissolution of complex. The molecular [M+NH4]+ ion peak bounded to ammonium in [ZnL(NO3)2(H2O)2]·5H2O was observed m/ z: 623.18. The molecular ion peak [L+H]+ belong to free ligand was observed m/z: 290.12 in all complexes similarly. The highest peaks in the abundance percent were considered at spectrum. The result of mass spectrum, thermogravimetry-differential thermal analysis and IR spectrum support these structure [33, 34].
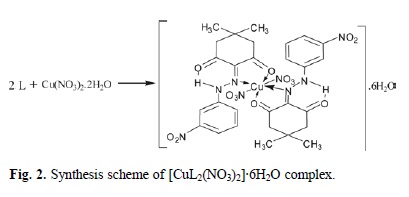
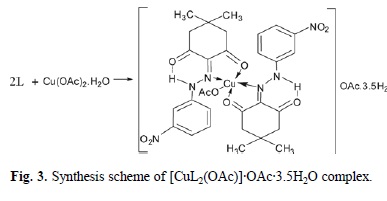
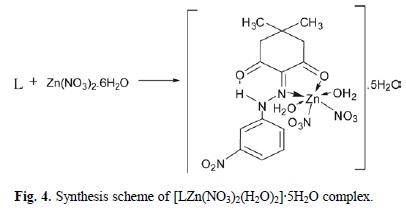
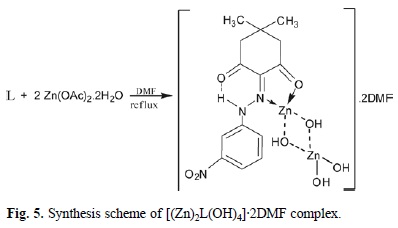
Single crystals of the complexes could not be isolated from any solutions, thus no definite structure could be described. However, the analytical, spectroscopic andmagnetic data enable to us propose the possible structures which are shown below in Fig. 2-5 (3,4).
Antibacterial activity
The antibacterial activity test results from the complexes are shown in Table 2. Preliminary bioassay sindicate that two complexes are active against Staphylococcus aureus ATCC-25923, although they don't have the effectiveness gainst Escherichia coli ATCC-25922, Enterococcus faecalis ATCC 29212 and Salmonella typhimurium CCM 583.
The optical constants of the ligand and its complexes
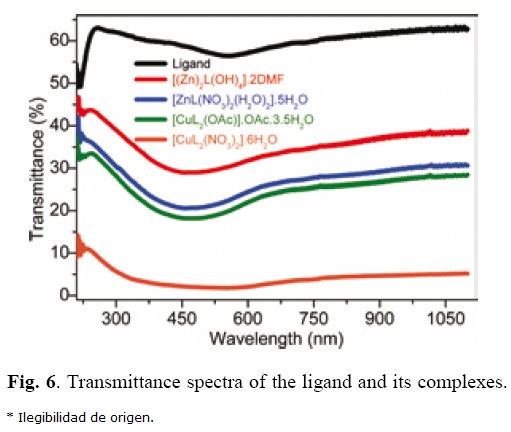
The films of the ligand and its complexes coated on cleaned glasses at room temperature. The absorbance, transmittance and reflectance spectra of the ligand and its complexes are measured to investigate its optical properties at room temperature. The transmittance curves of the ligand and its complexes are shown in Fig. 6. As seen in Fig. 6, the transmittance values of the ligand are higher than transmittance values of its complexes and the transmittance of the ligand decreases with its com- plexes. In the visible region, the average transmittance values of the ligand, [(Zn)2L(OH)4]·2DMF, [ZnL(NO3)2(H2O)2]·5H2O, [CuL2(OAc)]·OAc·3.5H2O and [CuL2(NO3)2]·6H2O complexes are found to be 58.505, 31.895, 24.255, 21.871 and 2.683%, respectively. The average transmittance value of the ligand is the highest value, while the average transmittance value of the [CuL2(NO3)2]·6H2O complex is the lowest value. This shows that the complexes are effect on the transmittance spectra of the ligand. This result is significant in electronic and optoelectronic applications of materials, because this shift in the transmittance spectra reduces the optical band gap of the ligand. The lower optical band gap of the materials is preferred for the production of the electronic and optoelectronic devices.
The refractive index is an important parameter for optical applications. Thus, it is important to determine optical constants of the ligand and its complexes. The complex optical refractive index of the films is expressed as
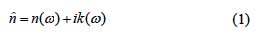
where n is the real part and k is the imaginary part of complex refractive index. The optical properties of the ligand and its complexes can be characterized by refractive index. Refractive index values of the ligand and its complexes are calculated by [35-37].
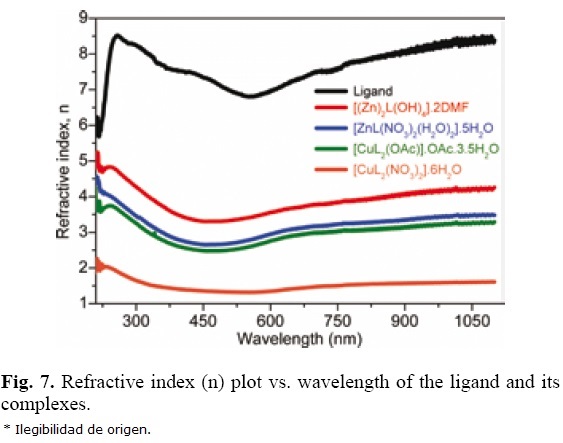
Refractive index dispersion curves of the ligand and its complexes are shown in Fig. 7. As seen in Fig. 7, the refractive index of the ligand is higher than that of its complexes and the refractive index of the ligand decreases with its complexes. The refractive index n values of the ligand, [(Zn)2L(OH)4]·2DMF, [ZnL(NO3)2(H2O)2]·5H2O, [CuL2(OAc)]·OAc·3.5H2O and [CuL2(NO3)2]·6H2O complexes with changing of wavelength from 210 nm to 1100 nm vary from 5.849 to 8.383, from 5.010 to 4.258, from 4.370 to 3.477, from 3.768 to 3.287 and from 1.922 to 1.609, respectively. The refractive index of the ligand is the highest value, while the refractive index of the ligand are higher than transmittance values of its complexes and the transmittance of the ligand decreases with its complexes. In the visible region, the average transmittance values of the ligand, [(Zn)2L(OH)4]·2DMF, [ZnL(NO3)2(H2O)2]·5H2O, [CuL2(OAc)]·OAc·3.5H2O and [CuL2(NO3)2]·6H2O complexes with changing of wavelength from 210 nm to 1100 nm vary from 5.849 to 8.383, from 5.010 to 4.258, from 4.370 to 3.477, from 3.768 to 3.287 and from 1.922 to 1.609, respectively. The refractive index of the ligand is the highest value, while the refractive index of the [CuL2(NO3)2]·6H2O complex is the lowest value. This shows that the complexes are effect on the refractive index of the ligand.
The optical band gap of the ligand and its complexes can be obtained dependence of absorption coefficient (α) on photon energy (E). The α dependence on E is analyzed by the following relation [36, 38].
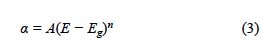
where A is a constant, Eg is the optical band and n is the parameter measuring type of band gaps. To determine the optical band gap of the ligand and its complexes, the dependence of photon energy E of (αhv)2 of the ligand and its complexes is shown in Fig. 8. As seen in Fig. 8, there are two linear regions for the direct band gap of the films of the ligand and its complexes. By extrapolating the linear plot to (αhv)2 = 0, a direct energy-gap values of the ligand, [(Zn)2L(OH)4]·2DMF, [ZnL(NO3)2(H2O)2]·5H2O, [CuL2(OAc)]·OAc·3.5H2O and [CuL2(NO3)2]·6H2O complexes at first region and second region are obtained 1.438 eV and 4.804 eV, 1.447 eV and 2.913 eV, 1.569 eV and 1.532 eV, 1.572 eV and 3.405 eV and 1.517 eV and 1.594 eV, respectively. Thus, the optical band gap of the ligan [(Zn)2L(OH)4]·2DMF, [ZnL(NO3)2(H2O)2]·5H2O, [CuL2(OAc)]·OAc·3.5H2O and [CuL2(NO3)2]·6H2O complexes were calculated to be 3.121 eV, 2.180 eV, 1.551 eV, 2.489 eV and 1.556 eV, respectively. The optical band gap of the ligand is higher than that of its complexes and the optical band gap of the ligand decreases with its complexes. These results show that the complexes decrease the optical band gap of the ligand. This result is very significant in applications of electronic and optoelectronic devices, because of the lower optical band gap of the materials.
The optical band gap value of the [ZnL(NO3)2(H2O)2]·5H2O complex is the lowest value, while the optical band gap value of the ligand is the lowest value. This shows that the effect of the [CuL2(OAc)]·OAc·3.5H2O complex is the lowest, while the effect of the [ZnL(NO3)2(H2O)2]·5H2O complex on the decreasing of the optical band gap of the ligand is the highest. Also, as seen in optical band gap values of the ligand and its complexes, the [ZnL(NO3)2(H2O)2]·5H2O complex is more effective complex than that of the [CuL2(NO3)2]·6H2O complex and the [(Zn)2L(OH)4]·2DMF complex is more effective complex than that of the [CuL2(OAc)]·OAc·3.5H2O complex in the decreasing of the optical band gap value of the ligand. These results show that the [(Zn)2L(OH)4]·2DMF and [ZnL(NO3)2(H2O)2]·5H2O complexes are more effective than that of [CuL2(OAc)]·OAc·3.5H2O and [CuL2(NO3)2]·6H2O complexes on the decreasing of the optical band gap value of the ligand.
Angle of incidence Φ(B) is given [39-41].
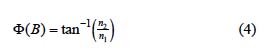
Angle values of incidence Φ(B) were calculated from eq. (4) and Φ(B) plot vs. photon energy (E) of the films of the ligand and its complexes is shown Fig. 9. As seen in Fig. 9, the angle value of incidence of the ligand is the highest value that of all the films and the angle value of incidence of the [CuL2(NO3)2]·6H2O complex is the lowest value that of all the films. This shows that the complexes decrease the angle of incidence of the ligand.
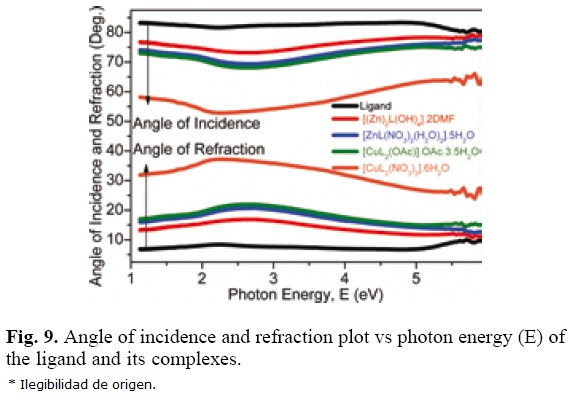
Angle of refraction is calculated from well known Snell's law [42-44]
θ2 plot vs. photon energy of the ligand and its complexes is shown Fig. 9. As seen in Fig. 9, the angle value of refraction of the ligand is the lowest that of all the films and the angle value of refraction of the[CuL2(NO3)2]·6H2O complex is the highest which of all the films. This shows that the complexes increase the angle of refraction of the ligand. As seen in Fig. 9, the angle values of incidence of the films are higher than that of angle values of refraction of the films. This situation attributes to the refractive index (n2) of the ligand and its complexes are higher than the refractive index (n1) of the medium.
The dielectric properties of ligand and its complexes
The complex dielectric constant is described as,

where ε1 is the real part and ε2 is the imaginary of the dielectric constant. The imaginary and real parts of dielectric constant are given as [39-40]

and

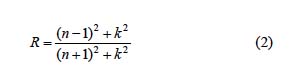
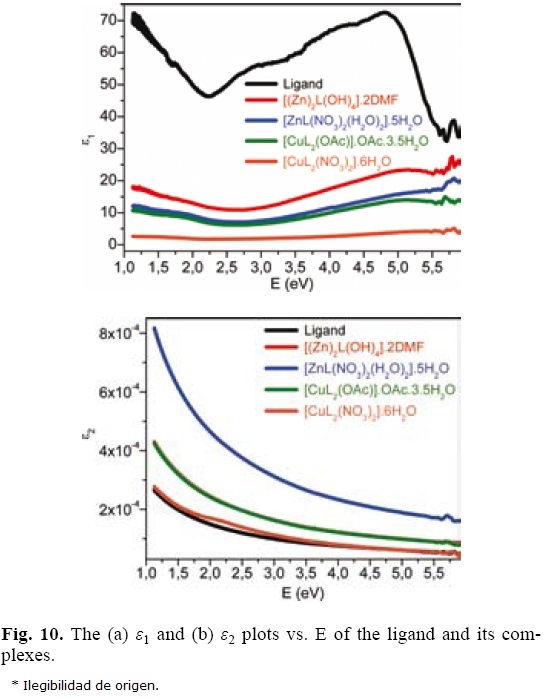
where k = aλ/4π. The real parts of the dielectric constant of the ligand and its complexes were calculated from eq. (7) and ε1 plot vs. photon energy (E) of the films is shown Fig. 10a. The imaginary parts of the dielectric constant of the ligand and its complexes were calculated from eq. (8) and ε2 plot vs. photon energy (E) of the films is shown Fig. 10b. As seen in Fig. 10a, the real part of the dielectric constant of the ligand is higher than that of its complexes and the real part of the dielectric constant of the ligand decreases with its complexes. The real part of the dielectric constant of the ligand is the highest value, while the real part of the dielectric constant of the [CuL2(NO3)2]·6H2O complex is the lowest value. This shows that the complexes are affect on the real part of the dielectric constant of the ligand. As seen in Fig. 10b, the imaginary part of the dielectric constant of the [ZnL(NO3)2(H2O)2]·5H2O complex is higher than that of all the films and the imaginary part of the dielectric constant of the ligand is close to that of the [CuL2(NO3)2]·6H2O complex. The real parts of the dielectric constant of the ligand and its complexes are higher than that of imaginary parts of the dielectric constant.
The electrical susceptibility properties of ligan and its complexes
The susceptibility associated with electron transitions from band i to band j is expresed [42,43,45]
where k is the wave number vector, h∾jik is the energy difference between the state k in band i and the state k in band j and fjik is the oscillator strength for this transition. The electrical susceptibility due to the intraband transitions of free carriers can be obtained from the optical constants and it is determined as [41,46,47]
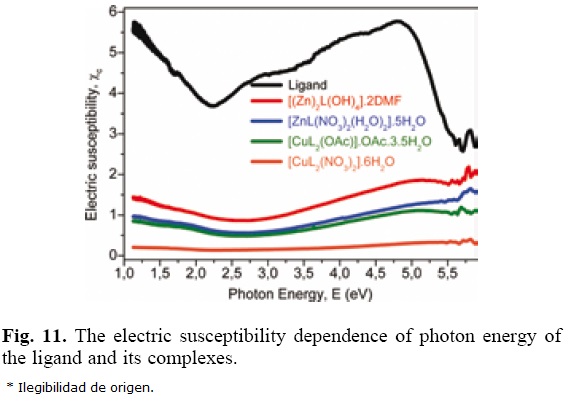
where ε0 is the dielectric constant in the absence of any contribution from free carriers. The electric susceptibility of the ligand and its complexes were calculated from eq. (10) and the electric susceptibility dependence of photon energy is shown in Fig. 11. As seen in Fig. 11, the electric susceptibility of the ligand is higher than that of its complexes and the electric susceptibility of the ligand decreases with its complexes. The electric susceptibility of the ligand is the highest value, while the electric susceptibility of the [CuL2(NO3)2]·6H2 complex is the lowest value.
The optical conductivity properties of ligand and its complexes
The optical properties of the ligand and its complexes can be analyzed by a complex optical conductivity [45-47],
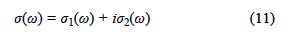
where σ1 is the real part of conductivity and σ2 is the imaginary part of conductivity. The real part and imaginary parts of the optical conductivity of the ligand and its complexes were calculated. The real and imaginary parts of the optical conductivity of the ligand and its complexes are shown in Fig. 12(a,b), respectively. As seen in Fig. 12a, the real part of the conductivity of the [ZnL(NO3)2(H2O)2]·5H2O complex is higher than that of all the films. As seen in Fig. 12b, the imaginary part of conductivity of the ligand is higher than that of its complexes and the imaginary part of conductivity of the ligand decreases with its complexes. The imaginary part of conductivity of the ligand is the highest value, while the imaginary part of conductivity of the [CuL2(NO3)2]·6H2O complex is the lowest value. This shows that the complexes are effective on the imaginary part of conductivity of the ligand. The imaginaryparts of optical conductivity of all complexes increase with increasing frequency, but this plot is not stable for the ligand because of higher optical band gap. The imaginary parts of the optical conductivity of the ligand and its complexes are higher than that of real parts of the optical conductivity.
Experimental
Chemicals and instrumentations
All solvents were analytical grade reagents used as purchased. The metal salts Zn(NO3)2·6H2O, Cu(NO3)2·2H2O, Zn(Ac)2·2H2O, Cu(Ac)2·H2O and starting materials for the ligand were Merck, Aldrich, and Alfa Aesar products.
Elemental analyses were carried out on a Leco CHNS-O model 932 elemental analyzer. 1H and 13C-NMR spectra were recorded using a model Bruker GmbH DPX-400 MHz FT spectrometer. IR spectra were recorded Perkin Elmer Precisely Spectrum One Spectrometer on KBr discs in the wave number range of 4000-400 cm-1. Electronic spectral studies were conducted on a Shimadzu model UV-1700 Spectrophotometer in the wavelength 1100-200 nm. Magnetic susceptibilities measurements were performed using the standard Gouy tube technique. Hg[Co(SCN)4] was used as a calibrant. Thermal analyses (TGA and DTA) were carried out in nitrogen atmosphere with a heating rate of 10 °C/min. using Shimadzu DTG-60 AH (Shimadzu DSC 60 A) thermal analyzers. LC/MS-API-ES< mass spectra were recorded using a AGILENT model 1100 MSD mass spectrophotometer. Optical studies were conducted on a Shimadzu model UV-1700 Spectrophotometer in the wavelength 1100-190 nm. Optical measurements were carried out by using a pellet with diameter of 6 mm in pressed under 5 tonne/cm2 at room temperature.
Antibacterial activity studies
Disk diffusion method was used for antibacterial activity of complexes. Antibacterial activity against Enterococcus faecalis ATCC 29212, Staphylococcus aureus ATCC 25923, Escherichia coli ATCC 25922, Salmonella typhimurium CCM 583 were investigated. Mueller-Hinton agar (oxoid) for all bacterial strains was used and for Enterococcus faecalis ATCC 29212 Mueller Hinton agar added 5% defibrinated sheep blood. The media were melted at 100 °C, autoclaved at 121 °C for 15 min, cooled 45 °C to 50 °C and were poured into plates of 9 cm diameter in quantities of 20 mL, and left on a flat surface to solidify and the surface of media was dried at 37 °C. Then, preparation of the inoculums was used colony growth method in Mueller-Hinton broth to a turbidity equivalent 0.5 Mc Farland (108 cfu mL-1). Petri dishes were streaked using sterile cotton swab. The surface of the media was allowed to dry 3-5 min at room temperature. The 10 mg mL-1 (in DMSO, E. Merck), compound impregnated blank discs (Oxoid) were applied to the surface of inoculated plates. The Mueller-Hin-ton agar plates were incubated at 35 ± 2 °C for 18-24 h. The plates were examined and the diameter of the inhibition zone was measured surrounding discs. Antibiotic ampicillin (10 ug, Oxoid) was used as the standard [48, 49].
Synthesis
Preparation of ligand
A hydrochloric acid solution (2.5 mL) of 3-nitroaniline (1.38 g, 10 mmol) and an aqueous solution (10 mL) of sodium nitrite (0.69 g, 10 mmol) were mixed and stirred at 273 K for 1 h. To this solution, an ethanol solution (10 mL) of the coupling component 5,5-dimethylcyclohexane-1,3-dione (1.40 g, 10 mmol) was added and the stirring was continued at 273 K for 4 h. The resulting product was filtered and was washed with water, was dried and was crystallized from ethanol.
Ligand; Yield: (83.0%). FW: 289.11 g/mol. m. p.:150 °C. Anal Calcd for C14H15N3O4: C, 58.13, H, 5.23, N, 14.53. Found: C, 58.00, H, 5.20, N, 14.42. Selected IR data (KBr, ν cm-1): 3435-3109 (N-H), 1671, 1626 (C=O), 1558 (C=N), 1505 (C=C), 1025, 1043 (N-N). UV-VIS (in DMF): λmax (ε, L mol-1 cm-1) 218-242 (1453, 1613), 316-393 (2106-2620) nm. 1H-NMR (400 MHz, DMSO-d6): δ 14.50 (s, 1H, NH), 7.62-8.00 (m, 4H, Ar-CH), 2.48 (s, 2CH2), 1.27, (s, CH3), 0.96 (s, CH3). 13C-NMR (400 MHz, DMSO-d6) for the L: δ 28.45 (CH3), 30.62 (CH3), 52.47 (2CH2), 117.90 (Ar-H), 119.23 (Ar-H), 131.76 (Ar-NH-N), 145.92 (C=N), 193.41 (C=O), 197.71 (C=O). MS [ESI+]: m/z 290 [L+H]+. Color: Bright yellow mustard.
Preparation of the Zn(II) and Cu(II) complexes of ligand
The ligand (1 g, 3 mmol) was dissolved in 10 mL absolute methanol. A solution of metal salts Zn(NO3)2·6H2O (0.90 g, 3 mmol), Cu(NO3)2·2H2O (0.35 g, 1.50 mmol) and Cu(OAc)2·H2O (0.30 g, 1.50 mmol), in 15 mL absolute methanol was added drop wise in a 15 min. period with continuously stirring at room temperature. Then, the reaction mixtures were heated to reflux for 8 h at 50 °C temperature. The resulting precipitates were filtered and were washed with absolute ether. The products were dried at room temperature. [(Zn)2L(OH)4]·2DMF complex was prepared similar with other complexes but dmf was used as solution (10 mL) to dissolved Zn(Ac)2·2H2O (1.32 g, 6.00 mmol) [18].
[CuL2(OAc)]·OAc·3.5H2O; Yield: (85.0%). FW: 822.76 g/mol. m. p.: 190 °C. μeff (B.M.): 2.01. Anal Calcd for C32H43N6O15.5Cu: C, 46.67, H, 5.23, N, 10.21. Found: C, 46.70, H, 5.20, N, 10.24. Selected IR data (KBr, ν cm-1): 3430 (O-H), 3330-3267(b) (N-H), 1640 (C=O), 1540 (C=N), 1506 (C=C), 1054 (N-N), 560,517 (M-O), 464 (M-N). UV-VIS (in DMF): λmax (ε, L mol-1 cm-1) 251-271 (1428-1423), 364-375 (936917), 463, 557 (343, 321) nm. MS [ES]: m/z 823.76 (calc), 823.39 (found) [M+H]+, 290.11 (calc.), 290.12 (found) [L+H]+. Color: gray.
[CuL2(NO3)2]·6H2O; Yield: (75.0%). FW: 873.54 g/mol. m. p.: 195 °C. μeff (B.M.): 1.86. Anal Calcd for C28H42N8O20Cu: C, 38.46, H, 4.81, N, 12.81. Found: C, 38.44, H, 4.83, N, 12.79. Selected IR data (KBr, ν cm-1): 3535(b) (O-H), 3340(b) (N-H), 1686 (C=O), 1532 (C=N), 1506 (C=C), 1048 (N-N), 566,514 (M-O), 482,458 (M-N). UV-VIS (in DMF): λmax (ε, L mol-1 cm-1) 251-399 (1428-1420), 405-425 (1426-1332) nm. MS [ES]: m/z 874.64 (calc), 874.31 (found) [M+H]+, 290.11 (calc.), 290.12 (found) [L+H]+. Color: Black.
[(Zn)2L(OH)4]·2DMF; Yield: (84.0%). FW: 633.85 g/mol. m. p.: 190 °C. μeff (B.M.): Dia. Anal Calcd for C20H33N5O10Zn2: C, 37.86, H, 5.20, N, 11.04. Found: C, 37.90, H, 5.73, N, 11.00. Selected IR data (KBr, ν cm-1): 3434-3500 (O-H)(b)), 3317 (N-H), 1687 (C=O), 1533 (C=N), 1506 (C=C), 1047 (N-N), 596-566 (M-O), 483, 460 (M-N). UV-VIS (in DMF): λmax (ε, L mol-1 cm-1) 253-287 (1428-1256), 311-396, 430 (14271418, 1285) nm. 1H-NMR (400 MHz, DMSO-d6): δ 14.55 (s, NH), 7.60-8.00 (m, Ar-CH), 12.76 (b, OH), 2.50 (s, CH2), 1.28 (s, CH3), 1.00 (s, CH3). MS [ES]: m/z 580.85 (calc), 580.23 (found) [M-3OH-2H]+, 290.11 (calc.), 290.12 (found) [L+H]+. Color: Orange.
[ZnL(NO3)2(H2O)2]·5H2O; Yield: (82.0%). FW: 604.48 g/mol. m. p.: 186 °C. μeff (B.M.): Dia. Anal Calcd for C14H29N5O17Zn: C, 27.79, H, 4.80, N, 11.58. Found: C, 27.82, H, 4.82, N, 11.68. Selected IR data (KBr, ν cm-1): 3400(b)(O-H), Broad (N-H), 1686 (C=O), 1533 (C=N), 1510 (C=C), 1048 (N-N), 540,567 (M-O), 480, 462 (M-N). UV-VIS (in DMF): λmax (ε, L mol-1 cm-1) 255-357 (1209-1368), 404-447 (1396-1339) nm. 1H-NMR (400 MHz, DMSO-d6): δ 14.60 (s, NH), 7.60-7.90 (m, Ar-CH), 3.50 (b, H2O), 2.52 (s, CH2), 1.28 (s, CH3), 0.96 (s, CH3). MS [ES]: m/z 622.48 (calc), 623.18 (found) [M+NH4]+,, 290.11 (calc.), 290.12 (found) [L+H]+,. Color: Orange.
Conclusion
In this study, the synthesis and structural investigations of containing hydrazone ligand and its transition metal(II) complexes were presented. Structures of the ligand and complexes were confirmed by spectral and analytical techniques.The Zn(II) complexes shows at middle level antibacterial activity against Staphylococcus aureus ATCC-25923 by comparing with ampicillin (10 μg, Oxoid).
The complexes reduced the transmittance, refractive index, optical band gap, angle of incidence, real part of the dielectric constant, electric susceptibility and imaginary part of optical conductivity of the ligand, while the complexes increased the real part of conductivity and angle of refraction of the ligand. The energy band gap of the ligand was decreased with its complexes. The optical band gap of the ligand, [(Zn)2L(OH)4]·2DMF, [ZnL(NO3)2(H2O)2]·5H2O, [CuL2(OAc)]·OAc·3.5H2O and [CuL2(NO3)2]·6H2O complexes were calculated to be 3.121 eV, 2.180 eV, 1.551 eV, 2.489 eV and 1.556 eV, respectively. The effect of the [CuL2(OAc)]·OAc·3.5H2O complex is the lowest, while the effect of the [ZnL(NO3)2(H2O)2]·5H2O complex on the decreasing of the optical band gap of the ligand is the highest.
The electric susceptibility and imaginary partof conductivity of the ligand are the highest value, while the electric susceptibility and imaginary part of conductivity of the[CuL2(NO3)2]·6H2O complex are the lowest value.
References
1. Deepa, K.; Aravindakshan, K. K. Synth. React. Inorg. Met.-Org. Chem. 2005, 35, 409-416. [ Links ]
2. Monfareda, H. H.; Nazaria, M.; Mayerb, P.; Kamyabia, M-A.; Erxlebenc, A.; Asgaria, Z. Z. Naturforsch. 2009, 64b, 409-414. [ Links ]
3. Carcelli, M.; Mazza, P.; Pelizzi, C.; Pelizzi, G.; Zani, F. J. Inorg. Biochem. 1995, 57(1), 43-62. [ Links ]
4. Bacchi, A.; Bonardi, A.; Carcelli, M.; Pelagatti, P.; Pelizzi, C.; Pelizzi, G.; Solinas, C.; Zani, F. J. Inorg. Biochem. 1998, 69, 101-112. [ Links ]
5. Todeschini, A. R.; de Miranda, A. L. P.; da Silva, K. C. M.; Parrini, S. C.; Barreirom, E. J. Eur. J. Med. Chem. 1998, 33, 189199. [ Links ]
6. Tamasi, G.; Chiasserini, L.; Savini, L.; Sega, A.; Cini, R. J. Inorg. Biochem. 2005, 99, 1347-1359. [ Links ]
7. Mathew, N. Department of Applied Chemistry, Cochin University of Science and Technology, Chapter 1, Kochi 682 022, India, 2011, pp:7. [ Links ]
8. Ganjali, M.R.; Rezapour, M.; Rasoolipour, S.; Norouzi, P.; Adip, M. J. Braz. Chem. Soc. 2007, 18, 352-358. [ Links ]
9. Naseema, K.; Sujith, K.V.; Manjunatha, K.B.; Kalluraya, B.; Umes, G.; Rao, V. Optic Laser Tech. 2010, 42, 741-748. [ Links ]
10. Teo, S-B.; Yeow, L-M.; Yeap, G-Y.; Ishizawa, N.; Etschmann, B.; and Skelton B. J Coord Chem. 2003, 56, 215-221. [ Links ]
11. Gadjieva, S. R.; Mursalov, T. M.; Mahmudov, K. T.; Pashaev, F. H.; Chyragov, F. M. J. Anal. Chem. 2006, 61, 550-555. [ Links ]
12. Narang, K. K.; Rao, T. R.; Shrestha,S. Synth. React. Inorg. Met.-Org. Chem. 2000, 30, 931-954. [ Links ]
13. Yakuphanoglu, F.; Cukurovali, A.; Yilmaz, I. Phys B 2004, 353, 210-216. [ Links ]
14. Nakamoto, K. Infrared Spectra of Inorganic and Coordination Compounds, 3rd ed., Wiley Inter science, New York, 1970, pp. 159, 167, 214. [ Links ]
15. Nakamoto, N. Infrared Spectra and Raman Spectra of Coordination Compounds, John Wiley & Sons, New York, 1978. [ Links ]
16. Cao, G-B. Synth React Inorg Met-Org. Nano-Met. Chem. 2007, 37, 639-642. [ Links ]
17. Kumar, D.; Syamal, A. and Sharma, L. K. J Coord Chem. 2008, 61, 1788-1796. [ Links ]
18. Bhowon, M. G.; Li Kam Wah, H.; Dosieah, A.; Ridana, M.; Ra-malingum, O.; Lacour, D. Synth. React. Inorg. Met.-Org. Chem. 2004, 34,1-16. [ Links ]
19. Khan, T.A.; Rather, M.A.; Jahau, N.;Varskey, S.P.; Shakir, M. Synth. React. Inorg. Met.-Org. Chem. 1997, 27, 843-854. [ Links ]
20. Turan, N.; Sekerci, M. Asian J Chem. 2009, 21(9), 6939-6944. [ Links ]
21. Borras, E.; Alzuet, G.; Borras, J.; Server-Carrio, J.; Castineiras, A.; Liu-Gonzalez, M.; Sanz-Ruiz, F. Polyhedron 2000, 19, 18591866. [ Links ]
22. Abu-El-Wafa, S.M.; El-Wakiel, N. A.; Issa, R. M. and Mansour, R. A. J Coord Chem. 2005,58, 683-694. [ Links ]
23. Liu, Y.; Yang, Z. Eur. J. Med. Chem. 2009, 44, 5080-5089. [ Links ]
24. Sharma, A. L.; Singh, I. O.; Singh, M. A.; Singh, H. R.; Kadam, R. M.; Bhide, M. K.; Sastry, M. D.Transit Metal Chem. 2001, 26, 532-537. [ Links ]
25. Dutta, R. L.; Syamal, A. Elements of Magnetochemistry, 2nd Edn, E.W. Press, New Delhi, 1993. [ Links ]
26. Öztürk, Ö. F.; Cansiz, A.; Koparir, M. Transit Metal Chem. 2007, 32, 224-227. [ Links ]
27. Borras, E.; Alzuet, G.; Borras, J.; Serevr-Carrio, J.; Castineiras, A.; Liu-Gonzalez, M.; Sanz-Ruiz, F. Polyhedron. 2000, 19, 1859-1866. [ Links ]
28. Cohan, Z. H.; Pervez, H.; Rauf, A.; Scozzafava, A.; Supuran, C. T. J Enzym Inhib Med Ch. 2002, 17(2), 117-122. [ Links ]
29. Turan, N.; Sekerci, M. Spectrosc Lett, 2009, 42, 258-267. [ Links ]
30. Abdel-Latif, S. A.; Hassib, H. B.; Issa, Y. M. Spectrochim. Acta Part A 2007, 67, 950-957. [ Links ]
31. Yilmaz, V. T.; Hamamci, S.; Andac, Ö. TransitMetal Chem. 2003, 28, 676-681. [ Links ]
32. Turan, N.; Sekerci, M. Heteroatom Chem. 2010, 21(1), 14-23. [ Links ]
33. Esener, H.; Adigüzel, R.; Ergin, Z.; Aktan, E.; Turan N.; Sekerci, M. Adv. Sci. Lett. 2011,4(3), 3669-3675. [ Links ]
34. Ilhan, S.; Temel, H.; Yilmaz, I.; Sekerci, M. Polyhedron 2007, 26,2795-2802. [ Links ]
35. El-Zaiat, S.Y. Optik-International Journal for Light and Electron Optics. 2013,124, 157-161. [ Links ]
36. Abeles, F. Optical Properties of Solids, North-Holland Publishing Company-Amsterdam, London, 1972. [ Links ]
37. Kaya, E.; Turan, N.;Gündüz, B.; Colak, N.; Körkoca, H. Polym. Eng Sci. 2012, 52, 1581-1589. [ Links ]
38. Gunduz, B.; Yakuphanoglu, F. Sensors & Actuators, A. Physical. 2012,178, 141-153. [ Links ]
39. Chang, K. C.; Yeh, Y. C.; Lue, J. T.Measurement 2012, 45(4), 808-813. [ Links ]
40. Wakkad, M. M.; Shokr, E. K.; Mohamed, S. H. J. Non-Cryst. Solids 2000, 265, 157-166. [ Links ]
41. Taue, J. Optical Properties of Solids, in: Abeles F. Ed., North-Holland: Amsterdam, 1972. [ Links ]
42. Turan, N.; Kaya, E.; Gündüz, B.; Colak, N.; Körkoca, H. Fiber Polym. 2012, 13, 415-424. [ Links ]
43. Migahed, M. D.; Zidan, H. M. Curr. Appl. Phys. 2006, 6, 91-96. [ Links ]
44. Sadao, A. Optical Constants of Crystalline and Amorphous Semiconductors, Kluwer Academic Publishers, Boston, 1999. [ Links ]
45. Bhuiyan, E. H.; Pitman, G. P.; Azzouz, M. Physica C 2012, 473, 61-70. [ Links ]
46. Gündüz, B.; Çavas, M.; Yakuphanoglu, F. Quality Controlling of SiO2 Thin Films by sol gel method, 6th International Advanced Technologies Symposium (IATS'11), 16-18 May 2011, Elazig, Turkey(http://web.firat.edu.tr/iats/cd/subjects/Metallurgy&Material/MSM-118.pdf). [ Links ]
47. Gündüz, B.; Cavas, M.; Yakuphanoglu, F. Production of Al2O3 Thin films for FET and MOSFET Transistor Gate Applications, 6th International Advanced Technologies Symposium (IATS'11), 16-18 May 2011, Elazig, Turkey (http://web.firat.edu.tr/iats/cd/subjects/Metallurgy&Material/MSM-119.pdf). [ Links ]
48. Clinical and Laboratory Standarts Institute, "Performance Standards for Antimicrobial Disk Susceptibility Tests" 9th ed. Approved Standard M2-A9 CLSI, Wayne, 2006. [ Links ]
49. National Committee for Clinical Laboratory Standarts, "Performance standards for antimicrobial disk susceptibility tests" 7th ed. Approved Standart M2-A7 NCCLS, Wayne, 2000. [ Links ]

