


Servicios Personalizados
Revista
Articulo
 Inglés (pdf)
 Artículo en XML
 Referencias del artículo
 Enviar artículo por email
Indicadores
-
 Citado por SciELO
 -
 Accesos
Links relacionados
-
 Similares en
SciELO
Similares en
SciELO
Compartir

 Permalink
Journal of the Mexican Chemical Society
versión impresa ISSN 1870-249X
J. Mex. Chem. Soc vol.57 no.4 Ciudad de México oct./dic. 2013
Article
Understanding the Nature of the Manganese Hot Dip Phosphatizing Process of Steel
Gabriela Alvarado-Macías, Juan Carlos Fuentes-Aceituno,* Armando Salinas-Rodríguez, Francisco Javier Rodríguez-Varela
CINVESTAV-Saltillo, Av. Industria Metalúrgica No. 1062, Parque Industrial Ramos Arizpe, Ramos Arizpe, Coahuila. C.P. 25900, México. juan.fuentes@cinvestav.edu.mx.
Received May 10, 2013.
Accepted June 28, 2013.
Abstract
In this work, the phosphatizing process of steel is investigated using open circuit potential and Tafel curves as well as scanning electron microscopy and energy dispersive X-ray spectroscopy. The results reveal that a pH of 2.57 in the phosphatizing solution promotes the dissociation of phosphoric acid which assists the formation of the manganese tertiary salt (Mn3(PO4)2), which is deposited on the substrate. It was also observed that an increase in the temperature from 25 to 90°C and the presence of HNO3 as catalyst enhances the manganese phosphatizing kinetics. On the other hand, the generation of iron phosphates and oxides is predominant at a pH of 1 and 90°C. These observations are supported by species distribution and Pourbaix thermodynamic diagrams.
Key words: Tafel, Phosphatizing of Steel, Coatings, Pourbaix, Manganese.
Resumen
En este trabajo, el proceso de fosfatado de acero es investigado usando potencial de circuito abierto y curvas Tafel, así como microscopía electrónica de barrido y espectroscopia de energía dispersiva de rayos-X. Los resultados revelan que un pH de 2.57 en la solución de fosfatizado promueve la disociación del ácido fosfórico, que ayuda a la formación de la sal de fosfato de manganeso terciaria (Mn3(PO4)2), que se deposita sobre el sustrato. También se observó que un aumento en la temperatura desde 25 a 90°C y la presencia de HNO3 como catalizador mejora la cinética del fosfatizado de manganeso. Por otro parte, la generación de fosfatos de hierro y óxidos es predominante en un pH de 1 y 90°C. Estas observaciones son soportadas con diagramas termodinámicos de distribución de especies y diagramas de Pourbaix.
Palabras clave: Tafel, Fosfatizado de acero, Recubrimientos, Pour-baix, Manganeso.
Introduction
Hot dip phosphatizing is used as a surface treatment to produce coatings against corrosion on metallic surface. This process involves a topochemical reaction between a primary phosphate solution with a metal surface, promoting the precipitation of an insoluble tertiary salt. There are several types of phosphate coatings. Iron phosphate [1-3], zinc phosphate [4-6] and manganese phosphate are commonly employed for steel corrosion prevention. Manganese phosphate coating has the highest hardness of the three types of phosphate coatings and has superior corrosion and wear resistance [7]. However, little has been published on the fundamental mechanism of the manganese hot dip phosphatizing process of steel.
From a process control viewpoint, the composition of the phosphatizing solution determines the morphology and properties of the coating. The acidity of the bath (free (FA) and total acidity (TA)) as well as the ratio between them (R) must be maintained at an optimum level to obtain a uniform coating of good thickness. [8]
The conversion of soluble primary phosphates into insoluble tertiary phosphates occurs with the regeneration of phosphoric acid. Therefore, stable phosphatizing baths requires a certain amount of free phosphoric acid to suppress hydrolysis and to maintain an effective deposition rate. However, the presence of excess phosphoric acid, not only may retard the formation of the coating, but also lead to excessive loss of metal. In contrast, increasing the process temperature favors the precipitation of tertiary phosphates in short times.
Phosphatizing processes are usually catalyzed by the use of oxidizing agents or accelerators. For example, nitric acid (HNO3) increases the dissolution process and also it is helpful in avoiding the physical blocking of the substrate surface by hydrogen bubbles [9]. Although an increase in the concentration of accelerator promotes the formation of improved coatings, it has been observed that too high concentrations can cause passivation of the metal surface and therefore an inhibition of film growth [10].
The phosphatizing process has been studied by potentialtime curves. Gahli et al. proposed that the steel phosphatizing process proceeds in a sequence of four stages: dissolution of the substrate, amorphous precipitation, crystallization-growth, and crystal reorganization [11]. In contrast, Narayanan, observed five stages: (a) electrochemical attack, (b) amorphous precipitation (precipitation of very fine phosphate crystals) (c) dissolution of the base metal (d), crystallization-growth and (e) crystal reorganization [10].
Machu was the first to consider the phosphatizing as an electrochemical reaction and on this basis he found a way to explain the kinetics of the process [12]. The effects of oxidation and reduction reactions in the system as well as the influence of different surface pre-treatments applied to the metal prior to phosphatizing were also investigated [12].
Wulfson assumed that precipitation of insoluble tertiary phosphates occurs in the anodic regions of the metal. Therefore the presence of metal ions (manganese and iron) near the anodic areas is detrimental [13]. In contrast, Machu and other researchers suggest that the precipitation occurs only at the cathodic areas, where there is a significant change in pH due to reduction of hydrogen ions [11-13].
Krutikov, on the other hand, proposed that in the early stages coating formation, a thin film of phosphate precipitates at anodic sites which then become cathodic areas. The discharge of hydrogen ions at the cathodic sites leads to the formation of colloidal particles which cause the precipitation of tertiary phosphate crystals on the cathodic regions [14].
Gilbert suggested that during phosphatizing of steel in a bath containing nitrite as an accelerator, FeO can be produced at the metal-solution interface according to the following reactions [15]:

Finally, Saison found that during the first minutes of treatment in zinc phosphatizing baths, Fe is covered with a layer of Fe3(PO4)2*8H2O and δ-Fe2O3. This research suggests that the same type layer can be expected to be produced in all classic phosphatizing-passivating baths [16].
It appears therefore that there is not a reaction mechanism that represents the physical and chemical phenomena that occur during the process. This is mainly attributed to the complexity for studying a reaction mechanism in the presence of many chemical species, contained in the commercial solution, such as, carbonates, iron, catalysts, etc. Therefore in this work a synthetic phosphatizing solution prepared from metallic manganese and phosphoric acid was used to study the reaction mechanism of the steel phosphatizing using manganese solutions. Once this mechanism is fully understood the heterogeneous catalysis in this system can be studied in order to minimize the activation energy for the precipitation reaction on the steel and accelerating the process kinetics.
Results and Discussion
Thermodynamic Study
Pourbaix diagrams for the Mn-H3PO4 and Fe-H3PO4 water systems were constructed at 90°C in order to elucidate the most stable manganese and iron species, as well as the possible chemical and electrochemical reactions which take place during phosphatizing process. This temperature was selected since, according to Chao-Min et al. [7] A temperature of 90°C in this process promotes the precipitation of the tertiary manganese phosphate.
Figure 1a illustrates the Pourbaix diagram for the Mn-H3PO4-H2O system. It can be observed that an acid phospha-tizing solution containing soluble manganese (Mn2+) requires a pH around 2.5 at a potential range from -0.5 to 0.8 V vs SHE for promoting the precipitation of the tertiary manganese phosphate salt (Mn3(PO4)2). Furthermore, this manganese phosphate precipitation also occurs until a pH of 11.5 with a potential range from -1 to -0.3 V vs SHE. However it is worth to mention that under these alkaline pH and potential conditions, the manganese can be precipitated in the phosphatizing solution, which implies a decrease in the manganese phosphate coating on steel. On the other hand, Figure 1b represents the Pourbaix diagram for the Fe-H3PO4-H2O system. As can be seen, in acid solutions with pH from 0 to 4, metallic iron is oxidized to ferrous ion (Fe2+) while the protons of the acid solution are reduced simultaneously to molecular hydrogen (H2) according to the following reactions:


If the redox potential of the solution is increased to 0.4 V vs SHE at pH 2.5, the ferrous ion will be oxidized to the ferric phosphate salt as a predominating species:

Therefore, from a thermodynamic view point, the immersion of the steel in phosphatizing solutions with initial pHs below 2 will produce ferrous ion and ferric phosphate as predominating species. It is noteworthy that under these conditions it is not possible to produce the tertiary manganese phosphate (see Figure 1a), so the steel will be coated with ferric phosphate salts. The iron dissolution (steel corrosion) is an anodic electrochemical reaction (equation 3), that occurs simultaneously with the hydrogen evolution reaction (cathodic reaction, equation 4) during corrosion of steel. The H2 evolution reaction could produce an increase in the local interface pH above 2.5, due to the protons consumption; and according to the thermodynamic diagram shown in Figure 1a, the manganese phosphate precipitates and predominates.
These results suggest that the manganese phosphate precipitation on the steel surface can occur only if the steel-solution interface pH is above 2.5 at a potential range from -0.5 to 0.8 V vs SHE. However, it is still unclear why the manganese phosphate precipitates at this pH value. In a certain way it is indicative that the process is strongly influenced by the phosphoric acid speciation in the solution.
Figure 2 shows the phosphoric acid speciation diagram at 90°C. As can be seen, increasing the pH from 2 to 13, the acid is dissociated into three different species (H2PO4-, HPO4-2 and PO4-3). The H2PO4- is the predominating specie at pH values from 2 to 7. It is noteworthy that the dissociation to H2PO4- occurs at a pH very similar that the expected for the precipitation to manganese phosphate (see Figure 1a). Therefore, H2PO4- species predominance in the phosphatizing solution is necessary for precipitating the manganese tertiary salt. It is now possible to propose the following reaction scheme for this process step at pH 2.5. First, the dissociation of H3PO4 into H2PO4- takes place (equation 6), and finally the manganese in solution Mn2+ is precipitated (equation 7).


These results support the suggestion of Ghali and Narayanan [10, 11], the free acidity (H+) assists the manganese phosphate precipitation. This is true, however is not the only important factor, otherwise the H2PO4- dissociated species would be detrimental for accomplishing the tertiary manganese phosphate precipitation and, as it was mentioned before, this occurs at around a pH of 2.5.
Electrochemical study of the steel phosphatizing process using different solutions with and without manganese
Fig. 3a illustrates the Tafel curves recorded every 4 min during 20 min of immersion of tested samples in a phosphoric acid solution at 25 °C. The Tafel curves change as the steel corrosion proceeds, showing a displacement to positive potentials. As can be seen, the corrosion potential becomes less negative as the immersion time increases and increases from -498 mV vs Ag/AgCl to a value of -456 mV vs Ag/AgCl at the end of the experiment. This behavior is associated with the corrosion and passivation phenomena occurring on the steel. According the steel is being corroded; the production of iron oxide or phosphate passive layers takes place. The latter can be observed in the 20 min Tafel curve with Figure 1b, from this time the corrosion potential did not change anymore, indicating the passivation of the steel. Another interesting characteristic is the different magnitude of the steel dissolution current observed at 0 and 20 min. For example, at anodic potentials more positive than -440 mV vs Ag/AgCl, the current magnitude is lower at 20 min than at the beginning of the experiment. This observation confirms again the production of passive layers at 20 min, which have a lower electrical conductivity than the steel.

When the temperature of the acid solution was increased to 90 °C, the same phenomena (corrosion-passivation) were observed (Figure 3b). However, some differences in the steel corrosion potential at this temperature were observed. The steel corrosion potential was -456 mV vs Ag/AgCl at room temperature and 20 min of immersion (Figure 3a). In contrast, the steel corrosion in the same solution at 90 °C occurred at -422 mV vs Ag/AgCl (Figure 3b). Therefore, a temperature of 90°C causes a displacement of the Tafel curves to higher potentials than with 25°C. This behavior suggests faster corrosion-passivation kinetics in the steel at 90 °C. If the current magnitude for both temperatures is compared at an anodic potential of -390 mV vs Ag/AgCl, it is seen clearly that a lower current is produced at 90 °C than at 25 °C, indicating again the fastest passivation kinetics at 90 °C. This phenomenon can be a benefit for the phosphatizing process with manganese at 90 °C, where the corrosion and passivation kinetics of the steel is enhanced, promoting the manganese phosphate formation due to an increase in the associated interface pH.
Fig. 4 illustrates the Tafel curves obtained during the immersion of the steel sample in the same phosphoric acid solution but adding Mn to a concentration of 3.3 g/L and keeping the pH at 1.26 at 90 °C.

As can be seen, the initial Ecorr was -446 mV, which is less negative than the initial corrosion potential observed in the Mn-free solution a 90 °C (—454 mV, Figure 3b). This observation suggests that the production of a coating occurs faster in a solution with manganese. As the process proceeds the measured Tafel curves are displaced to less negative potentials and a decrease in the magnitude current in the anodic branch is also observed. As discussed before, this behavior indicates passivation of the steel. Comparing figures 3b and 4, it is clear that the Tafel curves are very similar, indicating that the coating produced at the largest immersion time are also similar, iron phosphates, according to Figure 1b.
Commercial phosphatizing solutions are usually accelerated using nitrates. Therefore, it was decided to evaluate the effect of pH of a phosphatizing solution containing 9.26 g/L H3PO4, 12.61 g/L HNO3 and 3.3 g/L Mn. The pH of this solution was adjusted using NaOH as required.
The Tafel curves for the immersion of the steel samples in this solution at a pH of 2.57 are shown in Fig. 5.

It is evident that, under these conditions the corrosion/passivation behavior of the steel samples change significantly:
a) The initial corrosion potential decreases to -576 mV.
b) The Tafel curves are displaced to less negative potentials.
c) The magnitudes of the currents in the anodic branch decrease much more rapidly.
d) According to Fig. 1a, these changes in the Tafel curves correspond to formation of a layer of a Mn-rich phosphate on the surface of the steel.
Fig. 6 presents the evolution of the open circuit potential (OCP vs time curves) for the manganese-phosphoric acid solutions with and without HNO3 at pH 1 (solutions C and E), and the manganese-phosphoric acid solution with HNO3 at pH 2.57 (solution F).

The effect of the pH of the accelerated phosphatizing solution on the OCP of the steel samples can be appreciated by comparing curves E and F. As can be seen, at pH = 2.57 the OCP initially exhibits a series of sharp drops which correspond to steel corrosion. This effect occurs very fast in the solution at pH=1 and cannot be clearly appreciated in curve E.
As the time increases, the potential is raised linearly due to the development of a surface film which evolves, finally a constant potential reading is observed denoting the presence of a passive film up to 40 minutes. As shown in Figure 6 at pH =1 (solution E), the potential-time curve exhibits oscillations that could be associated with the partial formation and dissolution of the surface layer. This type of behavior is observed up to 40 minutes and indicates that passivation of the substrate cannot be obtained under this pH condition.
The evolution of the OCP for the steel sample immersed in the non-accelerated solution at pH = 1.26 is similar to that observed for the accelerated solution at pH 2.57, in terms of steel corrosion at the beginning and passivation phenomenon at the end i.e. constant potential reading. However, the main difference observed is the longer time required i.e. 22 min approximately, to reach the passive condition, as shown by curve C in Fig. 6. It is also noteworthy that, in these cases, the surface passive layer formed at long times is stable and the OCP curve does not exhibit the oscillations observed in the accelerated solution at pH =1 (curve E in Fig. 6).
The different potentials, reached at long times are an indication of the different chemical composition of the surface layers formed in the different solutions. According with the results presented in Fig. 1b, the layer produced on the steel surface during immersion in an accelerated Mn-phosphatizing solution at pH=1 must be iron phosphate. However, increasing the pH to 2.57, the coating on the steel must be a Mn-phosphate (Fig. 1a). In contrast, in a non-accelerated solution at pH =1, the coating is composed mainly by iron oxides (Fig. 1a). These results clearly indicate that the presence of nitrates promotes an increase in the phosphatizing kinetics.
Microstructural characterization of the coatings formed on steel.
Figure 7 illustrates the morphology and local chemical composition of the coating developed after 5 minutes of immersion in an Mn-phosphatizing solution at 90 °C and pH=1. The micrograph shows the steel coated by an amorphous relatively uniform layer presenting some dispersed crystals with a cubic morphology (see Figure 7b). The chemical composition of the uniform, amorphous layer can be qualitatively appreciated in the EDXS-spectrogram shown in Figure 7a. The presence of Fe, P and O suggests an iron phosphate compound generated at the beginning of the phosphatizing process, which is consistent with the thermodynamic predictions shown in Figure 1b. The chemical composition of the cubic crystals reveals high contents of iron and oxygen (see Figure 7c) with a similar content of P as in Figure 7a, probably associated with the iron oxides. According to Figure 1b, the iron oxides can be produced at pHs above 4. This means that, at the beginning of the phosphatiz-ing process there was an increase of pH due to the hydrogen evolution reaction occurring as a result on the steel corrosion (equations 3 and 4).
The EDXS spectrogram shown in Figures 7a and 7c, suggested that the cubic crystals are predominantly δ-Fe2O3, while the uniform layer of the coating corresponds to an iron phosphate.
These results coincide with the findings reported by Saison [16], who observed the production of Fe3(PO4)2* 8H2O and δ-Fe2O3 layers during the first minutes of the steel phosphatizing treatment by immersion.
Figure 8 illustrates the morphological and chemical characteristics of the coating obtained on the surface of the steel sample after 40 minutes of immersion in the same accelerated Mn-phosphatizing solution at pH =1. As can be seen, the coating is now thicker, appears cracked and exhibits a more uniform composition corresponding to the iron phosphate already mentioned. It is noteworthy the absence of δ-Fe2O3 crystals on the coating surface. This observation suggests a change of the interface pH to acid values, promoting the redissolution of the iron oxide.
The results presented in Figures 7 and 8 suggest a possible mechanism to explain the formation of this type of coating on the steel surface. Initially, when the steel sample is immersed in an accelerated Mn-phosphatizing solution at a pH =1 iron corrosion proceeds simultaneously with the hydrogen evolution reaction (equations 3 and 4). This process causes that the ferrous ion at the steel-solution interface precipitates as ferric phosphate (equation 5). The excessive production of hydrogen at this interface modifies the pH to a value of at least 4. Under this condition the iron in solution can be transformed to ferric oxide crystals (Figure 7). As the process progresses, the ferric phosphate layer increases in thickness and become more uniform. As a result, the hydrogen evolution reaction is diminished and protons in solution diffuse from the bulk to the solid interface and cause a decrease of the interface pH below 4. Under these new conditions the ferric oxide is not stable anymore and is redissolved in the solution, or transformed to ferric phosphate (Figure 8).
According to the Pourbaix diagrams shown in Figure 1a, the manganese phosphate predominates at pH > 2.5. It is therefore curious manganese phosphate crystals were not observed on the coatings shown in Figures 7 and 8. Probably this pH condition was not maintained during the immersion experiment, promoting inhibition of the tertiary manganese phosphate precipitation.
When the pH of the accelerated Mn-phosphatizing solution is increased to 2.57, the morphology of the coating produced on the steel surface changes dramatically. In this case, a nonuniform layer of manganese phosphate crystals is formed (Fig. 9). This change is in good agreement with the thermodynamic analysis performed using the Pourbaix diagram given in Figure 1a. The observed morphology of the crystals suggests, from a mechanistic point of view, that the manganese phosphate crystal formation takes place on cathodic zones where the electrochemical reduction of hydrogen ions occurs. The free regions observed in Fig. 9 correspond to anodic zones, where the electrochemical oxidation of iron proceeds. These observations suggest that the manganese phosphate coating formation on steel follows the same mechanism proposed by Machu [12] for the Zn-phosphatizing of steel.
Finally, Figure 10 illustrates a close up of Figure 9. From this micrograph it is observed that the manganese phosphate crystals are composed by clusters of smaller crystals. These crystals are surrounded by anodic zones where the steel dissolution takes place. Furthermore, the anodic zones are coated by a thin layer of iron phosphates.
Conclusions
According to the present results, the pH of the phosphatizing solution controls the formation of the manganese phosphate coating on the steel. The thermodynamic and characterization studies, demonstrated that a pH of 2.57 in the phosphatizing solution promotes the dissociation of phosphoric acid which assists the formation of the manganese tertiary salt (Mn3PO4)2), which is deposited on the substrate. Furthermore, it was found that at a pH of about 1, the generation of iron phosphates and oxides is predominant.
Besides the pH, it was found that increasing the bath temperature to 90 °C as well as the presence of nitrates enhance the formation kinetics of the coating.
Experimental Section
The working electrodes employed in this study were prepared as follows: samples of 10 mm and 0.8 mm in diameter and thickness respectively, were obtained from steel with the chemical composition given in Table 1, and it was mounted in a Teflon support using silver paint connected to a copper wire as a conductor. Experimental work was divided in three main sections: thermodynamic study, electrochemical study and characterization of the coatings.

Thermodynamic Study
Speciation diagrams for aqueous H3PO4 and Pourbaix diagrams for the Mn-P-H2O and Fe-P-H2O systems were elaborated at 90 °C using the HSC Chemistry 6.1 Software, in order to determine the effect of potential and pH on the predominant species in the phosphatizing bath. These calculations allowed establishing the theoretical optimal conditions for carrying out the manganese phosphate coating on steel.
Electrochemical Study
Pre-treatment of the substrate surface The steel samples were conditioned in different ways to be used later in the electrochemical tests: OCP and linear polarization (Tafel curves) using the following procedures:
Samples tested were polished to a mirror like finish. Initially, samples were ground on SiC paper of various grain sizes followed by a polishing with Al2O3 powder of 0.1 microns and then washed with alcohol. Finally, the samples were glued to a Teflon support using silver paint. Some samples without any prior surface conditioning were also placed in the Teflon support.
Finally, some of the polished and unpolished samples were pickled in a solution of 20% HCl at 80 °C during 1 min and then rinsed with distilled water. All samples after pre-treatment were immediately phosphatized by immersion in different phosphatizing solutions.
Phosphatizing process
Different phosphatizing solutions were tested, varying the concentrations of H3PO4 and Mn with and without the presence of catalyst (HNO3) at temperatures of 25 and 90 °C. Table 2 shows in detail the conditions of the various solutions studied:
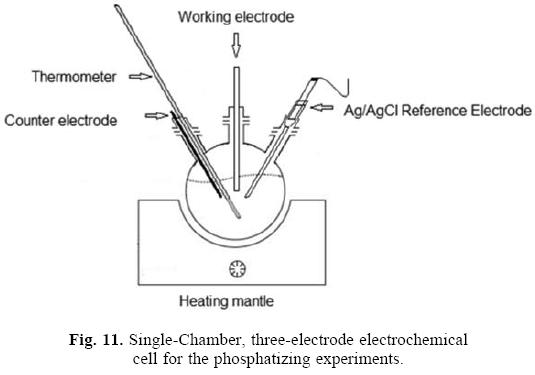
Phosphatizing tests were carried out in a conventional three electrodes electrochemical cell (see Figure 11). The cell consisted of a 250 mL round-bottomed flask, instrumented with a thermometer, a Ag/AgCl reference electrode (ThermoScientific Orion) in contact with the solution through a Luggin capillary, a high purity graphite rod (Alfa Aesar) as a counter electrode and a port to place the working electrode (steel sample). The electrochemical cell was placed in a heating mantle.
The procedure used to study the phosphatizing process was as follows: the prepared phosphatizing solution was placed (2QQ mL) in the electrochemical cell (Figure 11), then the solution was heated to the desired temperature (2S or 9Q 0C), once the thermal equilibrium was reached, the working electrode was introduced (steel sample) and connected to the potentiostat PGZ3Q1 (VoltaLab). Open Circuit Potential (OCP) measurements were carried out to follow the evolution of the coating and also linear polarization tests were performed to determine the change in corrosion potential during the sample phospha-tizing time (S to 4Q minutes). At the end, the phosphatized steel sample was withdrawn (working electrode), rinsed with distilled water and then it was characterized by microscopy. The following sections describe the techniques of OCP, linear polarization and microstructural characterization used.
Measurement of the Open Circuit Potential (OCP) and corrosion potential (Ecorr) during the phosphatizing process
The measurements of OCP and Ecorr of steel during the phos-phatizing process were performed at various temperatures using the experimental setup described in the previous section. For accomplishing this, the following two electrochemical techniques were used:
OCP measurement technique: This technique consists in following the change in the open circuit potential of steel during the phosphatizing process. It is important to note that these OCP vs. time curves relate the kinetic-passivation phenomena as well as the coverage degree of the coatings formed during the treatment. Thus these curves are an important parameter for determining the stages of corrosion (electrochemical attack of the steel) and the passivation time of the process.
Ecorr measurement technique: Polarization curves were performed, sweeping the potential linearly at 10mV/s from -700 mV to 50 mV vs Ag/AgCl at different temperatures. The polarization curves were carried out every 4 min during 20 min of experimentation. Then data obtained from E vs. i (current vs. potential) curves were converted to E vs log i, better known as Tafel curves. The Ecorr was calculated in the different acid solutions H3PO4 using the VoltaMaster software.
Chemical and morphological characterization of the resulting coatings
The qualitative chemical composition and morphology of the coatings were examined by SEM (Phillips, Model: XL30ESEM) taking secondary electron images and backscattered electrons. The determination of the local chemical composition in selected areas of the coatings was carried out by EDXS (EDAX, Model: Genesis).
Acknowledgements
Gabriela Alvarado Macías is grateful to CONACyT (México) for the postgraduate scholarship received. Also, the collaboration of Felipe Márquez, Socorro García and Teodoro Caballero in this investigation is duly recognized.
References
1. Gruss, B. Metal Finishing 2010, 108, 11-12: 33-37. [ Links ]
2. Breur, H. J. A.; de Wit, J. H. W., et al., Electrochimica Acta 2002, 47, 13-14: 2289-2295. [ Links ]
3. Popic, J. P.; Jegdic, B. V., et al., Applied Surface Science 2011, 257(24): 10855-10862. [ Links ]
4. Donofrio, J. Metal Finishing 2010, 108, 11-12: 40-56 [ Links ]
5. Valanezhad, A.; Tsuru, K. Surface and Coatings Technology 2010, 205, 2538-2541. [ Links ]
6. Zhang, S.; Zhang, X. J. Rare Earths 2008, 26, 1: 110-114. [ Links ]
7. Chao-Min, W.; Han-Chih, L.; Wen-Ta, T. Surface and Coating Technology 2006, 201, 2994. [ Links ]
8. Rausch, W. The phosphating of metals 1° Ed., ASM International, 1990. [ Links ]
9. Hivart, P.; Hauw, B.; Bricout, J.P.; Oudin, J. Tribology International 1997, 30, 8, 56. [ Links ]
10. Sankara Narayanan, T.S.N. Rev. Adv. Mater. Sci. 2005, 9, 130. [ Links ]
11. Ghali, E. L.; Potvin, J.A. Corrosion Science 1972, 12, 583. [ Links ]
12. Machu, W. Die Phosphatierung Verlag-Chemie, Weinnharin, 1950. [ Links ]
13. Rabinovich, W.; Korrosiva IBorbasnei 1937, 3, 363. [ Links ]
14. Krutikov, A.F.; Zh. Prikl. Khim. 1964, 37, 1462-5. [ Links ]
15. Gilbert, L. O. Proc. Am. Electropl. Soc. 1957, 44, 73-78. [ Links ]
16. Saison Jacques, Thése, Paris, Série Ano, d'ordre, 1962, 4675. [ Links ]

