


![Electrochemical Study of the Complex [Cu(pdto)(H2O)]2+ (pdto =1,8-bis(2-pyridyl)-3,6-dithiaoctane) in the Presence of the Superoxide. Toward an Electrochemical Method to Measure SOD Activity](/img/en/next.gif)


Services on Demand
Journal
Article
 English (pdf)
 Article in xml format
 Article references
 Send this article by e-mail
Indicators
-
 Cited by SciELO
 -
 Access statistics
Related links
-
 Similars in
SciELO
Similars in
SciELO
Share

 Permalink
Journal of the Mexican Chemical Society
Print version ISSN 1870-249X
J. Mex. Chem. Soc vol.57 n.3 Ciudad de México Jul./Sep. 2013
Article
Binding of Oxovanadium(IV) Complexes to Blood Serum Albumins
Enoch Cobbina,1,2 Sameena Mehtab,1 Isabel Correia,1 Gisela Gonçalves,1 Isabel Tomaz,3 Isabel Cavaco,2 Tamás Jakusch,4 Eva Enyedi,5 Tamás Kiss,4,5 and João Costa Pessoa*1
1 Centro de Química Estrutural, Instituto Superior Técnico, Universidade Técnica de Lisboa, Av. Rovisco Pais 1, 1049-001 Lisboa, Portugal. Tel: +351 218419268. joao.pessoa@ist.utl.pt
2 Departamento de Química, Bioquímica e Farmácia, Universidade do Algarve, Campus de Gambelas, 8005-139 Faro, Portugal.
3 Centro de Ciências Moleculares e Materiais, Faculdade de Ciências da Universidade de Lisboa, Ed. C8, Campo Grande, Campo Grande, 1749-016 Lisboa. Portugal.
4 Department of Inorganic and Analytical Chemistry, University of Szeged, Dóm tér 7, Szeged H-6720, Hungary.
5 Institute of Structural Chemistry, Chemical Research Center, Hungarian Academy of Sciences, Pusztaszeri út 59-67, H-1025 Budapest, Hungary.
Received December 6, 2012
Accepted June 5, 2013
Abstract
In this work the binding of VIVO2+ and VIVO-complexes to serum albumins {human serum albumin (HSA), bovine serum albumin (BSA) and porcine serum albumin (PSA)} are studied using circular dichroism (CD), electron paramagnetic resonance (EPR) and visible absorption spectroscopy. The results confirm previous findings that VIVO2+ occupies at least two types of binding sites on albumin: 'the strong vanadium binding site' (designated by VBS1) and 'the weak vanadium binding sites' (designated by VBS2). VBS1 binds 1 mol equivalent of VIVO2+. On the other hand VBS2 correspond to binding of several mol equivalents of VIVO, and studies done with PSA in the presence of excess ZnII ions indicate that VSB2 corresponds to two distinct types of sites. The hyperfine coupling constant Az for VIVO2+ binding at VBS2 on HSA and BSA are all very similar (~168 × 10-4 cm -1) but differ slightly on PSA (~166 × 10-4 cm -1) due to differences in the binding sets. When (VIVO)-HSA systems are titrated with maltol ternary species of (maltol)m(VIVO)mHSA and (maltol)2m(VIVO)mHSA stoichiometry form which are clearly distinguishable from the binary (VIVO)-HSA system by the type and intensity of the CD spectra recorded. Changes are also observable in the intensity of the X-band EPR spectra, but not much in the hyperfine coupling constants Az, which are all in the range 166-167 × 10-4 cm -1. The results further demonstrate that the presence of maltol may enhance the binding of VIVO to albumin.
Key words: Oxovanadium(IV), Circular Dichroism, Electron Paramagnetic Resonance, maltol, human serum albumin, bovine serum albumin, porcine serum albumin.
Resumen
En este trabajo el enlace de VIVO2+ y los VIVO-complejos a albúminas séricas {albúmina sérica humana (HSA), albúmina sérica bovina (BSA) y la albúmina sérica porcina (PSA)} son estudiadas usando el dicroísmo circular (CD), la resonancia paramagnética electrónica (EPR) y la espectroscopia de absorción visible. Los resultados confirman hallazgos previos que el VIVO2+ ocupa al menos dos tipos de unión a la albúmina: 'un fuerte lugar de unión del vanadio' (designado por VBS1) y 'unos lugares débil de unión al vanadio' (designados por VBS2). VBS1 se une a 1 equivalente molar de VIVO2+. Por otra parte VBS2 corresponde a la unión de varios equivalentes molares de VIVO, y estudios hechos con PSA en presencia de exceso de iones de ZnII corresponden a dos distintos tipos de lugares. La constante de acoplamiento hiperfino Az para VIVO2+ unido a VBS2 en HSA y BSA son todas muy similares (~168 × 10-4 cm -1) pero difieren ligeramente en el PSA (~166 × 10-4 cm -1) debido a las diferencias en los lugares de enlace. Cuando los sistemas (VIVO)-HSA se valoraron con especies ternarias de maltol (maltol)m(VIVO)mHSA y (maltol)2m(VIVO)mHSA de forma estequiométrica las cuales son claramente distinguibles del sistema binario (VIVO)-HSA por el tipo y la intensidad del espectro de CD registrado. También se observa cambios en la intensidad de la banda-X del espectro de EPR, pero no tanto en la constante de acoplamiento hiperfino Az, que están todos en el rango de 166-167 × 10-4 cm -1. Los resultados demuestran además que la presencia del maltol puede mejorar el enlace de VIVO a la albúmina.
Palabras clave: Oxovanadium(IV), Circular Dichroism, Electron Paramagnetic Resonance, maltol, human serum albumin, bovine serum albumin, porcine serum albumin.
Introduction
The interactions of VIVO2+ with serum proteins are important to its pharmacokinetic properties. The studies carried out to investigate the significance of vanadium as well its compounds in biological systems have led to the discovery of its potential as a therapeutic agent. Many publications illustrate its insulin-mimetic [1, 2], anti-cancer [3-5], anti-parasitic [6, 7] anti-microbial [8, 9] and antispermicidal [10] actions. VIVO and its complexes show high potential for the treatment of type-2 diabetes, and prospective uses for other diseases [11-20].
It is believed that ligands such as maltol, dhp (Hdhp = 1,2-dimethyl-3-hydroxy-4(1H)-pyridinone, Scheme 1), picolinato, dipicolinato and acetylacetonato, may enhance the insulin mimetic properties of VIVO2+ [1, 12-20]. However, when VIVO2+ is administered as a complex, designated here as VIVO(carrier)n, it may undergo transformations in the gastrointestinal tract, through the circulation and finally in the tissues and cells [1, 19-26]. It was reported that the complex undergoes rapid dissociation at the site of absorption, both VIVO2+ and the carrier ligand following different pharmacokinetic pathways [1, 18-20]. Notwithstanding, many other studies have shown differences in activity between VIVO2+ administered as a salt (VIVOSO4) and as VIVO(carrier)n complexes (examples in Figure 1) [17, 18, 24, 26].


Albumin is the most abundant large globular protein in the blood serum of mammals and is important for several physiological functions [27, 28]. Albumin has multiple specific and non-specific binding sites where a large number of endogenous and exogenous substances bind. The composition of HSA, BSA and PSA are similar; however, there are some variations in the number and sequence of their amino acids [27]. Namely, HSA contains only one [29] tryptophan while both BSA and PSA contain two [27] each; due to this difference the molar absorptivity of the band at ~280 nm for HSA is about 20% lower than that of BSA.
Concerning metal ion binding, despite the lack of detailed structural information about the binding sites on human albumin, four sites have been described [30]: (1) the Amine Terminal Cu(II) and Ni(II) site, often designated by ATCUN is at the N-terminus, the primary binding site for CuII and NiII; [27, 30]; (2) the multi-metal binding site (MBS) which primarily binds ZnII and a few other +2 metal ions [30]; (3) site B which is the primary binding site for CdII but can also bind ZnII [30-32], and (4) the reduced thiol of Cys-34, which binds gold and platinum compounds [30, 33].
There are 14 conserved His residues in human, bovine and porcine albumins [31], but only three of them are located close enough to each other in space to provide a strong binding site for metal ions. An important difference between the three albumins is the ATCUN motif: (i) HSA has Asp-1, Ala-2, and His-3 at the N-terminus, (ii) BSA has Asp-1, Thr-2 and His-3, while (iii) PSA has His-3 substituted by Tyr-3. [27, 34] Other groups such as carboxylates and amides may also play roles in metal ion binding to albumin. It is considered that for BSA the primary binding site for CuII is also the 3 residues of its N-terminal site, while for PSA, although Cu-binding would be possible, data indicate it is elsewhere in the protein [30]. The positions of the CD bands and EPR parameters for CuII bound at the MBS suggest coordination and tetragonal binding geometry, and globally the the similarity of the several spectroscopic parameters between albumins suggest that the MBS has been mostly conserved during evolution.
Several studies have reported the binding of VIVO2+ to albumin [25, 34-39]. Chasteen and Francavilla identified two classes of binding sites on albumin: 'strong' and 'weak' [39]. The ATCUN motif was reported to be the VSB1 site and to bind 1 mol equivalent of VIVO2+ [27, 39]. The weak sites of VIVO2+ (VBS2) were considered to consist of a number of non-specific interactions that may involve carboxylate or imidazole side chains of amino acid residues [38, 39], and Chasteen reported at least five non-specific interactions [39].
Garribba et al. detected a dinuclear (VIVO)2HSA species by EPR at -150 °C [36]. The spin state of this species is 1, it is observed up to a VIVO:HSA ratio of 1:1 and the intensity of the spectrum is very low. At VIVO:HSA > 1 another type of EPR spectrum (spin 1/2) becomes predominant and no other distinct type of spectrum is observed up to a VIVO:HSA ratio of 8:1. Notwithstanding, the VIVO binding to amino acid side chains of the ATCUN motif, if occurring, differs from CuII binding to the same site. In studies with small oligopeptides, in the absence of a primary anchor donor group VIVO ions (similarly to CuII) are not able to induce the deprotonation of the amide groups [36, 40-42]; in fact the N-terminal amino group is a suitable anchor for CuII, but not for VIVO [40-45].
Sakurai & co-workers [34] compared the CD spectra of solutions containing BSA and VIVO2+ and of solutions containing iodoacetamide-BSA and VIVO2+. The non-detection of the positive CD band at 590 nm was considered to demonstrate the binding of VIVO to the thiolate of Cys34; the second binding site of CuII was also considered to be this thiolate donor [34]. However, this binding for CuII contradicts the results of Bal [31] and those of other groups [37, 38]. So, up to date, the actual groups that form the vanadium binding sites are not well known.
CD and EPR data showed that VIVO2+ occupies two types of binding sites in albumin, which compete not only with each other, but also with hydrolysis of the metal ion [37]. In one of the sites the resulting VIVO-HSA complex has a weak CD signal in the visible range and its X-band EPR spectrum may be easily measured. This was assigned to amino acid side chains of the ATCUN site. The other binding site showed stronger signals in the CD in the visible range and was assigned to the multi metal binding site (MBS) of HSA. However, the possibility of binding of at least 6 mol equivalents of VIVO to HSA suggests that the situation is more complex. Therefore, one of the objectives of this work is to clarify the nature of the VIVO2+ binding sites at HSA. For this purpose we also include here studies of the VIVO + BSA and VIVO + PSA systems.
Vanadium(IV) and its complexes of maltol have attracted much attention due to their anti-diabetic effects [1]. VIVO2+ is able to interact with maltol to form ternary species when bound to albumin, supporting the possibility of transport of VIVO2+ in blood plasma in the form of VIVO-HSA-maltol species. The ternary species formed may be of two types: (VIVOL2)n(HSA) or (VIVOL)n(HSA). The system has been studied by several groups [12-15, 37] some indicating the formation of (VIVOL)n(HSA), others the formation of (VIVOL2)n(HSA). In this work we also further study this system to clarify the type of VIVO-maltol-HSA species formed.
Experimental
Materials and preparation of solutions
The chemical reagents and albumins were used as received from the supplier without further purification.
Millipore® water was used for the preparation of the solutions and a HEPES buffer was used in most experiments (except RT EPR). The composition of the buffer designated as HEPES-S used was: 50 mM HEPES (Sigma-Aldrich), 25 mM carbonate added as NaHCO3 (Sigma-Aldrich), 1 mM phosphate added as NaH2PO4·H2O (Merck), and 0.20 mM KCl (Merck); the buffer was adjusted to pH 7.4 using conc. KOH and conc. HCl.
Fatted HSA (A1653, fHSA) and defatted HSA (A3782, dHSA), defatted BSA (A-7511, dBSA), fatted BSA (A3675, fBSA) and fatted PSA (A1830, fPSA) were purchased from Sigma-Aldrich. Maltol, and VIVOSO4 were also purchased form Sigma-Aldrich.
The molecular weight as well as the molar extinction coefficients used for the determination of albumin concentrations were: (1) 66.5 kDa; ε(278 nm) = 36850 M-1cm -1 for fatted HSA and defatted HSA [46-49] (2) defatted BSA (66,430 Da; ε280 = 44,300 M-1cm -1); and (3) fatted PSA (67,900 Da; ε280 = 45,600 M-1cm -1) [22, 36, 48]. These values were obtained from the indicated references and product information documents from Sigma.
Albumin solutions: The albumin solutions were prepared by dissolving the protein in HEPES-S buffer. The solutions were allowed to stand for at least 60 minutes to allow equilibration. During this period the solutions were gently swirled; strong agitation was never done. The concentrations were then determined by UV spectrophotometry. Argon was gently bubbled through all solutions prior to use to displace any oxygen that may be present, and these were kept and manipulated under the argon atmosphere inside a glove bag.
Metal ion solutions: with the exception of the VIVO stock solution {VIVO(ClO4)2}, prepared as described previously [50]. Degassed and stored under nitrogen atmosphere in closed glassware, all other metal ion solutions were freshly prepared by dissolving them in Millipore® water. The concentration of the stock VIVO(ClO4)2 solution was 9.90 mM.
Titrations: in all titrations the albumin solution was titrated by adding μL aliquots of the other compounds to obtain the desired molar ratios. The UV-Vis and CD spectra of the solutions were measured, and samples were taken and frozen at 77 K for EPR measurements.
Spectroscopic measurements
The visible absorption spectra of the solutions were recorded on a Perkin Elmer Lambda 35 UV/Vis spectrophotometer in the range 400 - 1000 nm with quartz Suprasil® cuvettes. The circular dichroism (CD) spectra of the solutions were recorded on a JASCO J-720 spectropolarimeter (JASCO, Hiroshima, Japan) using a red-sensitive photomultiplier (EXEL-308) in the visible region of the electromagnetic spectrum (400-1000 nm). Most of the CD recordings were done at ~25 ºC with a 50 mm quartz cell. One to three accumulations were made for each measurement. The CD spectra were obtained in mdeg units which were converted to ∆εvalues (in M-1 cm -1 units) based on the concentration of the albumin present. ∆εvalues may be positive or negative [51] and when it is stated that the CD signals increase or decrease, this corresponds to the |∆ε| values.
The X-band EPR (~9.46 GHz) spectra were measured either at room temperature (RT) or at liquid nitrogen (LN) temperature (77 K). The spectra at 77 K were recorded on a Bruker ESP 300E spectrometer. To improve the signal to noise ratio 10 scans were accumulated for each sample. The spectra acquisition parameters were constant for each batch of experiments. All measurements were done using 3 mm quartz tubes (Wilmad 707-SQ-250 M). The EPR samples contained 5% DMSO.
To facilitate the description of the composition of each solution we will often describe a solution that contains e.g. HSA and CuII in a 1:2 molar ratio by Cu2HSA, or a solution with BSA and VIVO in a 1:4 molar ratio by (VIVO)4BSA. In some occasions a similar designation will be used to specify a particular metal complex species. The designation VIVO2+ is used when referring to the VIVO(H2O)52+ or VIVO2+ as cations; the designation VIVO is used when referring to this unit in a complex species, e.g. (VIVO)4BSA.
Results and discussions
Binding sites of VIVO2+ on albumin
The visible CD spectra pattern of (VIVO)m-HSA complexes is shown in Figure 1 and Figure 2. The (VIVO)m-HSA complexes produce both negative and positive bands in the visible range of the CD spectrum. The positive bands are observed approximately between 520 and 730 nm with band 'maxima' (λmax) at ~588 nm, while the negative band appears between 730 nm and 1000 nm with λmax at ~832 nm. Another negative band is observed at λ < 520 nm.

Below 1 mol equivalent of VIVO2+ the CD signals are very low (Figure 1). This applies to both defatted and fatted HSA-VIVO complexes, but the intensity is significantly higher for the defatted (VIVO)m-HSA solutions. The intensity of the CD spectra globally increases upon addition of VIVO2+ up to VIVO:HSA molar ratios of 9 (Figure 2).
The d-d electronic transitions of (VIVO)m-HSA species is manifested in the CD spectrum in the visible range when it is coordinated by donor atoms where chirality is effectively transferred from the chiral centres of the protein to the VIVO centre [51-57]. Binding to donor groups of amino acid residues of albumin may thus result in the manifestation of d-d transitions in the visible CD spectrum [22, 31, 37]. Considering the many possible binding sites of VIVO2+ on albumin, each mol equivalent of VIVO2+ may produce a visible CD spectrum that may show some variations depending on the amino acid residues coordinating it and the environment of the site. What is measured is the sum of the CD signals corresponding to all complexes formed [50-57].
The zinc primary binding site (the MBS site) is at the interface of domains I and II of HSA. In the presence of fatty acids this site is disrupted, and the bound ZnII at this site decreases drastically in the presence of long chain fatty acids. This disruption is caused by a domain-domain movement that can be described as a rotation of domain I with respect to domain II [29-32]. As a general remark to the spectra of Figure 1 we may emphasize that the CD spectra measured with solutions containing dHSA and VIVO2+ are more intense than those with solutions containing fHSA and VIVO2+. This is an indication that some of the vanadium binding sites also involve residues of the MBS site, the measured |∆ε| values in the visible range being significantly lower in the case of fHSA-VIVO2+ solutions.
Figure 2 shows the changes in the visible CD spectra of titration of fHSA with 0.8-8.9 mol equivalents of VIVO2+. The measured CD spectra are the result of the sum of all CD bands present, some with ∆ε > 0, others with ∆ε < 0, due to the several chiral VIVO-complexes being formed. Therefore the resulting CD band pattern and its changes as VIVO is added may be complex.
Up to 0.88 mol equivalent of VIVO2+ added to the fHSA, the intensity of the CD signals are very low, but at ca. 830 nm the ∆ε are > 0. When > 1 mol equivalent of VIVO2+ have been added the CD signals at ca. 830 nm become negative and the |∆ε| values increase with VIVO2+ concentration. Chasteen, Orvig and Sanna [1, 26, 36, 39] obtained EPR spectra in agreement with VIVO2+ exhibiting two types of binding modes of which one is considered non-specific. Our group recently discussed metal competition studies of Cu(II) and Zn(II) as metal probes for VIVO2+ binding with HSA [37]. These studies confirmed the involvement of amino acid side chains of the ATCUN and MBS sites. In this work we also examine the metal competition studies of Cu(II) and Zn(II) as metal probes with VIVO2+ binding with BSA and PSA.
Studies with defatted BSA and VIVO2+
BSA, like HSA, was reported to have two binding sites for metals. One site is the MBS which is the principal binding site, while the second site is the site B or Cd2+ primary site [30]. The CD spectra in the visible range observed after titrating 0.45 mM of BSA (defatted) with increasing mol equivalents (0.6 to 4) of VIVO showed positive and negative features similar to (VIVO)mHSA CD spectra (Fig. 3b). Two main bands, positive (~588 nm) and negative (~832 nm), showed up which globally increase in intensity with increasing VIVO2+ concentration (Fig. 3a), but other CD bands are detected, e.g. at λ < 400 nm, at λmax ≈ 700 nm and at λmax > 950 nm. As for the HSA-VIVO system the CD band pattern is complex and changes upon addition of VIVOSO4. The type of spectra obtained at low VIVO:HSA molar ratios (up to 2:1) differ from those obtained at higher molar ratios, e.g. 4:1. Thus different sites are occupied as VIVO2+ is progressively added to the defatted BSA.
Yasui et al. [34] also observed positive CD with λmax at ~590 nm when 0.5 mM BSA was titrated with 0-1.5 mM VIVO2+ at pH of 7.4. However, the spectra they obtained do not coincide with those obtained here, and no measurements were made for λ > 800 nm.
As for the studies with fatted/defatted HSA and VIVO2+, the EPR spectra of the solutions of Figure 3 agree when simulated as consisting of two types of signals. The parameters of VIVO2+ occupying VBS2 are: Az = 167.6 × 10⁻⁴ cm -1 and gz = 1.940. The Az and gz values obtained for VIVO2+ binding to the VBS2 on BSA are close to those obtained for fatted/defatted HSA and VIVO2+, and agree with those reported by Orvig [1] and Sanna [36].
Incremental additions of ZnII ions to solutions containing 4 mol equiv of VIVO decrease the intensities of the bands at ~ 830 nm and ~588 nm (Figure SI-1). This means that Zn2+ displaces the VIVO-species responsible for the ~588 and ~830 nm bands. As Zn2+ binds to the MBS site of BSA, these VIVO-complexes were probably bound close to the MBS residues.

The EPR spectra shown in Figure 4 indicate that some VIVO2+ remained bound to dBSA when ZnII was added; in fact the VIVO EPR signals are still observable after addition of 3 mol equivalents of ZnII. Only one type of signal is observed in the three spectra, but the peaks decrease in intensity with the amount of ZnII added. At pH 7.4 the VIVO2+ displaced by Zn2+ either precipitates as VIVO(OH)2, or forms EPR-silent [(VIVO)(OH)5 -]n, or oxidizes to VV, and the VIVO EPR signal detected after addition of ZnII is thus not due to VIVO bound to the MBS site. This binding yields weak CD signals for λ > 520 nm and the EPR signals are either due to VIVO2+ bound to the ATCUN site (as suggested in [37]) and/or to VIVO2+ bound to other sites, e.g. accessible N-imidazole atoms of His residues or O-carboxylate atoms of Asp or Glu residues.

Studies with fatted PSA and VIVO2+
Further studies to determine the binding site on HSA were carried out with fatted PSA. PSA lacks His-3 residue which is required for the formation of the ATCUN motif, the primary binding site of CuII on HSA and BSA. As stated above and in the SI section, PSA differs from HSA and BSA in several aspects, namely the substitution of His-3 by Tyr-3. Thus the N-terminal strong CuII and NiII binding site (ATCUN) does not exist in PSA [27, 30, 34]. The MBS however is preserved in PSA [31]. PSA also has two more His residues than the 16 in both HSA and BSA. Additionally, PSA binds ZnII and CdII at the MBS site much more strongly than HSA and BSA [34].
The spectra shown in Figure 5 indicate that when VIVO2+ was progressively added to ~630 µM fatted PSA the CD band pattern obtained in the visible range totally differs from those of HSA and BSA, as is also emphasized in Figure 6. Two types of CD spectra may be considered. The first type forms, up to 1:1 (VIVO:PSA), two isodichroic points being observed: (i) at λ ≈ 638 nm and Δε ≈ -0.0074 M-1cm -1 and (ii) at λ = ~ 760 nm and Δε ≈-0.013 M-1cm -1. The second type of CD spectra involves at least two species: one forming up to 1:3 (VIVO:PSA) with a λmax at ≈525 nm and Δε ≈-0.07 M-1cm -1, and the remaining one at higher mol amounts of VIVO2+ (Figure 5), with increase of the |Δε| values of the bands at λ≈ 580 and 700 nm, decrease of the |Δε| values at ≈525 nm and shift to the red of the λmax of the band at ca. 850-900 nm. At least two isodichroic points are visible: (i) at λ = ~ 658 nm and Δε = ~ -0.07 M-1cm -1; and (ii) at λ ≈ 680 nm and Δε ≈-0.08 M-1cm -1.


Upon addition of 1 - 2 mol equivalents of ZnII to a solution with a VIVO2+:PSA molar ratio of 6:1 (Figure SI-2), the intensity of the bands at ~ 524 nm and ~ 590 nm decreased. However, it appears that ZnII does not interfere much with the sites responsible for the bands at 700 and 880 nm.

The (VIVO)mPSA (m = 1,2,6) EPR spectra depicted in Figure 7 show that the resonant field positions of all samples are the same even after addition of ZnII. This suggests that only one type of binding set is present [with spin Hamiltonian parameters: Az = 165.9×10⁻⁴ cm-1 and gz = 1.941}]. Note that if a 'strong site' similar to the one for HSA exists, it will not be readily observable in the X-band EPR spectrum at pH 7.4. The effect of ZnII on the binding of VIVO2+ to PSA may be seen by the decrease in intensity and linewidths of the EPR spectrum of the solution containing 3 mol equivalents of ZnII (1:6:3). This together with the decrease in intensities observed in some bands of the visible CD experiments show that ZnII partly displaces VIVO2+ from some of its sites, but in a way quite distinct from HSA or BSA. This also indirectly shows that the VIVO binding at HSA or BSA certainly also involves amino acid residues of the ATCUN site. Finally, the observation of rather strong EPR signals in solutions containing 1:6:3 (PSA: VIVO: ZnII) molar ratios, indicates that a significant amount of VIVO2+ ions are bound to sites other than the ATCUN (not present in PSA), or the MBS sites. These sites may be e.g. accessible N-imidazole atoms of His residues or O-carboxylate atoms of Asp or Glu residues, but the observation of rather strong CD signals due to this type of binding suggests that at least two protein donor atoms are bound to the VIVO centers at these sites. The presence of a 3rd type of site was previously suggested for CuII binding to PSA [31].

Judging from the EPR parameters in Table 1, the binding set of VIVO2+ in HSA and BSA are quite similar to each other, while those with PSA may differ slightly. Comparatively, the Az values of the VIVO-PSA species are slightly lower than the ~167 × 10-4 cm -1 obtained for VIVO2+ binding to HSA and BSA. The difference is small but significant. Thus it is probable that the binding of VIVO2+ in PSA at the VBS2 is not exactly the same as in HSA and BSA: the differences in spin-Hamiltonian parameters either reflect variations in the amino acid residues involved in the VIVO binding site on PSA and/or changes in their orientation.

Further studies to determine the binding site on HSA were carried out with fatted PSA.
Bal et al. [31] reported that titration of 0.67 mM PSA solution with CuII ions at pH 7.4 yielded only 'one' positive band between 500 and 800 nm: (i) at λmax ≈ 670 nm for ~1 mol equivalent of CuII added, and (ii) at λmax ≈ 650 nm for ~2 mol equivalent of CuII. Contrary to these findings we observed only one positive band between 500 and ~ 900 nm with λmax ≈ 650 nm when a 0.60 mM fPSA solution was titrated with either ~1 and ~2 mol equivalents of CuII solution (Figure SI-3). It is not clear why this was so. Positive bands also appeared below ca. 500 nm.

Yasui et al. [34] reported that upon titration of PSA with VIVO2+ they observed a positive band at 590 nm, but no figure was presented; when the resulting solution was titrated with a CuII solution a positive band at 690 nm developed. By implication, they attributed the band at 690 nm to CuII binding to its site on PSA [34]. These authors did not specify whether fatted or defatted PSA was used (presumably it was fatted PSA).
Our CD spectra were obtained with a red-sensitive photomultiplier, thus allowing recording the CD signal up to 1000 nm. When 0.60 mM fPSA was titrated with 0.5 to 5 mol equivalents of VIVO2+, four bands were observed in the 500-1000 nm region, Figure 8. The bands have λmax at ~525 nm (Δε < 0), ~590 nm (Δε > 0), ~700 nm (Δε < 0) and ~860 nm (Δε > 0). The appearance of the band at ~590 nm is in agreement with the ~590 nm band observed by Yasui et al. [34].

Considering the CD spectra depicted in Figure 8, it is predicted that the positive CD band at 500-800 nm for the Cu-PSA species may overlap with the (-, +, -) band pattern observed for the VIVO-PSA species. Hence, if to a solution containing PSA and CuII a solution containing VIVO2+ is added, changes will be observed in the CD spectra that will depend on the relative amount of CuII and VIVO and on the binding strength of CuII and VIVO to each binding site at PSA.
Addition of 1 and 2 mol equivalents of CuII to a solution 0.60 mM fPSA at pH 7.4 resulted in the appearance of CD spectra with λmax at ~650 nm (e.g. Figure 8, Figure 9 or Figure SI-3). Upon addition of incremental mol equivalents of VIVO2+, Figure 10, changes are observed. Namely the intensity of the Cu2PSA CD band decreased to about 50 % after addition of 1 mol equivalent of VIVO2+. Further additions of VIVO2+ resulted in further decrease in the intensity of the Cu2PSA band.

The decrease in intensity of the CD band due to the Cu-PSA species as VIVO2+ is added indicates the displacement of CuII from the MBS site of PSA. Also there is a shift in the λmax from 650 nm to ~690 nm as new species form, this being in agreement with the observation of Yasui et al. [34] who observed the appearance of the ~690 nm band after addition of CuII solution to solutions containing PSA and VIVO2+. However, it is clear that the CD signals recorded have contributions from several VIVO-PSA and CuII-PSA species, as may be inferred from Figure 9.
Figure 10a was obtained by subtracting the CD spectra of solutions containing PSA and CuII {at 2:1 Cu(II):PSA molar ratio} from those of the solutions containing PSA, CuII and incremental additions of VIVO2+ (Figure 9). This gives a 'measure' of the displacement of the Cu2+ ions from fPSA by the VIVO2+ added. When the experimental CD spectra shown in Figure 10 were subtracted from the corresponding sum of Cu2PSA and (VIVO)m-PSA (m = 1, 2, 3, 4, 5, 6), the spectra shown in Figure 10b were obtained. The patterns shown in Figure 10b resemble the spectra shown in Figure 5. This gives further proof that, besides substituting CuII at the MBS binding site, VIVO2+ appears to bind sites not previously occupied by CuII.
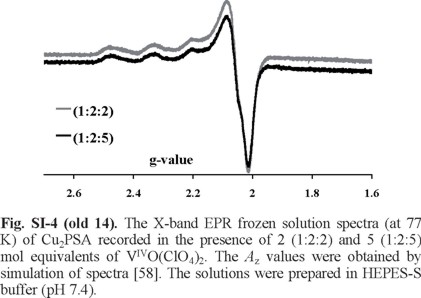
In Figure SI-4 apparently only the CuII spectrum with one resonant field position is observed in the X-band EPR spectrum of the frozen solutions containing Cu2HSA + VIVO2+ in the molar ratios indicated. The corresponding EPR parameters are: Az = 174.0 × 10⁻⁴ cm -1 and gz = 2.27. These values differ from those reported by Bal et al. [31] for CuII binding to PSA: (1) Az = 188 × 10-4 cm -1 and gz = 2.26 for a site designated as I, and (2) Az = 184 × 10-4 cm -1 and gz = 2.29 to site II (the MBS site). The EPR signals of VIVO-species are not clearly seen, although from the CD spectra it is clear that it partly displaced Cu2+ from PSA. A rather similar situation was also found in the case of the CuII-VIVO-HSA system [37]. This suggests that a significant part of the VIVO species bind HSA and PSA at these sites forming EPR-silent species (but active in CD).
(VIVO)mHSA interaction with maltol
To gain more insight into the possible interaction of VIVO2+ with maltol in blood plasma in circulation, studies were carried out by titrating VIVO2+-HSA complexes with BMOV and maltol, and monitoring the interaction by CD and EPR. Some of these results were reported recently [37].
When 0.67 mM (VIVO)0.9HSA (fatted) was titrated with 0.2-2.6 mole equivalents of maltol, the CD spectra depicted in Figure 11a were obtained. Very clear changes are seen in the CD spectra in the visible region upon addition of maltol, particularly in the 650-1000 nm range, but changes are also observed in the bands at λ < 650 nm. Other experiments but starting with different VIVO:HSA ratios are also shown in Figure 12. Globally the type of spectra recorded differ from those of solutions containing VIVO and HSA, clearly demonstrating that the coordination environment of VIVO2+ bound to HSA is modified when maltol is added to the system.
According to Orvig [1], when VIVO2+ is added to albumin as ions, the first mol equivalent binds VBS1 and further added moles of VIVO2+ bind the VBS2-type sites. This is in line with Sanna's report of the formation of multinuclear species when the VIVO2+/albumin ratio is > 1 [36]. Depending on the amount of VIVO2+ added to HSA, there may be several (VIVO)mHSA (m > 1) species available to interact with maltol, and at higher ratios of VIVO:HSA there will be a higher number of VIVO-centres available to interact with maltol, thus producing more intense CD spectra in the visible region. The system containing e.g. 1:3.5:10.5 (HSA: VIVO:maltol) will therefore have more intense CD signals in the visible region than its equivalent containing 1:1.8:5.3 (HSA: VIVO2+: maltol). However, for each type of chiral VIVO-species formed, the increase in its concentration will imply a proportional increase in the recorded |∆ε| values, but not in the pattern of the spectra. Thus, if changes are observed in the relative intensities of the CD bands, this means that distinct chiral VIVO-complexes are being formed [50-57].
Observation of the patterns of the CD bands in Figure 11 and Figure 12, namely the relative intensity of the bands at 530-590 nm and 750-800 nm, show the formation of at least two types of chiral species: (1) when the ratio of maltol:VIVO2+ < 1, and (2) when it is >1. In Figure 11b an isodichroic point is observed at λ ≈ 507 nm, Δε ≈-0.025 M-1cm -1 suggesting the existence of two distinct types of chiral species in equilibrium when the maltol:VIVO2+ ratio is <1. When the maltol/VIVO2+ ratio was increased further, e.g. Figure 11c and 11d, the type of CD spectra recorded continue to change suggesting the formation of a 3rd distinct type of chiral species. Figure 12 also illustrates the formation of these three distinct types of chiral VIVO-species.
Thus important information may be obtained from Figure 11 and Figure 12: (1) When maltol is added to (VIVO)mHSA complex new VIVO-HSA species form; (2) Distinct species form when the maltol:VIVO2+ ratio is <1 and when maltol:VIVO2+ ratio is ≥1; (3) Increasing concentration of maltol increased the intensity of the negative bands up to ~11 (band at ~570 nm) or ~14 mol equivalents (band at ~780 nm) of maltol; (4) The observed changes in the (VIVO)mHSA spectra upon addition of maltol suggests that maltol interacts with the VIVO-centers bound to HSA, and beside the initial (VIVO)mHSA species, complexes (maltol)m(VIVO)mHSA or (maltol)2m(VIVO)mHSA may form.
As demonstrated previously [37,38] and emphasized here, the CD and EPR spectra are compatible with the formation of at least two sets of species (possibly three) when HSA is titrated with VIVO2+. Moreover, the oligomeric forms of VIVO formed at VBS1, and possibly also at other sites are not easily observable in the X-band EPR spectrum at pH 7.4, hence its weak intensity, Figure 13. Upon addition of maltol, this binds to the VIVO centers, the intensity of the EPR signals increase significantly up to 1:2 (VIVO:maltol) molar ratio, but not much more after further additions of maltol. Moreover, the field positions do not change suggesting that the VIVO-maltol-HSA species formed correspond to identical binding sets, which is certainly not the case, because the type of CD spectra recorded changes.

As shown by the CD spectra, distinct species form when 0, 2.8, 8.3, 13.8 and 16.5 mol equivalents of maltol were added to e.g. 0.65 mM (VIVO)3.4HSA. However, Fig. 13 shows the presence of apparently only 'one species' for each spectrum. In fact, the corresponding EPR parameters of the species formed upon each addition of maltol (Table 2) do not show significant changes.
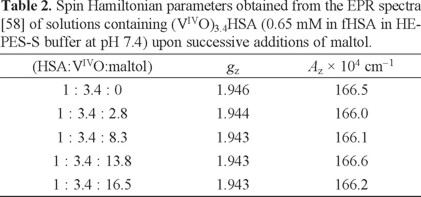
The EPR parameters reported by the group of Orvig for BMOV at pH 7.4 were Az = 171 × 10-4 cm -1 and gz = 1.938 [1]. Our measured values for BMOV are Az = 168.8 × 10⁻⁴cm -1 and gz = 1.940. Comparing the EPR parameters in Table 2 we may state that in the solutions studied the amount of BMOV formed, in any, is small. Thus, the possible stoichiometry of the species that may form are (maltol)m(VIVO)mHSA and (maltol)2m(VIVO)mHSA.
Orvig & coworkers [1] also reported the formation of (maltol)m(VIVO)mHSA ternary species when VIVO-HSA is titrated with maltol and they objected to the formation of BMOV and (maltol)2m(VIVO)mHSA. Kiss et al. [16] also indicated the formation of ternary albumin (maltol)m(VIVO)mHSA from their NMR relaxation dispersion measurements. Garribba [36, 38, 59] based mostly on EPR data indicated the formation of (maltol)2m(VIVO)mHSA, where the VIVO centers are bound to N-imidazole atoms of His residues. Our results indicate that both (maltol)m(VIVO)mHSA and (maltol)2m(VIVO)mHSA may exist in equilibrium, although species with a VIVO:maltol stoichiometry of 1:2 predominate (if enough maltol is present). The existence of both types of species: 1:1 and 1:2 (VIVO2+:maltol ratio) bound to HSA is indicated by the change of pattern of the CD spectra as maltol is added to the solutions containing VIVO2+ and HSA.
When the Az values of (maltol)m(VIVO)mHSA and (maltol)2m(VIVO)mHSA species are estimated from the possible available donor groups using the additivity rule [2, 60] , both types of binding sets are compatible with the experimental EPR data obtained considering (1) the variety of coordinating atoms available, namely N-imidazole, N-amine, O-amide and O-carboxylate, and (2) the possibility of forming distorted geometries. Indeed several types of binding sets may yield the same Az values. In conclusion, based on the previous publications and our present data we propose that in the (maltol)2m(VIVO)mHSA species the protein bounds to vanadium through the N-imidazole His side chains.
Conclusions
Reviewing the study of the interaction of VIVO with HSA, including the use of EPR and CD spectra, as well as metal competition studies with CuII and ZnII as metal probes, the results confirmed that at least two types of binding sites are present in HSA, more probably three distinct types of sites, which compete not only with each other, but also with hydrolysis of the metal ion. The systems are quite complex and the studies are particularly difficult with fatted albumins where conformational changes, induced by the binding of fatty acids, decrease the ability of VIVO to bind albumin, lowering the intensity of the CD and EPR spectra measured [37].
In one of the sites the resulting VIVO-HSA complex has a weak visible CD signal and its X-band EPR spectrum may be measured. This was assigned to amino acid side chains of the ATCUN site, but with a distinct binding set from that of Cu2+ [37]. The other binding site shows stronger signals in the CD in the visible range and was assigned to the multi metal binding site (MBS) of HSA. The CD and EPR data recorded with the PSA + VIVO2+ system (PSA does not contain the ATCUN site) in the presence of an excess of ZnII indicates that a 3rd type of site is present in PSA but probably also in HSA and BSA.
The EPR and CD studies carried out with the HSA-VIVO-maltol system indicate that at least two types of chiral VIVO-maltol complexes form with 1:1 and 1:2 VIVO:maltol stoichiometry, the (maltol)2m(VIVO)mHSA type species predominating if enough maltol is present in the solutions.
Not considering the probable binding to transferrin, if both VIVO2+ and maltol are present in circulating blood and if equilibrium conditions are achieved, VIVO2+ cations may be transported as HSA-VIVO-maltol species.
Acknowledgments
The work was supported by FEDER, Fundação para a Ciência e Tecnologia, the Ciencia 2007 programme, the Portuguese NMR Network (IST-UTL Center) and PEst-OE/QUI/UI0100/2011, SFRH/BPD/68789/2010, the European Commission for the Erasmus Mundus Master studentship within EMQAL 2008-095, the Hungarian National Research Fund (OTKA K77833), the Hungarian-Portuguese Bilateral Research Fund (TéT 09/2008). TJ thanks for the János Bolyai Research Scholarship of the Hungarian Academy of Sciences.
References
1. Liboiron, B. D.; Thompson, K. H.; Hanson, G. R.; Lam, E.; Aebischer, N.; Orvig, C. J. Am. Chem. Soc. 2005, 127, 5104-5115. [ Links ]
2. Rehder, D. Bioinorganic Vanadium Chemistry; John Wiley & Sons, Ltd: England, 2008. [ Links ]
3. Evangelou, A. M. Crit. Rev. Oncol. Hematol. 2002, 42, 249-265. [ Links ]
4. Papaioannou, A.; Manos, M.; Karkabounas, S.; Liasko, R.; Evangelou, A. M.; Correia, I.; Kalfakakou, V.; Costa Pessoa, J.; Kabanos, T. J. Inorg. Biochem. 2004, 98, 959-968. [ Links ]
5. Noblía, P.; Vieites, M.; Parajón-Costa, B. S.; Baran, E. J.; Cerecetto, H.; Draper, P.; González, M.; Piro, O. E.; Castellano, E. E.; Azqueta, A.; López de Ceráin, A.; Monge-Vega, A.; Gambino, D. J. Inorg. Biochem. 2005, 99, 443-451. [ Links ]
6. Benítez, J.; Guggeri, L.; Tomaz, I.; Costa Pessoa, J.; Moreno, V.; Lorenzo, J.; Avilés, F. X.; Garat, B.; Gambino, D. J. Inorg. Biochem. 2009, 103, 1386-1394. [ Links ]
7. Maurya, M. R.; Khan, A. A.; Azam, A.; Kumar, A.; Ranjan, S.; Mondal, N.; Costa Pessoa, J. Eur. J. Inorg. Chem. 2009, 5377-5390. [ Links ]
8. Shigeta, S.; Mori, S.; Yamase, T.; Yamamoto, N.; Yamamoto, N. Biomed. Pharmacother. 2006, 60, 211-219. [ Links ]
9. Maiti, A.; Ghosh, S. J. Inorg. Biochem. 1989, 36, 131-139. [ Links ]
10. Ghosh, P.; D'Cruz, O. J.; DuMez, D. D.; Peitersen, J.; Uckun, F. M. J. Inorg. Biochem. 1999, 75, 135-143. [ Links ]
11. Costa Pessoa, J..; Tomaz, I. Curr. Med. Chem. 2010, 17, 3701-3738. [ Links ]
12. Thompson, K. H.; Lichter, J.; LeBel, C.; Scaife, M. C.; McNeill, J. H.; Orvig, C. J. Inorg. Biochem. 2009, 103, 554-558. [ Links ]
13. Thompson, K. H.; McNeill, J. H.; Orvig, C. Chem. Rev. 1999, 99, 2561-2571. [ Links ]
14. Sakurai, H.; Kojima, Y.; Yoshikawa, Y.; Kawabe, K.; Yasui, H. Coord. Chem. Rev. 2002, 226 187-198. [ Links ]
15. Thompson, K. H.; Orvig, C. J. Chem. Soc., Dalton Trans. 2000, 2885-2892. [ Links ]
16. Kiss, T.; Jakusch, T.; Hollender, D.; Dörnyei, Á.; Enyedy, É. A.; Costa Pessoa, J.; Sakurai, H.; Sanz-Medel, A. Coord. Chem. Rev. 2008, 252, 1153-1162. [ Links ]
17. Passadouro, M.; Metelo, A. M.; Melão, A. S.; Pedro, J. R.; Faneca, H.; Carvalho, E.; Castro, M. M. C. A. J. Inorg. Biochem. 2010, 104, 987-992. [ Links ]
18. Metelo, A. M.; Pérez-Carro, R.; Castro, M. M. C. A.; López-Larrubia, P. J. Inorg. Biochem. 2012, 115, 44-49. [ Links ]
19. Willsky, G. R.; Chi, L. H.; Godzala, M.; Kostyniak, P. J.; Smee, J. J.; Trujillo, A. M.; Alfano, J. A.; Ding, W. J.; Hu, Z. H.; Crans, D. C. Coord. Chem. Rev. 2011, 255, 2258-2269. [ Links ]
20. Jakusch, T.; Costa Pessoa, J.; Kiss, T. Coord. Chem. Rev. 2011, 255, 2218-2226. [ Links ]
21. Nielsen, F. H. Metal Ions Biol. Syst. 1995, 31, 543-573. [ Links ]
22. Jakusch, T.; Hollender, D.; Enyedy, É. A.; González, C. S.; Montes-Bayón, M.; Sanz-Medel, A.; Costa Pessoa, J.; Tomaz, I.; Kiss, T. Dalton. Trans. 2009, 2428-2437. [ Links ]
23. Thompson, K. H.; Orvig, C. Coord. Chem. Rev. 2001, 1033, 219-221. [ Links ]
24. Heinemann, G.; Fichtl, B.; Vogt, W. Br. J. Clin. Pharmacol. 2003, 55, 241-245. [ Links ]
25. Yasui, H.; Takechi, K.; Sakurai, H. J. Inorg. Biochem. 2000, 78, 185-196. [ Links ]
26. Setyawati, I. A.; Thompson, K. H.; Yuen, V. G.; Sun, Y.; Battell, M.; Lyster, D. M.; C.Vo; Ruth, T. J.; Zeisler, S.; McNeill, J. H.; Orvig, C. J. Appl. Physiol. 1998, 84, 569-575. [ Links ]
27. Peters Jr, T. All about albumin: Biochemistry, Genetics, and Medical Applications; Academic Press: San Diego, California, 1996. [ Links ]
28. Murray, R. K.; Granner, D. K.; Mayes, P. A.; Rodwell, V. W. Harper's Illustrated Biochemistry; 26th ed.; McGraw-Hill USA, 2003. [ Links ]
29. Steinhardt, J.; Krijn, J.; Leidy, J. G. Biochem. 1971, 10, 4005-4015. [ Links ]
30. Blindauer, C. A.; Lu, J.; Stewart, A. J.; Sadler P. J.; Pinheiro, T. J. T. Biochem. Soc. T. 2008, 36, 1317-1321. [ Links ]
31. Bal, W.; Christodoulou, J.; Sadler P. J.; Tucker, A. J. Inorg. Biochem. 1998, 70, 33-39. [ Links ]
32. Sadler, P. J.; Stewart, A. J.; Blindauer, C. A.; Berezenko, S.; Sleep, D. P Natl. Acad. Sci. USA 2003, 100, 3701-3706. [ Links ]
33. Christodoulou, J.; Sadler, P. J.; Tucker, A. Eur. J. Biochem. 1994, 225, 363-368. [ Links ]
34. Yasui, H.; Kunori, Y.; Sakurai, H. Chem. Lett. 2003, 32, 1032-1033. [ Links ]
35. Kiss, T.; Jakusch, T.; Costa Pessoa J.; Tomaz, I. Coordin Chem Rev 2003, 237, 123-133. [ Links ]
36. Sanna, D.; Garribba, E.; Micera, G. J. Inorg. Biochem. 2009, 103, 648-655. [ Links ]
37. Correia, I.; Jakusch, T.; Cobbinna, E.; Mehtab, S.; Tomaz, I.; Nagy, N. V.; Rockenbauer, A.; Costa Pessoa, J.; Kiss, T. Dalton Trans. 2012, 41, 6477-6487. [ Links ]
38. Sanna, D.; Bíró, L.; Buglyó, P.; Micera, G.; Garribba, E. J. Inorg. Biochem. 2012, 115, 87-99. [ Links ]
39. Chasteen, N. D.; Francavilla, J. J. Phys. Chem. 1976, 80, 867-871. [ Links ]
40. Costa Pessoa, J.; Luz, S. M.; Gillard, R. D. J. Chem. Soc. Dalton Trans. 1997, 569-576. [ Links ]
41. Costa Pessoa, J.; Gagja, T.; Gillard, R. D.; Kiss, T.; Luz, S. M.; Moura, J. J. G.; Tomaz, I.; Telo, J. P.; Torok, I. J. Chem. Soc. Dalton Trans. 1998, 3587-3600. [ Links ]
42. Kiss, T.; Petrohán, K.; Buglyó, P.; Sanna, D.; Micera, G.; Costa Pessoa, J.; Madeira, C. Inorg. Chem. 1998, 37, 6389-6391. [ Links ]
43. Costa Pessoa, J.; Cavaco, I.; Correia, I.; Costa, D.; Henriques, R. T.; Gillard, R. D. Inorg. Chim. Acta 2000, 305, 7-13. [ Links ]
44. Costa Pessoa, J.; Tomaz, I.; Kiss, T.; Buglyó, P. J. Inorg. Biochem. 2001, 84, 259-270. [ Links ]
45. Costa Pessoa, J.; Tomaz, I.; Kiss, T.; Kiss, Buglyó, P. J. Biol. Inorg. Chem. 2002, 7, 225-240. [ Links ]
46. Hirayama, K.; Akashi, S.; Furuya, M.; Fukuhara, K. Biochem. Bioph. Res. Co. 1990, 173, 639-646. [ Links ]
47. Vellenga, L.; Wensing, T.; Egberts, H. J. A.; Dijk, J. E. V. Vet. Res. Commun. 1989, 13, 467-474. [ Links ]
48. Yuan, B.; Murayama, K.; Yan, H. Appl. Spectrosc. 2007, 61, 921-927. [ Links ]
49. Sanz-Medel, A.; Jakusch, T.; Hollender, D.; Enyedy, E. A.;. Gonzalez, C. S.; Montes-Bayon, M.; Costa Pessoa, J.; Tomaz, I.; Kiss, T. Dalton Trans. 2009, 2428-2437. [ Links ]
50. Costa Pessoa, J.; Vilas Boas, L. F.; Gillard, R. D.; Lancashire, R. Polyhedron 1988, 7, 1245-1262. [ Links ]
51. Costa Pessoa, J.; Correia, I.; Gonçalves, G.; Tomaz, I. J . Arg. Chem. Soc. 2009, 97, 151-165. [ Links ]
52. Costa Pessoa, J.; Vilas Boas, Gillard, L. F. R. D. Polyhedron 1989, 7, 1173-1199. [ Links ]
53. Costa Pessoa, J.; Marques, R. L.; Vilas Boas, L. F.; Gillard, R. D. Polyhedron 1990, 9, 81-99. [ Links ]
54. Costa Pessoa, J.; Vilas Boas, L. F.; Gillard, R. D. Polyhedron 1990, 9, 2101-2125. [ Links ]
55. Costa Pessoa, J.; Antunes, J. L.; Vilas Boas, L. F.; Gillard, R. D. Polyhedron 1992, 11, 1449-1461. [ Links ]
56. Costa Pessoa, J.; Luz, S. M.; Cavaco, I.; Gillard, R. D. Polyhedron 1994, 13, 3177-3198. [ Links ]
57. Costa Pessoa, J.; Luz, S. M., Gillard, R. D. Polyhedron 1995, 14, 1495-1515. [ Links ]
58. Rockenbauer, A.; Korecz, L. Appl. Magn. Res. 1996, 10, 29-43. [ Links ]
59. Garribba, E.; Sanna, D.; Micera, G. Inorg. Chem. 2010, 49, 174-187. [ Links ]
60. Chasteen, N.D.; in Biological Magnetic Resonance (Ed.: J. Reuben), Plenum, New York, 1981, p. 53-119. [ Links ]

