


Servicios Personalizados
Revista
Articulo
 Inglés (pdf)
 Artículo en XML
 Referencias del artículo
 Enviar artículo por email
Indicadores
-
 Citado por SciELO
 -
 Accesos
Links relacionados
-
 Similares en
SciELO
Similares en
SciELO
Compartir

 Permalink
Journal of the Mexican Chemical Society
versión impresa ISSN 1870-249X
J. Mex. Chem. Soc vol.57 no.1 Ciudad de México ene./mar. 2013
Article
QSPR/QSAR Studies of 2-Furylethylenes Using Bond-Level Quadratic Indices and Comparison with Other Computational Approaches
Eugenio R. Martínez Albelo,1,2 Yovani Marrero Ponce,2-4 Stephen J. Barigye,2 Yunaimy Echeverría-Díaz,2 and Facundo Pérez-Giménez4
1 Faculty of Chemistry-Pharmacy. Central University of Las Villas, Santa Clara, 54830, Villa Clara, Cuba. 53-42-281164. yovanimp@uclv.edu.cu
2 Unit of Computer-Aided Molecular 'Biosilico' Discovery and Bioinformatic Research (CAMD-BIR Unit), Faculty of Chemistry-Pharmacy. Central University of Las Villas, Santa Clara, 54830, Villa Clara, Cuba.
3 Institut Universitari de Ciència Molecular, Universitat de València, Edifici d'Instituts de Paterna, P.O. Box 22085, E-46071, València, Spain.
4 Unidad de Investigación de Diseño de Fármacos y Conectividad Molecular, Departamento de Química Física, Facultad de Farmacia, Universitat de València, Spain.
Received August 1, 2011.
Accepted April 1, 2013.
Abstract
The recently introduced, non-stochastic and stochastic quadratic indices (Marrero-Ponce et al. J. Comp. Aided Mol. Des. 2006, 20, 685-701) were applied to QSAR/QSPR studies of heteroatomic molecules. These novel bond-based molecular descriptors (MDs) were used for the prediction of the partition coefficient (log P), and the antibacterial activity of 34 derivatives of 2-furylethylenes. Two statistically significant QSPR models using non-stochastic and stochastic bond-based quadratic indices were obtained (R2 = 0.971, s = 0.137 and R2 = 0.986, s = 0.096). These models showed good stability to data variation in leave-one-out (LOO) cross-validation experiment (q2 = 0.9975, sCV = 0.164 and q2 = 0.947, sCV = 0.114). The best two discriminant models computed using the non-stochastic and stochastic molecular descriptors had globally good classification of 94.12% in the training set. The external prediction sets had accuracies of 100% in both cases. The comparison with other approaches (edge- and vertex-based connectivity indices, total and local spectral moments, quantum chemical descriptors as well as with other TOMOCOMD-CARDD MDs) revealed the good performance of our method in this QSPR study. The obtained results suggest that it is possible to obtain a good estimation of physical, chemical and physicochemical properties for organic compounds with the present approach.
Key words: TOMOCOMD-CARDD Software, non-Stochastic and Stochastic Bond-Based Quadratic Indices, Edge-Adjacency Matrix, Stochastic Matrix, QSPR/QSAR Model, 2-furylethylene.
Resumen
En el presente reporte, se aplican los índices cuadráticos de relaciones de enlace introducidos recientemente (Marrero-Ponce et al. J. Comp. Aided Mol. Des. 2006, 20, 685-701) en estudios QSAR/QSPR de moléculas heteroatómicas. Estos descriptores moleculares de tipo enlace son usados en la predicción del coeficiente de partición (log P) y la actividad antibacterial de 34 derivados de los 2-furiletilenos. Dos modelos QSPR estadísticamente significativos fueron obtenidos usando índices no estocásticos y estocásticos (R2 = 0.971, s = 0.137 y R2 = 0.986, s = 0.096, respectivamente) en la modelación del Log P. Estos modelos mostraron una estabilidad adecuada en la validación interna LOO (q2 = 0.9975, sCV = 0.164 and q2 = 0.947, sCV = 0.114, respectivamente). Por otro lado, los dos mejores modelos discriminantes muestran un porcentaje de exactitud global de 94.12% en la serie de entrenamiento y de 100% en la data de predicción en la modelación de actividad bactericida. Finalmente, la comparación con otros enfoques computacionales (índices de conectividad de enlace y de átomo tanto 2D como 3D, momentos espectrales totales y locales, descriptores químicos cuánticos al igual que con otros índices implementados en el programa TOMOCOMD-CARDD) evidencia un buen comportamiento de nuestros nuevos índices. Los resultados obtenidos sugieren que el método propuesto permite obtener una adecuada estimación de propiedades fisicoquímicas y biológicas de moléculas orgánicas.
Palabras clave: Programa TOMOCOMD-CARDD, índices cuadráticos de enlace, matriz de adyacencia de enlace, matriz estocástica, modelo QSPR/QSAR, 2-furiletileno.
Background
During the past decade, a great explosion of molecular descriptors (MDs) has been observed. For instance, topological indices (TIs), surface areas, volume descriptors, charges, and quantum-chemical measures have been extensively enhanced and used as whole molecule MDs [1-3]. However, local MDs have received very little attention [4]. One exception in this sense is the electrotopological state (E-state) index [5]. Other "global" MDs such as spectral moments of the edge-adjacency matrix have been redefined to their local form [4]. In this sense, in a manner similar to that for the atom- and atom-type level E-State, an E-State index for bonds and bond-type has been proposed. The bond-based E-State indices provided an improvement of 25% with regard to the atom-based E-State indices in the description of the boiling point of 372 alkanes, alcohols, and chloroalkanes [5].
The edge (bond)-adjacency relationships have also been used in the generation of new TIs [1-3]. Their matrix form has been considered and explicitly defined in the chemical graph theory literature, but has attracted little interest in both chemical and mathematical literature. Nevertheless, in the last decade Estrada rediscovered this matrix as an important source of graph theoretical invariants useful in the generation of new MDs [1]. For instance, first the edge-connectivity descriptor є was defined by this author using the Randić-type graph-theoretical invariant [6]. That is to say, this new index is analogous to the Randić branching index but calculated by edge degrees instead of vertex degrees. In a second work, Estrada also extended the edge adjacency matrix E for a molecular graph to a 3D-E matrix in order to generate the so-called topographic edge-connectivity index є(ρ) [7], also using the Randić-type graph-theoretical invariant. Later, this author used the same edge adjacency relationships in the generation of a new family of TIs, spectral moments of the E-matrix [7]. The analogous concept of spectral moments of vertex-adjacency matrix had also been previously discussed by different authors [8]. Afterward, Estrada et al. [9] introduced an extended set of edge connectivity indices, mєt(G), using the same way in which the Randić branching index was extended to the series of molecular connectivity indices. Finally, a novel graph theoretical polynomial, Pє(G,x), counting the edge connectivity was introduced by the same researcher [10]. Such edge-adjacency relationships will be applied in the present report in order to generate a series of bond-based MDs to be used in drug design and chemoinformatic studies.
Recently one of the present authors, Y.M-P, has introduced a new set of atom-level molecular descriptors of relevance to QSAR/QSPR studies and 'rational' drug design, non-stochastic and stochastic quadratic indices [qk( ) and sqk(), respectively] [11, 12]. These local (atom, group and atom-type) and total chemical indices are based on the calculation of quadratic maps in ℜn in canonical basis set. The description of the significance-interpretation and the comparison with other molecular descriptors was also performed [12]. This approach describes changes in the electronic distribution with time throughout the molecular backbone. Specifically, the features of the kth total and local quadratic indices were illustrated by examples involving various molecular structural changes, such as chain lengthening and branching as well as the inclusion of heteroatoms and multiple bonds [12]. Additionally, the linear independence of the atom-type quadratic fingerprints to other 0D-3D molecular descriptors was demonstrated. In this sense, it was concluded that local (atom-based) quadratic fingerprints are independent indices, which contain important structural information to be used in QSPR/QSAR and drug design studies [12].
These MDs are easily and quickly calculated, thus being suitable for both QSAR/QSPR modeling and drug design studies of large chemical databases. This -in silico- method has been successfully applied to the prediction of several physical, physicochemical and chemical properties of organic compounds [11, 12]. These atom-level MDs, and their stochastic forms [13, 14], have also been useful for the selection of novel subsystems of compounds having a desired property/activity. In this sense, it was successfully applied to the virtual (computational) screening of novel anthelmintic compounds, which were then synthesized and evaluated in vivo on Fasciola hepatica [15]. Studies for the fast-track discovery of novel antibacterial [16], paramphistomicide [13], antimalarial [14, 17], trichomonicidal [16], and tripanocidals [18] lead-like chemicals were also conducted with this theoretical approach. In addition, the atom-based quadratic indices have been extended to consider three-dimensional features of small/medium-sized molecules based on the trigonometric-3D-chirality-correction factor approach [19, 20]. This approach has also been successfully employed in QSAR and in silico ADME studies of Caco-2 Permeability of Drugs [21-23].
The main aim of this paper is test the correlation ability of the new MDs, calculated as quadratic maps similar to those defined in linear algebra, in QSPR/QSAR studies to examine the partition coefficient (log P), as well as the antibacterial activity of 34 derivatives of 2-furylethylenes.
Material and Methods
Dataset Selection for QSPR/QSAR studies
The decisive criterion of quality for any MDs is its ability to describe structure-related properties of molecules. The QSPR/QSAR models were developed to examine the partition coefficient (log P), as well as the antibacterial activity of 34 derivatives of 2-furylethylenes [4, 24].
The heteromolecule-based database consisting of 34 2-furylethylene derivatives (see Table 1), was recently studied by using total and local spectral moments, 2D/3D (vertex- and edge-) connectivity indices and two quantum-chemical descriptors [4, 24]. These chemicals have different substituents at position 5 of the furan ring, as well as at the β position of the exocyclic double bond [25]. The values of the n-octanol/water partition coefficient (log P) of these compounds have been experimentally determined and reported in the literature [25]. The antibacterial activity of these compounds was determined as the inverse of the concentration C that produces 50% of growth inhibition in E. coli at six different times and reported as log(1/C) [25]. This antibacterial activity was used to classify furylethylenes into two groups by Estrada and Molina [24]. The group of active compounds is composed of those substance having values of log(1/C) < 3, while the rest form the group of inactive molecules. In this study, we also took into account a series of nine new 2-furylethylenes, used by Estrada and Molina [24] as external prediction (test) set. These compounds have an NO2 group at position R3 and a Br or I at positions R1 and/or R2. All these compounds showed antibacterial activity in different assays [26].
Computational Strategies
The total and local (bond-type) bond-based quadratic indices used to search for the best regression of the selected physicochemical property of 2-furylethylenes were calculated by the TOMOCOMD-CARDD (acronym of TOpological MOlecular COMputational Design-Computer Aided "Rational" Drug Design) program [27]. This software is an interactive program for molecular design and bioinformatic research. The software was developed based on a user-friendly philosophy. That is to say, this computational program offers an interactive environment for the user and does not require prior programming skills. Computer Aided "Rational" Drug Design) subprogram allows drawing the structures (drawing mode) and calculating 2D (topologic), 3D-chiral (2.5D) and 3D (geometric and topographic) non-stochastic and stochastic MDs (calculation mode).
The bond–based TOMOCOMD-CARDD MDs computed in this study were the following:
1) kth (k = 15) total non-stochastic bond-based quadratic indices not considering and considering H-atoms in the molecular graph (G) [qk(
) and qkH(
2) kth (k = 15) total stochastic bond-based quadratic indices not considering and considering H-atoms in the molecular graph (G) [sqk(
3) kth (k = 15) group (heteroatoms: O, N, S and halogens) non-stochastic quadratic indices considering and non-considering –– H-atoms in the molecular graph (G) [qkLH(
) and qkL(
4) kth (k = 15) group (heteroatoms: O, N, S and halogens) stochastic quadratic indices considering and non-considering H-atoms in the molecular graph (G) [sqkLH(
5) kth (k = 15) bond-type (C2-C6) non-stochastic and stochastic quadratic indices considering H-atoms in the molecular graph (G) [qkLH(
6) kth (k = 15) bond-type (C2-C6) non-stochastic and stochastic quadratic indices not considering H-atoms in the molecular graph (G) [qkL(
7) kth (k = 15) bond-type (C6-C7) non-stochastic and stochastic quadratic indices considering H-atoms in the molecular graph (G) [qkLH(
8) kth (k = 15) bond-type (C6-C7) non-stochastic and stochastic quadratic indices not considering H-atoms in the molecular graph (G) [qkL(
Chemometric Analysis
These kth total and local bond-based quadratic indices were used as MDs for derived QSPRs. One of the difficulties with the large number of MDs is deciding which ones will provide the best regressions, considering both goodness of fit and the chemical meaning of the regression. In addition, as testing a large number of all possible combinations of variables would be a tedious task and time-consuming procedure, we have used a genetic algorithm (GA) input selection [28-35]. The GAs are a class of algorithms inspired by the process of biological evolution in which species having a high fitness under some conditions can prevail and survive to the next generation; the best species can be adapted by crossover and/or mutation in the search for better individuals.
The software BuildQSAR [36] was employed to perform variable selection and QSAR modeling. The mutation probability was specified as 35%. The size of the equations was set at three-four terms and a constant. The population size was established as 300. The GA with an initial population size of 300 rapidly converged (2000 generations) and reached an optimal QSAR model in a reasonable number of GA generations.
The search for the best model can be processed in terms of the highest correlation coefficient (R) or F-test equations (Fisher-ratio's p-level [p(F)]), and the lowest standard deviation equations (s) [36]. The quality of models was also determined by examining the Leave-One-Out (LOO) cross validation (CV) (q2, scv) [73]. In recent years, the LOO press statistics (e.g., q2) have been used as a means of indicating predictive ability. Many authors consider high q2 values (for instance, q2 > 0.5) as an indicator or even as the ultimate proof of the high predictive power of a QSAR model. The Hasse diagram technique may be used to rank the QSAR models in terms of their respective statistics [37].
On the other hand, linear discriminant analysis (LDA) was used in the classification of the 34 2-furylethylene derivatives according to their antibacterial activity. This statistical analysis was performed using STATISTICA software [38]. In order to test the quality of the discriminant function derived, we used the Wilk's λ (U-statistic) and the Mahalanobis distance (D2). The Wilk's λ statistic is helpful to evaluate the group discrimination and can take values between 0 (perfect discrimination) and 1 (no discrimination). The D2 indicates the separation of the respective groups. The statistical robustness and predictive power of the obtained model was assessed using an external prediction (test) set. In developing classification models the values of 1 and −1 were assigned to active and inactive compounds, respectively. To classify the compounds in both groups we preferred the use of the a posteriori probabilities instead of cutoff values. This is the probability that the respective case belongs to a particular group (active or inactive) and it is proportional to the Mahalanobis distance from that group centroid. The posterior probability is the probability, based on our knowledge of the values of other variables, that the respective case belongs to a particular group. An external test set of nine new compounds was used in order to assess the predictive ability of the obtained LDA model.
Applications in QSPR/QSAR Studies and Comparison with other Computacional Approaches
Modeling partition coefficients (log P) of 34 2-furylethylenes derivatives
The partition coefficient n-octanol/water (log P) has an important role in the understanding of the biological behavior of the 34 2-furylethylenes derivatives [25], specifically for the development of their antibacterial activity [26]. The values of the n-octanol/water log P of these compounds have been experimentally determined and reported in the literature [25]. This experiment offers the possibility of comparing the present results with those achieved by using some atom-based TOMOCOMD-CARDD MDs [12, 39]. The best obtained models together with their statistical parameters using bond-based (non-stochastic and stochastic) quadratic indices respectively are given below:
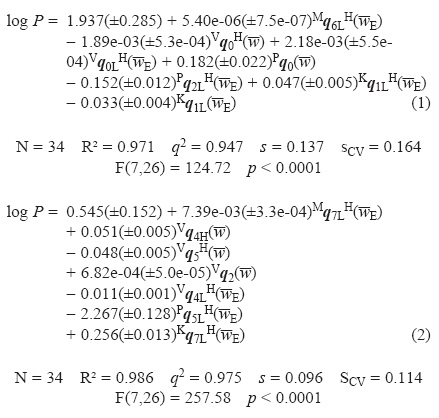
where, N is the number of compounds, R2 is the determination coefficient, s is the standard deviation of the regression, q2 (sCV) is the square regression coefficient (standard deviation) obtained from the LOO cross validation procedure, and F is the Fisher ratio.
These models show significant superiority from a statistic point of view with respect to other methods previously used for the same data set. Our models (non-stochastic and stochastic) explain 97.1% and 98.6% of the experimental variance of log P while the previous approaches describe less than 97% of the variance. In this sense, standard deviation between 0.142 and 0.319 were reported in previous studies while our models show the lowest values of standard deviation (s = 0.137 and s = 0.096 for Eqs. 1 and 2, correspondingly). In addition, the statistics for the LOO CV procedure, achieved by our models were in general better than those obtained by the other methods, for a detailed comparison see Table 2.
The values of experimental and calculated values of the Log P for the data set (both models) are given in Table 3. Plots of the linear relationship between the observed and calculated log P values for the data set of compounds are illustrated in Figure 1 and Figure 2.
Classifying 34 2-furylethylene derivatives as antibacterial
Finally, Linear Discriminant Analysis (LDA) is used to obtain classification models for the 2-furylethylene compounds according to their antibacterial activity. The classification models obtained are given below together with their statistical parameters:
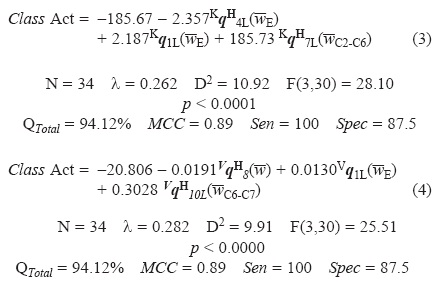
where, λ is Wilk's statistic, D2 is the squares of Mahalanobis distances, and F is the Fisher ratio, QTotal is the accuracy of the model for the training set, MCC is the Matthews' correlation coefficient, Sen and Spec are the sensibility and specificity of the model, respectively. The statistical analysis showed that there exists appropriate discriminatory power for differentiating between the two respective groups.
The non-stochastic model (Eq. 3), has an accuracy of 94.12% for the training set, misclassifying only 2 compounds of a total of 34. This model showed a high MCC of 0.89; MCC quantifies the strength of the linear relation between the molecular descriptors and the classifications, and it may often provide a much more balanced evaluation of the prediction than, for instance, the percentages (accuracy) [40]. Neverthe-less, the most important criterion, for the acceptance or not of a discriminant model, is based on the statistic for the external prediction set. The non-stochastic model showed an accuracy of 100% (MCC = 1.00) for the compounds in the test set.
A rather similar behavior was obtained with the stochastic quadratic indices (Eq. 4), but with a greater λ and a shorter Mahalanobis distance (λ = 0.282 D2 = 9.91). Quite similar results were shown by the model previously obtained with atom-based (non-stochastic and stochastic) bilinear indices and atom-based non stochastic linear indices, which as well as our model used three parameters. The model developed with atom-based non stochastic quadratic indices had similar statistical parameters, but it was obtained with five descriptors, however our indices showed better results than the models derived previously by Estrada and Molina, using 2D and 3D connectivity and quantum chemical descriptors; for a detailed comparison see Table 4. The overall accuracy of these models in both, training and external prediction sets achieved with all these approaches is shown in Table 5.
Concluding remarks
We have shown here that total and local bond-based quadratic indices are useful MDs for modeling physicochemical properties of heteroatomic-organic chemicals. The obtained QSPR/QSAR models for the description and prediction of log P of 34 2-furylethylene derivatives were statistically significant and better than those obtained previously using recognized methods, such as topological [total and local spectral moment and 2D (edge- and vertex-) connectivity indices], topographic and quantum chemical descriptors as well as some atom-level TOMOCOMD-CARDD MDs. This point is important because of the well-known broad applicability of these MDs in QSPR/QSAR studies. As a consequence, the bond-based quadratic indices represent a novel source for successful structure/activity-property models and drug design strategies.
Outlook
The development of more powerful MDs carries sustained interest in the drug discovery process. That is to say, although there have been many discoveries in the recent years in the field of theoretical drug-design it is necessary to continue developing new MDs that can represent, by means of QSAR (or similar theoretical works) studies, different physicochemical properties and biological activities of chemical substances. Therefore, our research group is working towards the definition of novel 2D/3D MDs based on algebra and group theory, geometric properties, discrete mathematics, etc. We are also interested in developing new (standard) rules and doubly stochastic indices.
Applications of these new bond (edge)-level MDs in molecular property/activity modeling, similarity/diversity analysis and biosilico drug discovery will be published in forthcoming papers.
Acknowledgments
One of the authors (M-P. Y) thanks the program 'Estades Temporals per a Investigadors Convidats' for a fellowship to work at Valencia University (2012). The authors acknowledge also the partial financial support from Spanish Ministry of Science and Innovation (MICINN, project reference: SAF2009-10399). Finally, but not least, this work was supported in part by VLIR (Vlaamse InterUniversitaire Raad, Flemish Interuniversity Council, Belgium) under the IUC Program VLIR-UCLV.
References
1. Todeschini, R.; Consonni, V. J. Chem. Inf. Comput. Sci. 2000. [ Links ]
2. Consonni, V.; Todeschini, R.; Pavan, M. J. Chem. Inf. Comput. Sci. 2002, 42, 682. [ Links ]
3. Seybold, P. G.; May, M.; Bagal, U.A. J. Chem. Ed. 1987, 64, 575. [ Links ]
4. Estrada, E.; Molina, E. J. Mol. Graphics Mod. 2001, 20, 54-64. [ Links ]
5. Kier, L. B.; Hall, L. H. Academic Press 1999. [ Links ]
6. Estrada, E. J. Chem. Inf. Comput. Sci. 1995, 35, 31. [ Links ]
7. Estrada, E.; Ramírez, A. J. Chem. Inf. Comput. Sci. 1996, 36, 837. [ Links ]
8. Marković, S.; Gutman, I. J. Mol. Struct. (Theochem) 1991, 235, 81. [ Links ]
9. Estrada, E.; Guevara, N.; Gutman I. J. Chem. Inf. Comput. Sci. 1998, 38, 428. [ Links ]
10. Estrada, E.; Rodríguez, L. J. Chem. Inf. Comput. Sci. 1999, 39, 1037. [ Links ]
11. Marrero-Ponce, Y. Molecules 2003, 8, 687-726. [ Links ]
12. Marrero-Ponce, Y. Bioorg. Med. Chem. 2004, 12, 6351. [ Links ]
13. Marrero-Ponce, Y.; Huesca-Guillen, A.; Ibarra-Velarde, F. J. Mol. Struct. (Theochem) 2005, 717, 67. [ Links ]
14. Marrero-Ponce, Y.; Medina-Marrero, R.; Torrens, F.; Martinez, Y.; Romero-Zaldivar, V.; Castro, E. A. Bioorg. Med. Chem. 2005, 13, 2881. [ Links ]
15. Marrero-Ponce, Y.; Castillo-Garit, J. A.; Olazabal, E.; Serrano, H. S.; Castañedo, N.; Ibarra-Velarde, F.; Huesca-Guillen, A.; Valle, A.; Torrens, F.; Castro, E. J. Comput.-Aided Mol. Design 2004, 18, 615. [ Links ]
16. Meneses-Marcel, A.; Marrero-Ponce, Y.; Machado-Tugores, Y.; Montero-Torres, A.; Montero Pereira, D.; Escario, J. A.; Nogal-Ruiz, J. J.; Ochoa, C.; Arán, V. J.; Martínez-Fernández, A. R.; García Sánchez, R. N. Bioorg. Med. Chem. Lett. 2005, 17, 3838. [ Links ]
17. Montero-Torres, A.; García-Sánchez, R. N.; Marrero-Ponce, Y.; Machado-Tugores, Y.; Nogal-Ruiz, J. J.; Martínez-Fernández, A. R.; Arán, V. J.; Ochoa, C.; Meneses-Marcel, A.; Torrens, F. J. Med. Chem. 2006, 41, 483-493. [ Links ]
18. Montero-Torres, A.; Celeste Vega, M.; Marrero-Ponce, Y.; Rolón, M.; Gómez-Barrio, A.; Escario, J. A.; Arán, V. J.; Martínez-Fernández, A. R.; Meneses-Marcel, A. Bioorg. Med. Chem. 2005, 13, 6264-6275. [ Links ]
19. Marrero-Ponce, Y.; Díaz, H. G.; Romero, V.; Torrens, F.; Castro, E. A. Bioorg. Med. Chem. 2004, 12, 5331. [ Links ]
20. Castillo-Garit, J. A.; Marrero-Ponce, Y.; Torrens, F. Bioorg. Med. Chem. 2006, 14, 2398-2408. [ Links ]
21. Marrero-Ponce, Y.; Cabrera, M. A.; Romero, V.; Ofori, E.; Montero, L. A. Int. J. Mol. Sci. 2003, 4, 512. [ Links ]
22. Marrero-Ponce, Y.; Cabrera, M. A.; Romero, V.; González, D. H.; Torrens, F. J. Pharm. Pharmaceut. Sci. 2004, 7, 186. [ Links ]
23. Marrero-Ponce, Y.; Cabrera, M. A.; Romero-Zaldivar, V.; Bermejo, M.; Siverio, D.; Torrens, F. J. Mol. Des. 2005, 4, 124. [ Links ]
24. Estrada, E.; Molina, E. J. Chem. Inf. Comput. Sci. 2001, 41, 791. [ Links ]
25. Balaz, S.; Sturdik, E.; Rosenberg, M.; Augustin, J.; Skara, B. J. Theor. Biol. 1988, 131, 115. [ Links ]
26. Blondeau, J.; Castañedo, N.; Gonzalez, O.; Medina, R.; Silveira, E. Antimicrob. Agents Chemother 1999, 11, 163. [ Links ]
27. Marrero-Ponce, Y.; Romero, V. Central University of Las Villas. Santa Clara, 2002. [ Links ]
28. Senese, C. L.; Hopfinger, A. J. J. Chem. Inf. Comput. Sci. 2003, 43, 1297. [ Links ]
29. Goldberg, D. E. Genetic Algorithms, Addison Wesley, MA, 1989. [ Links ]
30. Willet, P. Trends Biotechnol. 1995, 13, 516. [ Links ]
31. So, S. S.; Karplus, M. J. Med. Chem. 1996, 39, 1521. [ Links ]
32. So, S. S.; Karplus, M. J. Med. Chem. 1997, 40, 4347. [ Links ]
33. Rogers, D.; Hopfinger, A. J. J. Chem. Inf. Comput. Sci. 1994, 34, 854. [ Links ]
34. Hopfinger, A. J.; Wang, S.; Tokarski, J. S.; Jin, B.; Albuquerque, M.; Madhav, P. J. J. Am. Chem. Soc. 1997, 119, 10509. [ Links ]
35. Senese, C. L.; Hopfinger, A. J. J. Chem. Inf. Comput. Sci. 2003, 43, 2180. [ Links ]
36. De Oliveira, D. B.; Gaudio, A. C. Act. Relat. 2000, 19, 599. [ Links ]
37. Restrepo, G.; Basak, S. C.; Mills, D. Curr. Comput-Aid. Drug. 2011, 7, 109-121. [ Links ]
38. in: StatSoft (Ed.) STATISTICA version. 6.0, Tulsa, 2001. [ Links ]
39. Marrero-Ponce, Y.; Castillo-Garit, J. A.; Torrens, F.; Romero-Zaldivar, V.; Castro, E. Molecules 2004, 9, 1100-1123. [ Links ]
40. Penney, K. B.; Smith, C. J.; Allen, J. C. J. Invest. Dermatol. 1984, 82, 308-310. [ Links ]
41. Castillo-Garit, J. A.; Martinez-Santiago, O.; Marrero-Ponce, Y.; Casañola-Martín, G.; Torrens, F. Chem. Phys. Lett., 2008, 464, 107-112. [ Links ]

