


 nova página do texto(beta)
 Inglês (pdf)
 Artigo em XML
 Referências do artigo
 Enviar este artigo por email
 Citado por SciELO
  Similares em
SciELO
Similares em
SciELO 
 Permalink
I. Introduction
It is now over 23 years since NAFTA went into effect, bringing Mexico into a new commercial agreement with the United States and Canada. At the time it was argued, and forecast, that the agreement would boost Mexico’s growth and development.
This note compares the performance of the Mexican economy with that of the rest of the region since NAFTA, based on the available economic and social indicators, and with its own past economic performance. Among the results:
- Mexico ranks 15th among 20 Latin American countries in growth of real GDP per person from 1994 to 2016, the most basic economic measure of living standards.
- Mexico suffered a collapse of economic growth after 1980, with Latin American per capita GDP growing by just 9 percent, and Mexico by 13 percent, from 1980 to 2000.
- Mexico’s per capita GDP growth of just 1 percent annually over the past 23 years is significantly lower than the rate of growth of 1.4 percent achieved by the rest of Latin America.
- If NAFTA had been successful in restoring Mexico’s pre-1980 growth rate -when developmentalist economic policies were the norm- Mexico today would be a high income country, with income per person significantly higher than that of Portugal or Greece. It is unlikely that immigration reform would have become a major political issue in the United States, since relatively few Mexicans would seek to cross the border.
- According to Mexican national statistics, Mexico’s poverty rate of 55.1 percent in 2014 was higher than the poverty rate of 1994. As a result, there were about 20.5 million more Mexicans living below the poverty line as of 2014 (the latest data available) than in 1994.
- Elsewhere in Latin America there was a drop in poverty that was more than five times as much as that of Mexico: 21 percentage points (from 46 to 25 percent) for the rest of Latin America, versus 3.9 percentage points (from 45.1 to 41.2 percent) for Mexico.
- Real (inflation-adjusted) wages for Mexico were almost the same in 2014 as in 1994, up just 4.1 percent over 20 years, and barely above their level in 1980.
- Unemployment in Mexico is 3.8 percent today, as compared to an average of 3.1 percent for 1990-94, and a low of 2.2 percent in 2000; these numbers seriously understate the true lack of jobs, but they do not show an improvement in the labor market during the NAFTA years.
- NAFTA also had a severe impact on agricultural employment, as US subsidized corn and other products wiped out family farmers in Mexico. From 1991 to 2007, 4.9 million Mexican family farmers were displaced; while seasonal labor in agro-export industries increased by about 3 million. This meant a net loss of 1.9 million jobs.
- The very poor performance of the Mexican economy contributed to a surge in emigration to the United States. From 1994 to 2000, the annual number of Mexicans emigrating to the United States soared by 79 percent. The number of Mexican-born residents living in the United States more than doubled from 4.5 million in 1990 to 9.4 million in 2000 and peaked at 12.6 million in 2009.
NAFTA was just one variable among others that could account for Mexico’s poor economic performance over the past 23 years. However, it appears to be related to other economic policy choices that have negatively affected the Mexican economy during this period. Mexico competes directly with China in the US market, where China accounts for 21 percent of US imports and Mexico accounts for 13.5 percent. This is a very tough competition for Mexico for a number of reasons. First, although there is no definitive wage data for China in the last few years, Mexico has had much higher wages than China for the vast majority of the post-NAFTA period. Second, China has generally had a commitment to a competitive exchange rate, in effect fixing this exchange rate against the dollar or (since 2005) a basket of currencies, at least until very recently. The Mexican Central Bank by contrast has, as the IMF notes, “a firm commitment to exchange rate flexibility.” The Mexican Central Bank’s form of rigid inflation targeting thus adds a large element of unpredictability to the exchange rate, which has a negative impact on foreign direct investment; foreign investors will find it difficult to know how much their assets or output will be worth internationally in the future.
China has other advantages that make it a formidable competitor for Mexico in the US market: the Chinese government controls most of the banking system in China, and can therefore ensure that its most important exporting firms have sufficient access to credit. In Mexico, by contrast, 70 percent of the banking system is not only private, but foreign-owned. The Chinese government also has an active industrial policy that enables it to help its exporting firms in various ways, and it spends vastly more on research and development -both in absolute terms and as a percentage of its economy.
NAFTA also increasingly tied Mexico to the US economy, at a time when the US economy was becoming dependent on growth driven by asset bubbles. As a result, Mexico suffered a recession when the stock market bubble burst in 2000-2002, and was one of the hardest-hit countries in the region during the US Great Recession, with a drop of 6.7 percent of GDP. The Mexican economy was even harder hit by the peso crisis in 1994-1995, losing 9.5 percent of GDP during the downturn; the crisis was triggered by the US Federal Reserve raising interest rates in 1994.
The vulnerability to developments in US financial markets continues. In May of 2013, after the US Federal Reserve announced a future “tapering” of its quantitative easing program (QE3), there were fears of a repeat of the 1994 peso crisis, and gross foreign portfolio inflows came to a sudden stop. The Mexican economy took a hit, with growth of 1.4 percent for the year. This was mostly because, as the IMF noted, “Mexico’s deep and liquid foreign exchange and domestic equity and sovereign bond markets can serve as an early port of call for global investors in episodes of financial turbulence and hence are susceptible to risks of contagion.” This vulnerability is also a result of the policies that NAFTA was designed to facilitate. Moreover, the Mexican economy likely faces more risks as the Fed continues to raise US interest rates.
As was well known at the time of NAFTA’s passage, the main purpose of NAFTA was to lock in a set of economic policies, some of which were already well under way in the decade prior. These included the liberalization of manufacturing, of foreign investment, and of ownership, and other changes.1 The idea was that the continuation and expansion of these policies would allow Mexico to achieve efficiencies and economic progress that was not possible under the developmentalist, protectionist economic model that had prevailed in the decades before 1980. While some of the policy changes were undoubtedly necessary and/or positive, the final outcome has been decades of economic failure by almost any economic or social indicator. This is true whether we compare Mexico to its developmentalist past, or even if the comparison is to the rest of Latin America since NAFTA. After 23 years, these results should provoke more public discussion as to what went wrong.
II. Income and Growth
The North American Free Trade Agreement (NAFTA) went into effect in January 1994, bringing Mexico into a new commercial agreement with the United States and Canada. At the time it was argued, and forecast,2 that the agreement would boost Mexico’s growth and development. After 10 years of the agreement, the World Bank published a paper with an econometric analysis purporting to show that NAFTA had increased Mexico’s growth rate, at least relative to that of the United States.3 However, it turned out that this result was dependent on a data error.4
It is difficult to demonstrate unequivocally whether Mexico would have done worse in the absence of NAFTA, because many elements of the counterfactual are unknowable. However, one can compare the performance of the Mexican economy with that of the rest of the region since 1994 on the available economic and social indicators, and with its own past economic performance. Such a comparison follows, along with some analysis of possible explanations for Mexico’s poor performance.
Figure 1 shows the growth of income per capita in Mexico. This is the most basic measure of economic progress. As can be seen, per capita GDP has grown by just 28.7 percent, cumulatively, from 1994 through 2016. This is an average annual growth rate of just 1.2 percent, which is quite low compared with other countries in the region during this period.

Source: n.a., World Economic Outlook, October 2016, INTERNATIONAL MONETARY FUND, (2016), https://www.imf.org/external/pubs/ft/weo/2016/02/weodata/index.aspx
Figure 1 Mexico: Real GDP Per Capita in Thousands
Table 1 shows Mexico’s annual per capita GDP growth rate compared to the rest of Latin America (South America and Central America). Mexico’s growth ranks 15th of 20 countries. From these numbers, and in the absence of any natural disaster or war in Mexico during the past decades that could account for such poor economic performance, it would be difficult to argue that Mexico would have done much worse in the absence of NAFTA.
Table 1 Latin America: Average Annual Growth Per Capita 1994-2016
| 1 | Panama| | 4.0% |
| 2 | Peru | 3.2% |
| 3 | Chile | 3.0% |
| 4 | Guyana | 2.8% |
| 5 | Suriname | 2.6% |
| 6 | Costa Rica | 2.5% |
| 7 | Nicaragua | 2.5% |
| 8 | Bolivia | 2.3% |
| 9 | Uruguay | 2.3% |
| 10 | Colombia | 2.1% |
| 11 | El Salvador | 1.9% |
| 12 | Honduras | 1.9% |
| 13 | Paraguay | 1.4% |
| 14 | Ecuador | 1.4% |
| 15 | Mexico | 1.2% |
| 16 | Brazil | 1.1% |
| 17 | Argentina | 1.1% |
| 18 | Guatemala | 1.1% |
| 19 | Belize | 1.0% |
| 20 | Venezuela | -0.4% |
Source: n.a., World Economic Outlook, October 2016, International Monetary Fund, (2016), https://www.imf.org/external/pubs/ft/weo/2016/02/weodata/index.aspx.
It is worth comparing Mexico’s growth rate since NAFTA to that of its past, again in the context of the rest of the region. This can be seen in Figure 2A. From 1960 to 1980, Mexico almost doubled its income per person, a growth rate that was higher than that of Latin America as a whole. If this growth had continued, Mexico would be a high-income country today. However, both Mexico and the region suffered a sharp slowdown in the growth of income per capita over the following 20 years, 1980-2000, a period that coincided with first a badly handled debt crisis in the early 1980s and then a number of neoliberal policy changes. Regional growth of GDP per capita dropped from 87 percent for the prior two decades, to just 9 percent for 1980-2000, or just 0.4 percent annually. Mexico’s per capita growth fell from 97 percent to 13 percent, or 0.6 percent annually.
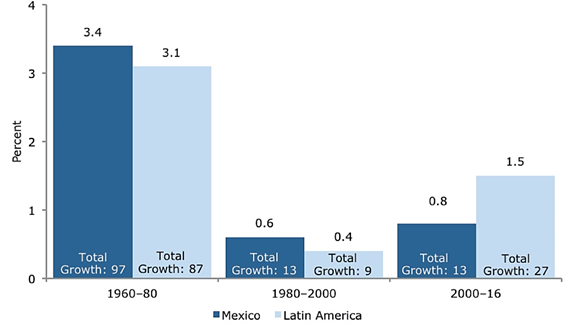
Source and notes: Latin America region includes Argentina, Belize, Bolivia, Brazil, Chile, Colombia, Costa Rica, Ecuador, El Salvador, Guatemala, Guyana, Honduras, Mexico, Nicaragua, Panama, Paraguay, Peru, Suriname, Uruguay, and Venezuela. Authors’ calculations based on Robert C. Feenstra, Robert Inklaar & Marcel P. Timmer, The Next Generation of the Penn World Table, 105(10) American Economic Review. 3150, 3812 (2015). www.ggdc.net/pwt and n.a., World Economic Outlook, October 2016, International Monetary Fund, (2016), https://www.imf.org/external/pubs/ft/weo/2016/02/weodata/index.aspx.
Figure 2A Mexico and Latin America: Average Annual Real Per-Capita GDP Growth, 1960-2016
In the twenty-first century, there was something of a rebound in the region, with per capita GDP growth averaging 1.5 percent annually for 2000-16, despite two recessions and a slowdown since 2011. Looking just at the years since NAFTA, Mexico did not do as well as the whole region, averaging 1 percent in per capita GDP growth for these years. This is shown in Figure 2B.
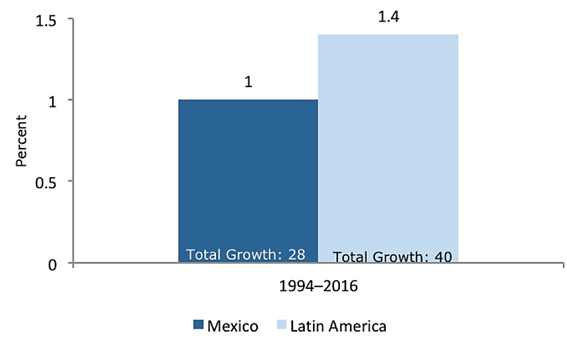
Source and notes: Authors’ calculations based on Robert C. Feenstra, Robert Inklaar & Marcel P. Timmer, The Next Generation of the Penn World Table, 105(10) American Economic Review. 3150, 3812 (2015). www.ggdc.net/pwt and n.a., World Economic Outlook, October 2016, International Monetary Fund, (2016), https://www.imf.org/external/pubs/ft/weo/2016/02/weodata/index.aspx.
Figure 2B Mexico and Latin America: Average Annual Real Per-Capita GDP Growth, 1994-2016.
It is also worth examining where Mexico would be today if its income per person had continued to grow at the rate that it did over the two decades prior to 1980. This is shown in Figure 3. This result was not impossible, as can be seen by the comparison with South Korea, which grew rapidly (although from a much lower starting point than Mexico) from 1960 to 1980, and did not suffer from Mexico’s growth collapse thereafter. Mexico in 2016 would have an income per person of more than $39,000 in 2011 international purchasing power parity dollars,5 which would make its living standards comparable to, or even above, several Western European countries. For comparison, Figure 3 includes the actual trajectory of South Korea, which is today a high-income country; its per capita GDP is about $37,000 in 2011 international purchasing parity dollars.
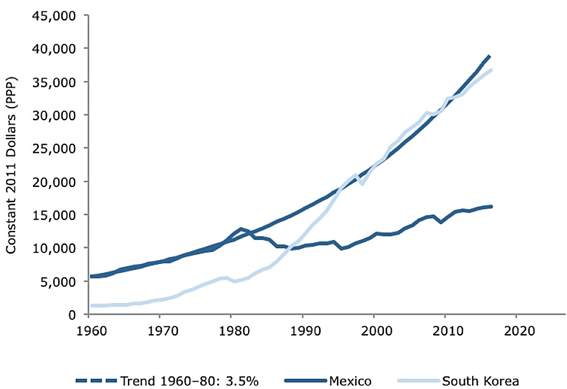
Source and notes: Authors’ calculations based on Robert C. Feenstra, Robert Inklaar & Marcel P. Timmer, The Next Generation of the Penn World Table, 105(10) American Economic Review. 3150, 3812 (2015). www.ggdc.net/pwt and n.a., World Economic Outlook, October 2016, International Monetary Fund, (2016), https://www.imf.org/external/pubs/ft/weo/2016/02/weodata/index.aspx.
Figure 3 Mexico and South Korea: Real GDP Per Capita, 1960-2013
NAFTA was an integral part of a “reform” process that began with major trade liberalization reforms in the 1980s, and was designed to expand upon, and lock in, a set of policies that would put the economy on an irreversible path that was very different from that defined by the developmentalist state and protectionist policies of the pre-1980 period.6 However, even if we look at just the 23 years since NAFTA, and we ask what Mexico would look like today if NAFTA had restored Mexico’s 1960-80 growth rate -after more than a decade of failure- it would still be a reasonably high-income country. Per capita GDP would be significantly more than that of Portugal or Greece.
As would be expected during such a period of very little economic growth, the poverty rate was not reduced in Mexico; in fact, it increased. Figure 4 shows Mexico’s national poverty rate.7 In 2014, it was 55.1 percent, compared to the 52.4 percent rate in 1994. As a result, there were about 20.5 million more Mexicans living below the poverty line as of 2014 than in 1994. Measures of more extreme poverty -“unable to afford health care, education and food,” and “unable to afford food” (as categorized by Mexico’s Consejo Nacional de Evaluación de la Política de Desarrollo Social) improved very little since 1994, falling by just 0.6 and 0.9 percentage points, respectively.

Source: n.a., Evolución de pobreza por la dimensión de ingreso en Mexico 1992-2012, Consejo Nacional de Evaluación de la Política de Desarrollo Social, 2014, http://www.coneval.gob.mx/Informes/Pobreza/Estatal2012/Evolucion_dimensiones_pobreza_1990-2012/AE_Indicadores_Pobreza_1990-2012.zip; Rolando Cordera Campos & Enrique Provencio Durazo, Informe del Desarrollo en México 2015, Universidad Nacional Autónoma de México, (2016), http://www.pued.unam.mx/publicaciones/26/Informe_Desarrollo_2015.pdf
Figure 4 Mexico: Poverty Levels Based on Consumption Baskets (CONEVAL estimate)
We can also compare what happened to poverty in Mexico with the region as a whole. This can be seen in Figure 5. For the region as a whole, there was no progress in reducing the poverty rate for more than two decades, from 1980 to 2002. As seen in Figure 5, the poverty rate for the region then fell substantially, from 43.9 percent in 2002 to 28.2 percent in 2014.
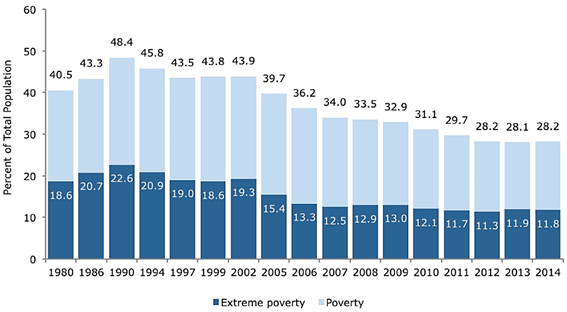
Source: n.a., Population living below the extreme poverty and poverty lines, by geographical location, Economic Commission for Latin America and the Caribbean (ECLAC), (2016c), http://interwp.cepal.org/sisgen/ConsultaIntegrada.asp?idIndicador=182&idioma=e.
Figure 5 Latin America: Poverty and Extreme Poverty (ECLAC estimate)
However, these poverty rates, from the UN Economic Commission on Latin America (ECLAC), are computed from national surveys somewhat differently than those of Mexico’s national poverty statistics. For a comparison between Mexico and the rest of the region, it therefore makes sense to compare ECLAC’s computation of the poverty rate for Mexico with its computation for the rest of the region, excluding Mexico.8 This is shown in Figure 6. By ECLAC’s measure, Mexico’s poverty rate fell from 45.1 percent in 1994 to 41.2 percent in 2014 (3.9 percentage points). However, excluding Mexico, poverty in the region fell more than five times as much, from 46 percent to 25 (21 percentage points).

Source and notes: Author’s calculations using n.a., Population living below the extreme poverty and poverty lines, by geographical location, Economic Commission for Latin America and the Caribbean (ECLAC), (2016c), http://interwp.cepal.org/sisgen/ConsultaIntegrada.asp?idIndicador=182&idioma=e.
Figure 6 Mexico and Latin America: Poverty, 1994 and 2014 (ECLAC estimate)
Figure 7 shows the path of real (inflation-adjusted) wages in Mexico from 1994 to 2014.9 There is a fall in real wages of 21.2 percent from 1994-96, associated with the peso crisis and recession. Wages did not recover to their pre-crisis (1994) level until 2006, 11 years later. By 2014, they were only 4.1 percent above the 1994 level, and barely above their level of 1980. The minimum wage, adjusted for inflation, fared even worse. From 1994 to 2015, it fell by 19.3 percent.10

Source and notes: 1994=100 n.a., Annual real average wages, Economic Commission for Latin America and the Caribbean (ECLAC), (2016a) http://interwp.cepal.org/sisgen/ConsultaIntegrada.asp?idIndicador=341&idioma=e and n.a., Annual real average wages, Economic Commission for Latin America and the Caribbean (ECLAC), (2014) http://interwp.cepal.org/sisgen/ConsultaIntegrada.asp?idIndicador=341&idioma=e.
Figure 7 Mexico: Real Average Wages
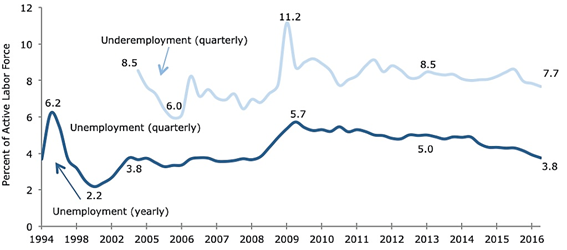
Figure 8 shows Mexico’s unemployment and underemployment rate. (Unemployment is shown since 1994; data on underemployment are only available since 2005.) Although the unemployment rate jumped during the peso crisis and then fell steadily until 2000, it then increased again until 2014. Unemployment has averaged 4.0 percent during NAFTA (1994-2016), compared to an average of 3.1 percent for 1990-94 and a low of 2.2 percent in 2000. These numbers are small in absolute terms, because the official unemployment rate does not capture the full extent of unemployment in Mexico. In order to be counted as unemployed, a worker has to have not worked even one hour in paid activity during the reference period in which the survey was taken, and he or she must have been actively looking for work. But there are many people who would not be counted as unemployed in this data, despite not being employed.
Source: INEGI (2017). n.a., Empleo y Desempleo en Mexico: 1994-2004, Centro de Estudios Sociales y de Opinión Pública (CESOP), (2005), http://201.147.98.14/camara/content/download/22822/110347/file/DAHC0004%20Empleo%20y%20desempleo%201994-2004.pdf.
Figure 8 Mexico: Unemployment and Underemployment, Seasonally Adjusted
This is partly because Mexico has very little social safety net and no unemployment insurance outside of Mexico City. For this reason, heads of household especially will generally engage in some kind of economic activity in order to survive.11 There is a very high level of informal labor; about 40 percent of all employed workers are in units of less than five employees.12 For these and other reasons, movements in the official rate should be seen as an indicator of the proportionate deterioration (and recovery) of the labor market, and not as a measure of the actual level of unemployment.
A somewhat better measure of the state of the labor market is underemployment, also shown in Figure 8, but data only begin in 2005. This includes workers who have a demonstrated need and ability to work more hours but were not able to do so due to labor market conditions. This was 8 percent for 2015, as compared to an annual average of 7.2 percent for the pre-crisis years 2005-07. In any case, it would be difficult to make the case from the available data that NAFTA had succeeded in reducing either unemployment or underemployment.
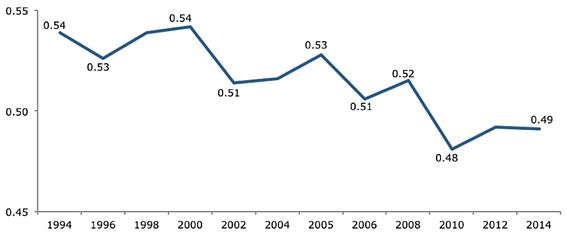
At first glance, Mexico appears to have made significant progress in reducing inequality in the post-NAFTA period. Figure 9 shows the Gini coefficient for household income for the years 1994-2014. It shows a decline from 0.54 to 0.49.
Source: n.a., Gini coefficient, Economic Commission for Latin America and the Caribbean (ECLAC), (2016b) http://interwp.cepal.org/sisgen/ConsultaIntegrada.asp?idIndicador=250&idioma=e.
Figure 9 Mexico: Gini Coefficient
The decline in inequality is something of a mystery, during a period in which real wages stagnated, unemployment and underemployment did not improve, income growth was very slow, and the national poverty rate was higher in 2014 than in 1994. One possible explanation may be in the data. In general, in the kind of survey data on which these statistics are based, a large part of the income of the wealthiest households is not reported. For example, in the United States from 1976 to 2006, the Gini coefficient using income tax data and including capital gains showed an increase of 10.8 points, more than twice the increase in the standard Gini coefficient using survey (CPS) data.13 And in Mexico, enormous fortunes were accumulated during the post-NAFTA era. For example, Mexico’s richest billionaire, Carlos Slim Helú, reportedly increased his net worth by $66.4 billion (from $6.6 billion in 1994 to $73 billion in 2014). The combined net worth of 15 Mexican billionaires in Forbes’ World’s Billionaires list was almost $150 billion in 2015. It is possible that the incomes of these billionaires and others in the top 1 percent, depending on how much was not reported in the household surveys, could make a significant difference in the Gini coefficient.
Efforts to decompose the sources of the decline in inequality shown in the Gini coefficient from household survey data in Mexico, from 1996 to 2006, have indicated that most of it can be attributed to labor income per person.14
In other words, there was a reduction in the inequality within labor income. However, with overall real wages almost stagnant from 1994 to 2015, the living standards of the vast majority of workers cannot have increased very much.
In any case, even if the redistribution had taken place as it appears in the Gini data, it was not enough to reduce the national poverty rate.
III. Agriculture and Employment
NAFTA removed tariffs (but not subsidies) on agricultural goods, with a transition period in which there was a steadily increasing import quota for certain commodities. The transition period was longest for corn, the most important crop for Mexican producers, only ending in 2008. Not surprisingly, US production, which is not only subsidized but had higher average productivity levels than that of Mexico, displaced millions of Mexican farmers. Table 2 shows agricultural employment in Mexico in 1991 and 2007, according to census data.
Table 2 Mexico: Employment in Agricultural and Forestry from Agrarian Census 1991, 2007
| 1991 | 2007 | Percent Change | |
| Family* | 8,370,879 | 3,510,394 | -58% |
| Remunerated Total | 2,305,432 | 5,139,793 | 123% |
| Permanent (more than 6 months) | 427,337 | 420,989 | -1% |
| Seasonal (less than 6 months) | 1,878,095 | 4,718,804 | 151% |
| Total | 10,676,311 | 8,650,187 | -19% |
Source and notes: Adapted from Table 10a (p.25) in John Scott, The Incidence of Agricultural Subsidies in Mexico, Centro de Investigación y Docencia Económicas (Dec. 2009), http://cide.edu/repec/economia/pdf/DTE473.pdf
* Family and other workers who are not paid in cash are sometimes listed as “non-remunerated.”
As can be seen, there was a 19 percent drop in agricultural employment, or about 2 million jobs. The loss was in family labor employed in the family farm sector. Seasonal (less than six months employment) gained about 3 million jobs, but it was not nearly enough to compensate for the 4.9 million jobs lost in the family farm sector.
Proponents of NAFTA of course knew that family farms in Mexico would not be able to compete with subsidized US production but argued that displaced workers would shift to higher productivity agriculture (mainly vegetables and fruits for export), as well as industrial jobs. Although vegetable and fruit production did expand considerably (from 17.3 million tons in 1994 to 28.2 million in 2012), and presumably accounted for many of the 3 million seasonal jobs created, it was clearly not enough in terms of employment.
From 1994 to 2000, the estimated annual number of immigrants from Mexico to the United States soared by 79 percent. This can be seen in Table 3, with the annual flow of migrants rising from 430,000 in 1994 to 770,000 in 2000.
Table 3 Annual Immigration from Mexico to US: 1991‒2010 (in thousands)
| 2010 | 140 |
| 2009 | 150 |
| 2008 | 250 |
| 2007 | 280 |
| 2006 | 390 |
| 2005 | 550 |
| 2004 | 670 |
| 2003 | 570 |
| 2002 | 580 |
| 2001 | 580 |
| 2000 | 770 |
| 1999 | 700 |
| 1998 | 600 |
| 1997 | 470 |
| 1996 | 490 |
| 1995 | 570 |
| 1994 | 430 |
| 1993 | 370 |
| 1992 | 400 |
| 1991 | 370 |
Source: Jeffrey Passel, D’Vera Cohn & Ana González-Barrera, Net Migration from Mexico Falls to Zero - and Perhaps Less, Pew Hispanic Center (Apr. 2012), http://www.pewhispanic.org/2012/04/23/net-migration-from-mexico-falls-to-zero-and-perhaps-less/ and Renee Stepler & Anna Brown, Statistical Portrait of Hispanics in the United States, Pew Hispanic Center (Apr. 2016), http://www.pewhispanic.org/2016/04/19/statistical-portrait-of-hispanics-in-the-united-states-about-the-data/.
The initial post-NAFTA increase in immigration from Mexico can also be seen in Table 4, which shows the number of Mexican-born residents living in the United States. This more than doubled from 4.5 million in 1990 to 9.4 million in 2000, and peaked at 12.6 million in 2009.
Table 4 Mexican-Born Population in the US: 1980-2011 (in thousands)
| 2013 | 11.502 |
| 2012 | 11.489 |
| 2011 | 11.987 |
| 2010 | 12.323 |
| 2009 | 12.565 |
| 2008 | 12.551 |
| 2007 | 12.558 |
| 2006 | 12.043 |
| 2005 | 11.653 |
| 2004 | 11.356 |
| 2003 | 10.661 |
| 2002 | 10.426 |
| 2001 | 9.734 |
| 2000 | 9.444 |
| 1990 | 4.500 |
| 1980 | 2.199 |
Source: Jeffrey Passel, D’Vera Cohn & Ana González-Barrera, Net Migration from Mexico Falls to Zero - and Perhaps Less, Pew Hispanic Center (Apr. 2012), http://www.pewhispanic.org/2012/04/23/net-migration-from-mexico-falls-to-zero-and-perhaps-less/ and Renee Stepler & Anna Brown, Statistical Portrait of Hispanics in the United States, Pew Hispanic Center (Apr. 2016), http://www.pewhispanic.org/2016/04/19/statistical-portrait-of-hispanics-in-the-united-states-about-the-data/.
After 2000, the flow of migrants from Mexico to the US slowed, with several contributing factors: increased border security after the 9/11 attacks; the US recession of 2001 and the prolonged weakness in job creation in the years that followed, and the increased costs and danger of crossing the border.15
Migration from the US to Mexico also increased in the 2000s, so that between 2005 and 2010 the net flow to the US was negative by some measures.16 (The figures in Tables 3 and 4 are for emigration from Mexico to the US, not net flows.)
It was noted previously that if the Mexican economy had continued growing at its 1960-80 rate, Mexico would be a high-income country today; and that it would also have become a high-income country even if its pre-1980 growth rate had been restored after NAFTA. There would still be a significant income and wage differential between Mexico and the United States, but the incentive to emigrate to the United States would have been tiny as compared with what actually materialized. It is questionable whether immigration would have become a political issue in the United States, as it did especially in the 2016 election and now under the Trump administration, if not for the poor performance of the Mexican economy in the post-NAFTA years.
IV. Economic Policy and Mexican Integration with the United States Economy
As noted above, NAFTA was just one variable among others that could account for Mexico’s poor economic performance since 1994. However, it appears to be related to other economic policy choices that have negatively affected the Mexican economy during this period.
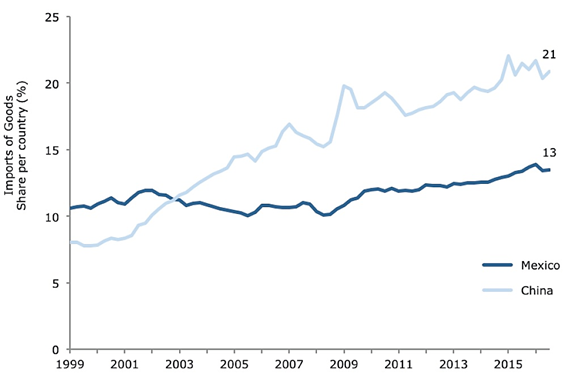
The IMF noted in 2013: “Mexico competes directly with China in the US market.”17 Today, China accounts for 21 percent of US imports and Mexico accounts for 13.5 percent (see Figure 11). This is a very tough competition for Mexico for a number of reasons. First, Mexico has been throughout the vast majority of the post-NAFTA period a much higher-wage country than China, although the gap has narrowed and there is no definitive data for China in recent years. In 1996, labor compensation costs in Mexico, in US dollars, were $3.05 per hour, which rose to $5.59 by 2002.18 For China in 2002, hourly compensation costs in US dollars were $0.73 per hour.19 Although these data are not exactly comparable because of differences in their construction, they indicate a huge gap in dollar terms-which is what matters for export or import-competing industries. By 2009, the gap was still very large: $1.74 for China, versus $6.36 for Mexico.20 So it was difficult to compete on the basis of wages. Second, China maintained a commitment to a competitive exchange rate throughout the 2000s, in effect fixing this exchange rate against the dollar or (since 2005) a basket of currencies. The Mexican Central Bank by contrast has had, as the imf notes, “a firm commitment to exchange rate flexibility.”21 In other words, the Mexican Central Bank would typically raise or lower interest rates as necessary to reach its target inflation rate (3 percent) and let the exchange rate go where it may. This means that Mexico’s exchange rate was for most of the past two decades unlikely to be competitive with China’s, which further worsens Mexico’s cost disadvantage. The Mexican Central Bank’s form of rigid inflation targeting also adds a large element of unpredictability to the exchange rate, which has a negative impact on foreign direct investment; foreign investors will find it difficult to know how much their assets or output will be worth internationally in the future.

Source: n.a., Foreign Exchange Rates - H.10, Board of Governors of the Federal Reserve System (2017), https://www.federalreserve.gov/releases/h10/hist/.
Figure 10 Exchange Rate to One US Dollar, Annual, Not Seasonally Adjusted
Source: n.a., Table 2.2. U.S. International Trade in Goods by Area and Country, Seasonally Adjusted Detail [Millions of dollars], US Bureau Of Economic Analysis (2016), https://bea.gov/iTable/iTable.cfm?ReqID=62&step=1#re qid=62&step=1&isuri=1.
Figure 11 United States: Imports from Mexico and China
In the past few years, the Mexican peso has significantly depreciated against the US dollar, while China’s currency has seen an overall slight appreciation since 2007. This is shown (in nominal terms) in Figure 10. The combination of a rapidly depreciating peso (with relatively little wage growth) in Mexico and rising labor costs in China has narrowed the gap in labor costs between the two countries. (More recent wage data for China are not available at the moment.) However, it is not yet clear how much difference these changes will make going forward in the competition between Mexico and China in US markets. The Mexican peso is difficult to predict, since its value depends on monetary policy decisions by the Mexican Central Bank that are unrelated to exchange rate policy; and on decisions by the US Federal Reserve, as well as on speculation related to international markets, as noted above.
The depreciation of the Mexican peso has made manufacturing wages in Mexico somewhat more competitive, bringing them back down to under $4 per hour (USD).22
China has other advantages that make it a formidable competitor for Mexico in the US market: the Chinese government controls most of the banking system in China, and can therefore ensure that its most important exporting firms have sufficient access to credit. In Mexico, by contrast, the banking system is not only private, but 70 percent of it is foreign owned.23 The Chinese government also has an active industrial policy that enables it to help its exporting firms in various ways.24 China also spends over 2 percent of its 10-times-larger GDP on research and development, as compared to Mexico’s 0.54 percent.25
For all these reasons, it is an uphill battle for Mexico to compete with China in the US market. Although Mexico has done better than other countries in the US market in terms of this competition since China joined the World Trade Organization and achieved “permanent normal trade relations” with the US in 2001,26 its share of US imports is still only about half that of China’s (see Figure 11).
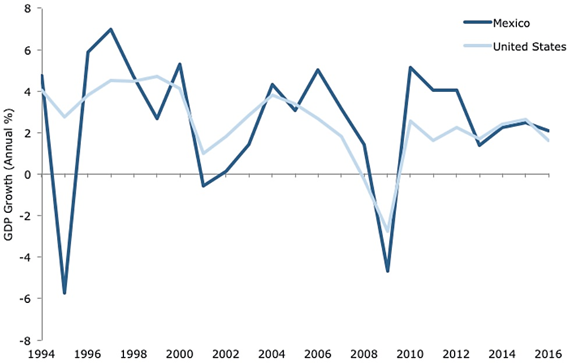
NAFTA also increasingly tied Mexico to the US economy. Figure 12 shows how the Mexican economy has moved with the US economy over the past 23 years. Much of this synchronization is because over two-thirds of Mexico’s exports now go to the United States. Unfortunately, 1994 was a particularly bad time for Mexico to hitch its wagon to the United States. First came the peso crisis, which was brought on by the US Federal Reserve’s increases in US monetary policy rates beginning in 1994. Mexico lost 9.5 percent of GDP in two quarters during the resulting crisis and recession, which started in December 1994 and continued into the first half of 1995. The fall in the peso helped boost exports for a while, but the peso appreciated as capital flowed back into the country and the advantage of a competitive exchange rate was soon lost.
Source: n.a., World Economic Outlook, October 2016, International Monetary Fund (2016), https://www.imf.org/external/pubs/ft/weo/2016/02/weodata/index.aspx.
Figure 12 Mexico and the US: Annual GDP Growth
Perhaps more importantly over the longer run, the US economy was just beginning a period in which its growth would be driven by enormous asset bubbles. First there was the stock market bubble, which burst in 2000-02, causing a recession in both the Unites States and Mexico. The stock market bubble was then immediately replaced by what later became the biggest asset bubble in world history, the United States’ real estate bubble. This bubble burst in 2006-07, causing the Great Recession. Mexico’s loss of output from the US Great Recession (and world recession) was the worst in Latin America, with a decline in real GDP of 6.7 percent from the second quarter of 2008, to the second quarter of 2009.27
In May 2013, after the US Federal Reserve announced a future “tapering” of its quantitative easing program (QE3), there were fears of a repeat of the 1994 peso crisis. Gross foreign portfolio inflows came to a sudden stop,28 and the Mexican economy took a hit, with growth at 1.36 percent for the year.29 As the imf noted in its 2013 Article IV consultation for Mexico:
Based on a recent survey, the bis reported that the Mexican peso is the most actively traded emerging market currency in the world, with a daily global trading volume of US$135 billion. This means that Mexico’s deep and liquid foreign exchange and domestic equity and sovereign bond markets can serve as an early port of call for global investors in episodes of financial turbulence and hence are susceptible to risks of contagion.30
This is not a good situation for any developing country to be in: hedge funds and international portfolio managers seeking to reduce their overall exposure to emerging market assets, or hedge against currency depreciation in emerging markets because of trouble that may emerge from anywhere in the world, look first to sell off Mexican assets or bet against the peso. As the imf also notes, “the Mexican peso is fully convertible and trades 24 hours daily.” While the policy decisions that led to this situation were not all written into NAFTA, many were closely related in that they were part of a strategy of guaranteeing foreign investors the kinds of capital mobility that they wanted, in order to attract foreign investment (both portfolio investment and FDI).
V. Conclusion
As was well known at the time of NAFTA’s passage, the main purpose of NAFTA was to lock in a set of economic policies, some of which were already well underway in the previous decade, including the liberalization of manufacturing, of foreign investment and of ownership, and other changes.31 The idea was that the continuation and expansion of these policies would allow Mexico to achieve efficiencies and economic progress that was not possible under the developmentalist, protectionist economic model that had prevailed in the decades before 1980. While some of the policy changes were undoubtedly necessary and/or positive, the end result has been decades of economic failure by almost any economic or social indicator. This is true whether we compare Mexico to its developmentalist past, or even if the comparison is to the rest of Latin America since NAFTA. After 23 years, these results should provoke more public discussion as to what went wrong.

