


Serviços Personalizados
Journal
Artigo
 Inglês (pdf)
 Artigo em XML
 Referências do artigo
 Enviar este artigo por email
Indicadores
-
 Citado por SciELO
 -
 Acessos
Links relacionados
-
 Similares em
SciELO
Similares em
SciELO
Compartilhar

 Permalink
Tropical and subtropical agroecosystems
versão On-line ISSN 1870-0462
Trop. subtrop. agroecosyt vol.14 no.3 Mérida Set./Dez. 2011
Artículos de investigación
Analysis of genetic diversity and structure of baluchi sheep by microsatellite markers
Análisis de diversidad y estructura genética del borrego baluchi mediante marcadores microsatelitales
G.R. Dashaba,c*, A. Aslaminejadª, M. Nassiriª, A.K. Esmailizadehb, D.A. Saghiª
ª Department of Animal Science, Faculty of Agriculture, Ferdowsi University, Mashhad, Iran.
b Department of Animal Science, Faculty of Agriculture, Shahid Bahonar University of Kerman, Kerman, PB 76169-133, Iran, ali_esmaili2@yahoo.com
c Department of Genetic and Biotechnology, Aarhus University, Denmark, golamr.dashab@agrsci.dk E-mail address: dashab5@yahoo.co.in golamr.dashab@agrsci.dk
* Corresponding Author
Submitted June 21, 2011
Accepted August 30, 2011
Revised received September 06, 2011
Abstract
Allele diversity, genetic variability and population structure in two subpopulations of Baluchi sheep were estimated using seven microsatellite markers. A total of 503 individuals from two subpopulations were genotyped. Average number of alleles per locus for all loci was 5.57. The range of alleles per locus was from 4 in BM1853 and BMS1714 loci to 7 in MCM200 and RM0006 loci. The seven tested loci were all polymorphic in both subpopulations. The average observed heterozygosity over all the loci in each subpopulation was less than the expected heterozygosity. Test of genotype frequency deviation from Hardy-Weinberg equilibrium (HWE) at each locus, over all the population, revealed a significant departure from HWE. A slightly low rate of inbreeding within the two subpopulations was noticed (Fis = 0.003). Low genetic differentiation was detected based on the estimated Fst index between the two subpopulations. The genetic structure (AMOVA) analysis showed that about 2.4% of the total genetic variation was explained by population differences and 97.6 percent was corresponded to differences among individuals. The mean of polymorphism information content (PIC) value for all loci in Baluchi population was 0.65. In addition, the analysis of segregation in the populations showed that 85% of the individuals were informative, indicating the relatively high polymorphism in selected marker in Baluchi sheep.
Key words: DNA markers; Diversity; Inbreeding.
Resumen
Se estimó la diversidad de alelos, la variabilidad genética y la estructura poblacional de dos subpoblaciones del borrego Baluchi empleando siete marcadores microsatelitales en 503 individuos. El número promedio de alelos por locus para todos los locus fue de 5.57. El rango de alelos por locus fue de 4 en los locus BM1853 y BMS1714 a 7 en los locus MCM200 y RM0006. Los siete locus evaluados fueron todos polimórficos en ambas subpoblaciones. El promedio de heterozigocidad en todos los locus fue menor a la esperada. La prueba de la desviación de frecuencia genotípica en relación al equilibrio esperado de acuerdo a la ley de Hardy-Weinberg (HWE) en cada locus reveló una desviación significativa del valor esperado. Se observó un baja tasa de endogamia en dentro de cada población (Fis = 0.003). Se observa una baja diferenciación genética entre ambas poblaciones basado en el índice Fst. El análisis de estructura genética (AMOVA) mostró que 2.4% de la variación genética era explicada por diferencias poblacionales y 97.6% por diferencias individuales. La media del valor de información de polimorfismo (PIC) para todos los locus de la población Baluchi fue de 0.65. Además, el análisis de segregación de la población indicó que el 85% de los individuos proporcionaron información, indicando el relativamente alto nivel de polimorfismo en los marcadores seleccionados en el borrego Baluchi.
Palabras clave: Marcadores ADN; diversidad genética; endogamia.
INTRODUCTION
The total sheep population in Iran is 54 million heads, including 27 breeds and ecotypes (ASRI, 2004). Among them, Baluchi sheep is one of the most numerous breed, constitutes about 30% of total sheep population of Iran. It plays an important role in meat and wool production. Baluchi is an indigenous sheep breed, widely distributed in centre, east, north and southeast of Iran. This breed has been adapted to hard climate conditions in Iran, south of Afghanistan and southwest of Pakistan. Baluchi sheep have a white coat color and have lean medium fat-tail. Rams in this breed have usually long horns while ewes do not. The average body weight of the adult ewe and ram is 39 and 48 kg, respectively. The wool production in the adult ewe and ram is 1.3 and 1.8 kg, respectively (ASRI, 2004).
Similar to most of sheep breeds in Iran, Baluchi sheep is a multi-purpose breed producing meat, wool and milk. However, the breeding objective for this breed has been changed in recent years and the selection has been focused mainly on meat production.
Success in breeding programs depends on the amount of variation in population. Also, lack of diversity will limit success of any breeding program. In addition, the maintenance of genetic diversity is a key to the long term survival of most species (Zhang et al., 2009). The genetic polymorphism and diversity found in the animal breeds allow the farmers to develop new characteristics in response to changes in environment or market conditions (Zhang et al., 2009). Information about population of farm animals and their genetics is very important in animal breeding. The molecular markers such as microsatellites and STRs (short tandem repeats) are useful tools in estimating genetic diversity and genetic structure of the population (Esmail-Khanian et al., 2007).
Microsatellites occur regularly throughout the animal genome and are stable, polymorphic and easy to analyze. Also, microsatellites are co-dominant markers, so that all alleles can be scored. Nucleotide motifs are dispersed throughout the genome and have a high level of polymorphism compared with those of other molecular markers (Selkoe and Toonen, 2006). Given the large number of the available microsatellite markers, study of genetic structure and other characteristics of sheep breeds using molecular techniques, is of interest. Over the past decade, numerous studies on genetic diversity in domestic livestock, based on the analysis of microsatellite loci, have been carried out worldwide (Dalvit et al., 2008; Mahmoudi and Babayev, 2009; Kusza et al., 2010; Arora et al., 2008). In Iran, a number of studies were done to evaluate the genetic diversity of Iranian sheep breeds (Osfory, 1999; Ghanbari, 2002; Daneshyar, 2003; Fendereski, 2004; Zahedy, 2004). Esmail-Khanian et al. (2007) used nineteen microsatellites to evaluate genetic variation in Baluchi sheep breed (using 45 animals per marker). Banabazi et al. (2007) studied the genetic variation within and between five Iranian sheep populations including Sanjabi, Kordi Kordistan, Kordi Khorasan, Mehraban and Moghani using six microsatellite markers. Nanekarani et al. (2010), using fifteen microsatellite, investigated the Iranian pelt sheep breed and found high level of genetic diversity and polymorphism in the markers they studied. Also, Sharifi-Sidani et al. (2009), Razban et al. (2009) and Molaei et al. (2011) investigated the genetic variation within and between different ecotypes of the Iranian sheep based on the analysis of microsatellite loci.
In this study, the allele diversity and genetic variability in two subpopulations of Baluchi sheep were investigated, by using microsatellite markers.
MATERIAL AND METHODS
Subpopulations history
The Research Centre of Baluchi breed in Mashhad was established in 1970. The population was divided in two subpopulations since the beginning of breeding plan. The two subpopulations were developed using 700 and 500 founder Baluchi ewes in subpopulations 1 and 2, respectively. In the recent years, the size of each subpopulation was increased to two thousand heads founder. The selection goal in subpopulation 1 (line 1) was based on increasing lamb production while in subpopulation 2 (line 2) the selection goal was for improving wool quality. Blood samples were taken from 503 animals including 13 sires and 490 progeny (289 animals from subpopulation 1 and 214 animals from subpopulation 2).
Microsatellite analysis
Seven microsatellite markers were selected based on their polymorphism and their location in chromosomes. The markers were taken from the available web-based sheep genetic map (http://www.thearkdb.org/arkdb/). The general characteristics of the markers and sequence of the primers are presented in Table 1.
DNA was extracted from frozen blood samples using DNA extraction kit (Diatom prep 100, Cinnagene Co., Iran). DNA concentration was determined using Nano drop machine and PCR amplifications were carried out in 25 ul reactions using 20-50 ng genomic DNA as template. Reaction mixtures contained Taq DNA Polymerase, dNTP, Tris-HCL, KCL and MgCl2. The cycling protocol was conducted with an initial denaturation step at 95 °C for 10 min followed by 35 cycles of the following steps: 94 °C for 30s, 48-62 °C for 55s and 72 °C for 30s. The reactions were terminated by a final extension step at 72°C for 10 min. The primers and other information for markers are presented in Table 1. Amplification products were electrophoresed on 6 and 8% denaturing poly-acrylamide gels and the DNA bands were visualized following silver staining.
Statistical analysis
Different measurements of within breed genetic variation viz. the number of alleles per locus and population level, the effective number of alleles (Ne), Shannon's information index (I) as a measure of gene diversity, mean observed (Ho) and mean expected (He) heterozygosity value in each subpopulation and for the whole population were estimated. Test of departure from Hardy-Weinberg equilibrium was performed through Chi-square test and G-square test (Gst). The F-statistics parameters were calculated for three indices: Fit (inbreeding coefficient of an individual i relative to the total population), Fis (inbreeding coefficient of an individual i relative to the subpopulation) and Fst (the effect of subpopulation s compared with the total population). Then gene flow between two populations was calculated based on Fst estimates (Slatkin and Barton, 1989). Microsatellite allele frequency data was applied to calculate genetic distance (DA) according to the method of Nei (1978) using the un-weighted pair group method with arithmetic mean for dendrogram construction. All the above analyses were carried out using the POPGENE program (Yeh et al. 1999).
Polymorphism information content (PIC) was calculated using the method of Botstein et al. (1980) applying HET software version 1.8 (Ott, 2001).
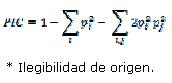
In this formula i and j are the frequency of observed alleles in different populations. Analysis of molecular variance (AMOVA) was carried out using Arlequin software 3.1 (Excoffier et al. 2005) to statistically test the existence of differences among two subpopulations.
RESULTS
Allele diversity
The number of alleles (A), effective number of alleles (Ne) and Shannon's information index (I) for each of the seven microsatellites for individual subpopulations and overall population are presented in Table2. The total number of alleles was 39 for the seven loci studied. The number of identified alleles per locus ranged from 4 (BM7247, BM1853 and BMS1714 markers in subpopulation 1; BM1853 and BMS1714 in subpopulation 2) to 7 (BM6465 in subpopulation 1; MCM200 and RM0006 in subpopulation 2). However, the mean number of alleles per subpopulation and overall population for all loci were 4.86, 5.40 and 5.60 respectively. The effective number of alleles per locus ranged from 1.35 (BM1853) to 4.25 (MCM200) and Shannon's Information index varied from 0.53 (BM1853) to 1.61 (MCM200). The difference in frequency between two alleles was highest for RM0006 locus. Test for difference of allele frequencies in the two subpopulations was significant for a number of alleles (allele a in locus BM0741; alleles a and b in locus BM1853; alleles a and d in locus BM7247; alleles b and d in locus BMS1714; allele b in locus MCM200; alleles a, c and d in locus RM0006, p<0.05). Frequency of some alleles was zero in both subpopulations (allele g in BM6465 marker in subpopulation 1; allele e in BM7247 marker in subpopulation 2; allele f and g in MCM200 marker in subpopulation 1 and allele f and g in RM0006 marker in subpopulation 1). Frequency of alleles in BM6465 locus was similar in the two subpopulations. Twenty seven alleles (69 %) were found to be unique in both subpopulations. Highly informative markers like MCM200 and RM0006 showed specific alleles in subpopulation 2 (f and g alleles).
The polymorphism information content (PIC), for each of the loci is shown in Table 2. The PIC values for all loci ranged from 0.45 to 0.76 and the highest PIC was related to MCM200 locus while the lowest PIC was related to BM1853 locus. The PIC values between the two subpopulations were not significantly different (T-test, p> 0.05). The PIC values were relatively high, indicating that the selected loci are highly informative and are suitable for genetic studies of the Baluchi sheep breed.
Genetic variability
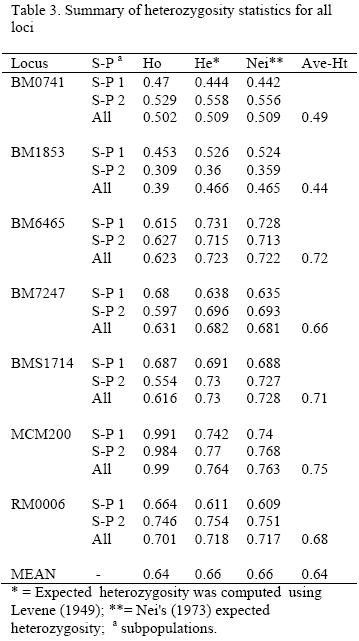
The observed and expected homozygosity and heterozygosity in each locus for both subpopulations and for overall population are shown in Table 3. The overall expected heterozygosity was 0.66 ranging from 0.47 in BM1853 locus to 0.76 in MCM200 locus. The mean expected heterozygosities in subpopulation 1 and 2 were 0.63 and 0.65, respectively. The mean observed heterozygosity values varied between 0.39 (BM1853) and 0.99 (MCM200) while the average expected heterozygosity values varied between 0.44(BM1853) and 0.75 (MCM200). Expected heterozygosity was higher than its corresponding observed values for loci BM1853, BM6465, BM7247 and BMS1714.
Test of genotype frequencies for deviation from Hardy-Weinberg equilibrium (HWE) was significant (p<0.01) for all of the loci in the whole population (Gsttest, p<0.05). The Gst and F-statistics for each locus for overall population are given in Table 4. Three loci (BM0741, BM6465 and RM0006) in subpopulation 1 and two loci (BM1853 and RM0006) in subpopulation 2 were in Hardy-Weinberg equilibrium (p>0.05).
The values of fixation indexes (Fis, Fst and Fit) for the overall populations are given in Table 5. Most of the markers had positive values for Fis (BM1853, BM6465, BM7247 and BMS1714) showing a deficiency in heterozygosity. The Fis index was negative for MCM200, RM0006 and BM0741 markers indicating a high frequency of heterozygotes in these loci.
Population structure
Nei's (1978) genetic distance and genetic identity between the two subpopulations were 0.09 and 0.91, respectively. The genetic distance between the two subpopulations shows that they are very close to each other. The genetic distances between the two subpopulations of Baluchi breed calculated based on the markers are presented in Table 6. The smallest genetic distance was for BM6465 marker (0.024), and the largest genetic distance was for RM0006 marker (0.3518). The RM0006 marker had the largest number of alleles among other markers in this study and showed specific alleles in subpopulation 2.
The result of AMOVA is illustrated in Table 7. The AMOVA of the two subpopulations showed that 2.4 % of total variation was inter population and 97.6 % was related to intra population.
DISCUSSION
Knowledge on genetic diversity, population structure and genetic relationships among populations are essential for future breeding plan. In this respect, DNA markers such as microsatellites used in this study are useful tools to investigate within and between sheep breeds genetic characteristics.
The seven microsatellites used in this study were highly polymorphic. The mean number of alleles in whole population was 5.6. The total number of alleles per locus varied between 4 and 7. Molaei et al. (2011) in the study of six native Iranian native breeds detected 5.9 alleles per breed for microsatellites markers varying from 4 to 9 alleles in different breeds. Also, Nanekarani et al. (2010) reported that the total number of detected alleles in three sheep breeds varied from 6 to 12, and the mean numbers of alleles per locus were 8.1, 8.0 and 8.1 in Gray, Zandi and Karakul sheep breeds, respectively.
Nanekarani et al. (2010) observed negative values for Fis (-0.19) and Fit (-0.168) in the study of pelt sheep breed of Iran; while in the present study the positive Fis value for most of the markers in whole populations indicates a general potential risk for inbreeding. The Fst values of genetic differentiation ranged from 0.005 (BM6465) to 0.062 (RM0006). The value of Fis for most of the markers were higher than the Fst values, except for markers MCM200, RM0006 and BM0741 in which the values of Fst were higher than that of Fis. Multi-locus Fst values showed that about 2.4 % of the total genetic variation was explained by population differences and 97.6 % corresponded to differences among individuals. The values of Fit in the subpopulation for the most of markers were positive which shows the deficiency of heterozygosity. However, it was negative for MCM200 marker indicating that the heterozygosity was increased. This marker had specific alleles (g and f alleles) in the subpopulation and overall population.
The value of gene flow between the two subpopulations was positive and varied between 3.8 and 54.0 for different markers. This corroborated that animals were exchanged between the two subpopulations. The overall inbreeding coefficients Fis =0.003 and Fit =0.027 observed in the present study indicate a decrease of heterozygotes, thus the population is in the risk of inbreeding depression. The Fst value was 0.024 which shows the low differentiation between the two subpopulations. This result is similar to those reported for other breeds (Nanekarani et al., 2010; Molaei et al., 2011), where Fst estimates ranged between 0.03 and 0.08. The low genetic distance value (DA=0.09) supported high genetic similarity between the two subpopulations. The genetic similarity observed between the two subpopulations is probably due to migration between them.
All of the investigated loci deviated from Hardy-Weinberg equilibrium (p < 0.01). This may be due to migration, high mutation rate in microsatellites and artificial selection in the two subpopulations. Deviation from HWE at microsatellites loci have also been reported in various native sheep breeds (Esmail-Khanian et al., 2007; Banabazi et al., 2007; Nanekarani et al., 2010; Razban et al., 2009 ; Molaei et al., 2011; Aminafshar et al., 2008 ; Sharifi-Sidani et al., 2009).
Figure 1.Distribution of allele frequency between two subpopulations for different markers
PIC is an index to measure genetic variation and describe the genetic variation of animal populations at the molecular level (Botstein et al., 1980) so that when PIC >0.5, the locus shows high polymorphism. Microsatellite markers with PIC over 0.70 are very useful in genetic linkage studies (Barker et al., 2001). In this study, all of the loci, except BM1853 locus, had the PIC values higher than 0.50 and the mean of PIC for all of the loci was 0.65 indicating that the selected loci are highly informative and suitable for molecular genetic studies of Baluchi sheep breed.
CONCLUSION
The seven tested microsatellite loci were all polymorphic in the two subpopulations of Baluchi sheep breed. The average observed heterozygosity over all the loci in each subpopulation was less than the expected heterozygosity. The results showed that about 2.4 % of the total genetic variation was explained by population differences and 97.6 % corresponded to differences among individuals indicating a very low genetic differentiation between the two subpopulations.
Then, this study show that more than 30 years trying to make separate lines could not be successful in research center of Baluchi sheep.
ACKNOWLEDGMENTS
This study was funded and supported by Department of Animal Science, Ferdowsi University of Mashhad, Iran. The authors also acknowledge the staff of the Research Centre of Baluchi sheep in north-east of Iran for their assistance in collecting the phenotypic data.
REFERENCES
Aminafshar, M., Amirinia, C., Torshizi, R.V. 2008. Genetic diversity in buffalo population of guilan using microsatellite markers. Journal of Animal and Veterinary Advance. 7: 1499-1502. [ Links ]
Animal Science Research Institute of IRAN Tehran. 2004. Draft Iran's Country Report on Farm Animal Genetic Resources: Ministry of Jihad-e-Agriculture. [ Links ]
Arora, R., Bhatia, S., Sehrawat, A., Maity, S.B., Kundu, S.S. 2008. Genetic variability in Jalauni sheep of India inferred from microsatellite data. National Bureau of Animal Genetic Resources, P.O.Box 129, Karnal-132001, Haryana, India. [ Links ]
Banabazi, MH., Esmaeil-khanian, S., Miraei-Ashtiani, S.R., Moradi Shahrbabak, M. 2007. Genetic variation within and between five Iranian sheep populations using microsatellite markers. Iranian Journal of Science Technology Agriculture Nature Research. 10: p. 4. [ Links ]
Barker, J.S.F., Tan, S.G., Moore, S.S., Mukherjee, T.K., Matheson, J.L., Selvaraj, O.S. 2001. Genetic variation within and relationship among populations of Asian goats (Capra Hircus). Journal of Animal and Breeding Genetic. 118: 213-233. [ Links ]
Botstein, D., White, R.L., Skolnick, M. 1980. Construction of a genetic linkage map in man using restriction fragment length polymorphisms. American Journal of Human Genetic. 32:314-331. [ Links ]
Dalvit, C., Sacca, E., Cassandro, M., Gervaso, M., Pastore, E., Piasentier, E. 2008. Genetic diversity and variability in Alpine sheep breeds. Small Ruminant Research. 80: 45-51. [ Links ]
Daneshyar, P. 2003. Polymorphism determination of nine microsatellite markers in Baluchi sheep. M. Sc. Dissertation, Zabul University, Zabul. (In Farsi). [ Links ]
Esmail-Khanian, S., Nejati, J.A., Afraz, F., Daneshyar, P., Ghanbari, S. 2007. Genetic variation among baluchi sheep population using microsatellite markers. Iranian Journal of Science Technology Agriculture Nature Research. 11: p. 41. [ Links ]
Excoffier, L.G. Laval, and Schneider, S. 2005. Arlequin version3.1: An integrated software package for population genetics data analysis. Evolutionary Bioinformatics online. 1: 47-50. [ Links ]
Fendereski, A. 2004. Genetic diversity in Baluchi sheep population using microsatellite markers. M. Sc. Dissertation, Azad University, Karaj. (In Farsi). [ Links ]
Ghanbari, S. 2002. Molecular investigation and polymorphism determination in Baluchi sheep using microsatellite markers. M. Sc. Dissertation, Zanjan University, Agriculture Faculty, Zanjan. (In Farsi). [ Links ]
Kusza, S.D., Dimov, I., Nagy, Z., Bosze, A., Javor, S., Kukovics. 2010. Microsatellite analysis to estimate genetic relationships among five Bulgarian sheep breeds. Genetic Molecular Biology. 33: p. 1. [ Links ]
Mahmoudi, B., and Bbbayev, M.S. 2009. The investigation of genetic variation in Taleshi goat using microsatellite marker. Research Journal of Biology Science. 4: 644-646. [ Links ]
Molaei, V., Osfori, R., Askandarei-nasab, M., Ghanbarei, S., Nikmard, M. 2011. Microsatellite variation among sex Iranian sheep breeds. Iranian Journal of Animal Research. 2: 178-183. [ Links ]
Nanekarani, S., Amirinia, C., Amirmozafari, N., Vaez Torshizi, R., Gharahdaghi, A.A. 2010. Genetic variation among pelt sheep population using microsatellite markers. African Journal of Biotechnology. 9:7437-7445. [ Links ]
Nei, M. 1973. Genetic distance between populations. Amarican Nature. 106: 283-292. [ Links ]
Nei, M. 1978. Estimation of average heterozygosity and genetic distance from a small number of individuals. Genetics. 89:583-590. [ Links ]
Osfori, R. 1999. Genetic markers among ten Iranian native sheep breeds. Journal of Research and Construction. 34: 156-162. [ Links ]
Ott, J. 2001. Progaram Het version 1.8. Utility programs for analysis of genetic linkage. Rockefeller University. New York, NY, USA [ Links ]
Razban, V., Asmail-Khanian, S., Vaez Torshizi, R. 2009. Genetic variation in Baluchi sheep population using microsatellite markers. Iranian Journal of Animal Science. 40: 11-17. [ Links ]
Selkoe, K. A. and Toonen, R. J., 2006. Microsatellites for ecologists: a practical guide to using and evaluating microsatellite markers. Ecology Letters. 9:615-629. [ Links ]
Sharifi-Sidani, E., Amirinia, C., Lavaf, A., Farasati, C., Aminafshar, M. 2009. Genetic variation among different ecotypes of the Iranian Sanjabi sheep. Journal of Animal and Veterinary Advance. 8: 1173-1176. [ Links ]
Slatkin, M., Barton, N.H. 1989. A comparison of three indirect methods for estimating average levels of gene flow. Evolution. 43:1349-1368. [ Links ]
Yeh, F.C., Boyle, T., Yang, R. 1999. POPGENE version 1.31. A microsoft window based freeware for population genetic analysis. University of Alberta, Edmonton, AB, Canada. [ Links ]
Zahedy, Z. 2004. Investigation of polymorphism on some microsatellite markers in Baluchi sheep. M. Sc. Dissertation, Agricultural Faculty of Tarbiat Modares University, Tehran. (In Farsi). [ Links ]
Zhang, X.Y., Zhou, M.L., Zhang, X.H., Wu, D.J. 2009. Study on population genetic structure of Liangshan semi-wool sheep using microsatellite markers. Pakistan Journal of Biology Science. 11:2423-2427. [ Links ]

