


Servicios Personalizados
Revista
Articulo
 Inglés (pdf)
 Artículo en XML
 Referencias del artículo
 Enviar artículo por email
Indicadores
-
 Citado por SciELO
 -
 Accesos
Links relacionados
-
 Similares en
SciELO
Similares en
SciELO
Compartir

 Permalink
Tropical and subtropical agroecosystems
versión On-line ISSN 1870-0462
Trop. subtrop. agroecosyt vol.14 no.2 Mérida may./ago. 2011
Estudios sobre agroecosistemas
Competitiveness of Nigerian rice and maize production ecologies: a policy analysis approach
Competitividad de los sistemas de producción de maíz y arroz en Nigeria: un enfoque de análisis de políticas
Agatha Osivweneta Ogbe1, Victor Olusegun Okoruwa1* and Olaide Jelili Saka2
1 Department of Agricultural Economics, University of lbadan, Nigeria *Corresponding Author (agathaogbe@yahoo.com; vokoruwa@gmail.com)
2 Institute of Agricultural Research and Training, P.M.B.5029, Moor Plantation, Ibadan, Nigeria (saka_sakang@yahoo.com)
Submitted December 05, 2010
Accepted January 14, 2011
Revised received January 14, 2011
Abstract
This study assesses the competitiveness of Nigerian rice and maize production ecologies using the policy analysis matrix (PAM) on a sample of 122 farmers. Results of the PAM revealed that outputs from the production ecologies are taxed. This is further confirmed by the Effective protection coefficient (EPC) and Subsidy ratio to producers (SRP) values, however, the production ecologies are subsidized on the use of tradable inputs. The production ecologies show a strong competitiveness at the farm level (under irrigated rice, upland rice and upland maize) and a strong comparative advantage. Sensitivity analysis indicated that a 50 percent increase in output and a 13.3 percent depreciation of the domestic currency will increase competitiveness and comparative advantage of rice and maize production in all ecologies. The study recommends that government should ensure a level of policy stability in the rice and maize sectors, assist farmers with irrigated water scheme to ensure constant water supply, and increase the level of output through provision of improved seed varieties.
Key words: Competitiveness; rice and maize; production systems; policy analysis matrix; Nigeria.
Resumen
Se evaluó la competitividad de la producción de maíz y arroz en Nigeria empleando la matriz de análisis de políticas (PAM) en una muestra de 122 productores. Los resultados del análisis PAM revelaron que los productos de los sistemas de producción son sujetos a impuestos. Esto fue confirmado por el coeficiente de protección efectiva y la tasa de subsidio a los productores, sin embargo los sistemas de producción son subsidiados en el uso de insumos sujetos a mercado. Los sistemas de producción mostraron una gran competitividad a nivel de sistema (arroz con riego, arroz y maíz en altiplano) y una fuerte ventaja comparative. El análisis de sensitividad indicó que un incremento de la producción en 50% y una depreciación de 13.3% de la moneda local incrementaría la ventaja competitive del maíz y arroz en todos los sistemas de producción. El estudio permite recomendar que el gobierno debería asegurar políticas de estabilidad en los sectores productivos de maíz y arroz mediante la asistencia a los productores con sistemas de irrigación e incrementar los niveles de producción mediante la distribución de semillas de variedades mejoradas.
Palabras clave: Competitividad; arroz; maíz; sistemas de producción; matriz de análisis de políticas; Nigeria.
INTRODUCTION
Nigeria is traditionally an agrarian country and agriculture remains the mainstay of the Nigerian economy. It employs about 70 percent of labour force, providing the bulk of its own food needs, feed and export a wide variety of agricultural goods such as cocoa, rubber among other cash crops (Kwanashie, et al, 1998; Iwe, 2004; Eyo, 2008; Odusina, 2008). The food sub-sector of the Nigerian agriculture provides a wide varieties of staple food crops ranging from cereals, legumes, tubers and others. Of all the staple food crops, cereals (of which rice and maize belong) has risen to a position of pre-eminence (Akande, 2002; UNEP, 2005).
Rice is an important staple food for about half of the human race constituting a major part of the diet in many countries with 33 to 49% of the world population depends on rice for its main diet. The West African sub-region accounts for 56% of the total production in Africa, and Nigeria alone contributes 23% of this amount (Kehinde, 1999). The production of rice is done primarily by smallholder farmers who have limited capital resources, and producing on the average 4.6 tons of paddy per year from an annual crop area of 3.3 hectares (Erenstein, et al., 2004; Daramola, 2005). Rice cultivation is widespread within the country under five production systems (or ecologies) classified as rain-fed upland, rain-fed lowland, irrigated lowland, deepwater and mangrove swamp accounting for 30%, 47%, 17%, 5% and 1% of the total rice areas respectively (Akpokodje et al 2001; Daramola, 2005; Imolehin and Wada, 2000). The level of domestic rice production in Nigeria is about 3 million metric tons while the domestic demand for rice is about 5 million metric tons which has led to a huge gap of about 2 million metric tons annually thereby motivating the continued dependence on importation to fill the existing gap (Akande, 2002; Erenstein, et al, 2004; Amaza and Maurice, 2005; Daramola 2005, Awe, 2006).
In the same vein, maize, an annual plant with high productivity enjoys exceptional geographic adaptability, an important property which has helped its cultivation to spread throughout the world. Along with rice and wheat, maize is one of the three most important cereal crops in the world. In Nigeria, maize is grown in all ecological zones especially being cultivated in the rainforest and derive savanna with a domestic production level of 2.0 million metric tons and domestic demand of about 3.5 million metric tons (Tijani and Osotimehin, 2007). It is a staple food of great socio- economic importance and has been in the diet of Nigerian's for centuries. It started as a subsistence crop and has gradually become an important crop which now has risen to a commercial crop on which many agro - based industries depend on as raw materials (Iken and Amusa, 2004). It account for about 43 % of calorie intake and it is one of the major cereal consumed by nearly all Nigerian households either fresh or processed (Nweke, 2004). With regards to food, it is generally accepted as a good source of energy for man and livestock because of its great dietary and economic importance. Processed maize is consumed in several ways such as 'tuwo', and pap - 'ogi', 'Eko' (wrapped semi- solid pap), it can also be eaten roasted or boiled, or can be cooked along with beans. In some local areas, it can be pounded along with yams, cocoyam and water-yams. It is rich in carbohydrates, starch, protein, fats among other food nutrients which make it an important good and reliable source of food, energy and industrial raw material (Olowa and Olowa, 2010). As a result of the economic importance and various domestic uses, there has been an increase in it demand.
The Nigerian economy was self-sufficient in food production (including rice and maize production) up till the 1960's. At independence in 1960, rice was merely a festive food consumed mostly in affluent homes during festive periods (Akande, 2002; UNEP, 2005). However, the status of rice in the average diet has been transformed from being a luxury food item to that of a staple taking the place of maize, cassava, yam among other staples (Daramola, 2005). In addition, from 1970 till data, rice consumption has risen tremendously a result of the accelerating population growth rate, increasing per capita consumption leading to an increase in domestic demand over domestic supply, rapid urbanization and associated changes in family occupation structure (Akande, 2002; Daramola, 2005; UNEP, 2005; Lancon and David-Benz, 2007). Along with rice, maize is also an important cereal in Nigeria. Since the 19th century, maize has become the prime source of grain for feeding monogastic animals especially in those parts of the country where cassava cannot be grown (Guy R., 2001). Apart from animal feeding, it is a major agro-allied industrial raw material from which many products are manufactured especially as ingredient in infant food brewery. The livestock industry consumes more than half of the total annual maize production (Babatunde and Oyatoye, 2005). As a result of the different uses into which maize can be put, there has been an increase in its demand over the years. Akande (1994) reported that the domestic demand of 3.5 million metric tonnes far outstripped domestic production of 2.0 million metric tonnes. In order to fill the gaps existing in the rice and maize industries, the Nigerian government has at various times embarked on several policies (such as ban, tariffs, quantity restriction (quotas)) and programmes directed primarily towards increasing self-sufficiency in their production with the most recent being the "Presidential initiative" targeted at crops like rice maize and cassava. The success of these efforts however depends to a large extent on the competitiveness of the domestic maize and rice production. This study therefore explores the production scenario of the two commodities with a view of determining; the competitiveness and the level of protection received by producers of these two important crops in Nigeria.
MATERIALS AND METHODS
Analytical framework
The policy analysis matrix (PAM) is a computational framework developed by Monke and Pearson (1989), and augmented by Masters and Winter-Nelson (1995) as a result of developments in price distortion. PAM's approach is based on estimation of budgets using market prices and social opportunity cost and it is used to measure efficiency in production, comparative advantage and the degree of government intervention (impact of policy) on commodity production. It is a product of two accounting identities (Table 1). The first identity defines profitability as the difference between revenues and costs, measured in either private or social terms. The second identity measures the effects of divergence (distorting policies and/or market failures) as the difference between observed private values and social values that would prevailed if divergence were removed. There are two types of profits—private profits evaluated at market prices and social profits evaluated at social or efficiency prices. If there are no market distortions, the two are often the same. If, however, there are market failures or distortions then the two diverges from one another. Their divergence acts as a signal for policy intervention.
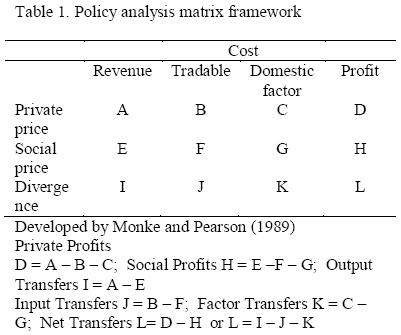
The data in the first row of the PAM framework provide a measure of private profitability, defined as the difference between observed revenue and cost. This captures the competitiveness of the agricultural system given current technologies, prices of input, output values and policy transfer. The second row of the PAM is used to measure social profit which is calculated at shadow price. The social profit reflects social opportunity costs and it measure efficiency and comparative advantage. A positive social profit indicates that the system uses scarce resources efficiently and contributes to national income (Nelson and Panggabean, 1991; Keyser, 2006). A negative social profit indicates social inefficiencies and suggests that production at social costs exceed the costs of import, thus indicating that the sector cannot survive without government intervention at the margin. The final row of the matrix represents transfers that come into play due to policy-induced market distortions. This captures the divergences between the first row (measured at private prices) and the second row (measured at social prices). The difference between private and social values of costs, revenues and profits can be explained by policy interventions (Mohanty, et al., 2003; Wiendiyati, et al, 2002; Esmaeili, 2008). Several important indicators such as the nominal protection coefficient (NPC), effective protection coefficient EPC), domestic cost ratio (DRC), subsidy ratio to producer (SRP), private cost ratio (PCR), profitability coefficient (PC) which are useful in asserting the level of competitiveness between crops or production systems can be calculated from the PAM framework (See Monke and Pearson 1989; Masters and Winter-Nelson 1995 for details on how these indicators are estimated).
Data and modeling assumption
The study made use of data collected by Okoruwa ae al (2007) from a sponsored (by IITA-WA SAKSS and WARD A) study they conducted in three of Nigeria's agro - ecological zones: the lowland, upland and irrigated ecologies in 2006. Three states were selected on the basis of their prominence in the production of rice and maize under the different production ecologies: Kano (irrigated rice and maize), Niger (lowland rice and upland maize) and Ekiti (upland rice) with a total of 122 farmers. The study made used of data for yields, input use, market and farm gate prices of inputs and outputs. Information on transportation cost, port charges, storage costs, production subsidy import/export tariffs and exchange rate which were obtained from the National Bureau of Statistics (NBS) and the Customs Department were also use to calculate social prices.
The PAM constructed for this study made use of farm budget values (sales revenue and input cost) obtained for the three production systems (irrigated, upland and lowland) considered for assessment. Further estimations in the PAM were based on World reference price and subsidized prices, and these were used as reference prices for computing social prices for output and input respectively. The US FOB Gulf price and the Thailand FOB price were used as reference prices for rice and maize respectively. The world prices were adjusted for transportation cost to be comparable with farm gate price. For imported commodities, social prices at the farm gate were calculated by adding transportation cost, port charges, tariffs to the respective CIF price (calculated by adding ocean freight charges to FOB price) in domestic currency. The social price of land is the opportunity cost of land. The opportunity cost of land in this study was taken to be the net return (profit) of the competing crop production system. The opportunity cost of land for rice production is therefore the net return (profit) that would be earned from the next best alternative production system. Following Yao (1993) the social valuation of labour was obtained by dividing labour into peak-season and off-peak season components. The wage rate in the peak-season is the opportunity cost of labor for the period considered and the opportunity cost of labour in the off peak season is half the prevailing wage rate. With this, social price of labour is calculated by:
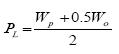
PL = Social price of labour; Wp = prevailing wage rate in peak season; Wo = prevailing wage rate in off peak season
Another important component of this analysis is the disaggregation of input into two categories: tradable and non-tradable. The tradable inputs include fertilizers, seeds, fungicides, pesticides, insecticides herbicides and irrigation fees. The non-tradable inputs include land, labour, tractor and sprayer service, capital and simple farm tools and implements.
RESULTS AND DISCUSSIONS
Level of profitability and divergences in the production systems
Table 2 presents the level of profitability and divergences in the production ecologies. The table reveals that production of rice and maize was socially profitable in all the ecologies but earned private profit only in upland and irrigated (with the exception of irrigated maize ecology) ecologies. However, the result shows that irrigated rice and maize ecology was more profitable than other systems/ecologies (upland and lowland). At the margin, the result indicates a positive private profit for upland rice, irrigated rice and upland maize, and negative private profit for lowland rice and irrigated maize. The positive private profit implies that upland rice, irrigated rice and upland maize ecologies are competitive given current technologies, prices of inputs and outputs, and policy and that producers are earning supernormal return. This can further be confirmed from their PCR values in Table 3 which were less than unity. Conversely, lowland rice and irrigated maize ecologies were unprofitable and lack competitiveness given current technologies, inputs and output prices and policy due to their negative profitability and PCR that were greater than unity (Table 3).
On the other hand Table 2 indicates a positive social profit for rice and maize production in all the ecologies. This implies that the ecologies utilize scarce resources efficiently in the production of both commodities and that the ecologies can survive without government interventions at the margin. There was however, a negative divergence between private and social profits in all the ecologies thus suggesting that the net effect of policy intervention reduced profitability of rice and maize production at the farm level in all the ecologies which is detrimental to producers.
Ratios of protection coefficient and competitiveness of rice and maize production
The summary of ratios of protection coefficient and competitiveness of rice and maize production in the ecologies are present in Table 3. The table shows an NPCO coefficient values of less than unity indicating that domestic farm gate price is less than the international price for rice output and that policies were decreasing the market price to a level of approximately 93%, 92%, 79%, 83% and 90% below the international price for rice and maize ecologies respectively. This suggests that production in the various ecologies are not protected by policy and that substantial output tax applies. NPCI values of less than unity indicate that the input costs in all the production systems/ecologies are lower than the world reference price. Based on indicators in Table 3, the cost of tradable inputs were found to be lower than the world prices by 34%, 91%, 90%, 64% and 16% for the inputs under lowland, irrigated and upland production ecologies of rice and maize respectively. Thus suggesting that government policies were reducing tradable inputs cost for rice and maize production in all the ecologies.
The EPC which reveals degree of protection accorded to the value added process also had values less than unity for all ecologies and as such so indicating that producers were not protected through policy intervention on value added processes, and that producers face net tax of 79%, 92% and 94% for the respective rice ecologies and 84% and 92% for maize ecologies. Similarly, the DRC coefficients for all production ecologies were also less than unity, thereby indicating that the value of domestic resources used in production is lower than the value added. This implies an efficient use of domestic resources in rice and maize production and that production in all the ecologies were socially profitable. Consequently, Nigeria has a comparative advantage in rice and maize production. For both crops, the upland ecology was relatively more profitable in terms of use of domestic factor owing to their lower DRC value of 0.0741 and 0.0681 for both rice and maize respectively. The social benefit cost (SCB) coefficient which is another measure for assessing efficiency in the use of fixed factor also confirmed the DRC value obtained on efficiency in the use of domestic factors in all the ecologies.
Subsidy ratio to producer (SRP) is said to indicate the level of transfers from divergences as a proportion of undistorted value of the system revenue (Monke and Pearson, 1989). Hence, if market failures are not an important component of the divergence, then SRP shows the extent to which a system's (ecology) revenue have been increased or decreased because of policy. Table 3 indicate a negative SRP value for all the production systems which shows that 78%, 81% , 87% (in the case of rice ecologies), 71% and 81% (for maize ecologies) of the divergences are used to subsidize other commodities. This suggests that there is decrease in gross revenue of the ecologies and hence further confirms that the ecologies were taxed by policy.
To measure the competitiveness of unlike ecologies and show how much the ecologies can afford to pay domestic factors (including a normal return to capital) and still remain competitive the private cost ratio (PCR) was estimated. As indicated in Table 3, the PCR value of lowland rice and irrigated maize ecologies are greater than one while those of irrigated rice, upland rice and upland maize ecologies were less than unity. The implications are that whereas the lowland rice and irrigated maize ecologies lack competitiveness at the current level of technology and policy intervention, ecologies of irrigated rice, upland rice and upland maize productions were competitive at the current level of technology and policy intervention. However, the irrigated rice production system appeared to be more competitive than the other two competitive ecologies (ie. upland rice and maize ecologies). The profitability coefficient (PC- measures policy incentive as an estimation of net policy transfer) also showed a mixed indication net transfers. Whereas negative net transfers were observed for lowland rice and irrigated maize ecologies, positive net transfer were observed for irrigated rice, upland rice and upland maize production ecologies. The observed PC values suggests a negative net transfer payment of about 98% each for both lowland rice and irrigated maize production ecologies and a positive net transfer payment of about 93%, 89% and 92% for irrigated rice, upland rice and upland maize production ecologies respectively.
For ease of comparison between production ecologies (with the exception of lowland ecology for which data was not available for maize), a ranking of the various indicators of comparative advantages was done and the results are provided on Table 4. Using the EPC, SCB and DRC ratios as indicators of comparative assessment, the table shows that the rice producers were less taxed by policy for value added (EPC) than maize producers under the two ecologies. Similarly, the upland ecology appeared to be less taxed by policy than the irrigated ecology. This suggests that in terms of protection, both rice production and upland ecology have comparative advantage over maize production and irrigated ecology. The SCB coefficient on the other hand, indicates that upland production ecologies (especially that of maize) have more return to fixed factor than the irrigated production ecologies. In similar vein the DRC ratios also indicates that the upland ecology (especially that of maize) enjoys strong comparative advantage the irrigated ecology.
Sensitivity analyses on comparative advantages
The PAM approach has been criticized because of its static nature and the results are consider by some to be unrealistic in a dynamic setting (Nelson and Pangabean, 1991). In order to solve this problem, the study embarked on sensitivity analysis under several assumptions. Following Yao (1997) and Monhanty et al, (2003), the analyses were conducted to test whether the result would be affected or altered by changes in CIF price, farm gate price, output and exchange rate valuation, the following underlying assumptions. In the first scenario, CIF price was increased by 20% and also decreased by the same proportion. The results showed that these change did not affect the comparative rankings of rice and maize production ecologies. Similar analyses were conducted by changing farm gate prices up and down by 20%. These changes did not equally affect or alter comparative ranking regardless of the ecology. However, protection coefficients such as NPCO and EPC changed with either and increase or decrease in farm gate price respectively regardless of the ecologies (See Tables 1A to IE in the Annex).
A 50% increase in the level of output would favour rice and maize farmers regardless of the ecology, as private profit increases. Since private profit increase, competitiveness of rice and maize farmers also increased irrespective of the ecology. This can be observed from the PCR values of rice and maize production which are less than unity irrespective of the ecology.
The appreciation of the Naira against the US$ (e.g.,  150/US$ to 130/US$) would relatively disadvantage rice and maize regardless of the ecology. The stronger the Naira against the US$, the weaker the comparative advantage, and the weaker the Naira against the US$ (e.g., 150/US$ to 170/US$), the stronger the comparative advantage irrespective of the ecology. This conform to Wiendiyati et al, (2002) on soybean production in which the appreciation of the Rupiah against the US$ indicated a weaker comparative advantage and a depreciation of the Rupiah against the US$ indicated a stronger comparative advantage. This implies that the appreciation of a domestic currency against the world reference currency (the US$) leads to weak comparative advantage and a depreciation of a domestic currency against the world reference currency, leads to strong comparative advantage. In other words, overvaluation of exchange rate reduces the competitiveness of the local producers in international markets because they are practically taxed. However, depreciation of exchange rate increases the competitiveness of the local producers in international market because they are been subsidized.
CONCLUSION
The production of rice and maize in all the ecologies are economically efficient and maintained a comparative advantage. But the prevailing price structure discriminate growing the crop as shown by the negative private profitability in the lowland rice and irrigated maize ecologies, indicating lack of competitiveness at the farm level. The findings of the study express the need for the removal of policy distortions to increase the incentive for producers to expand production. The incentive structure indicates that government through its macroeconomic and sectoral policies tend not to protect local producer and thus not enhancing output. The study also shows that the production systems are efficient in upland rice, irrigated rice and upland maize thereby justifying the need for intensified effort and policy attention on irrigated rice production if Nigeria is going to attain serf sufficiency in the production of rice.
REFERENCES
Akande, S.O. 1994. Comparative Cost and Return in Maize Production in Nigeria. Nigeria Institute for Social and Economic Research (NISER) individual Research Project Report, Ibadan, NISER. Pp1-35 [ Links ]
Akande, T. 2002. An Overview of the Nigerian Rice Economy, Monography Series. Nigerian Institute of Social and Economic Research (NISER) Ibadan, 11pp. [ Links ]
Akpokodje, G., Lancon, F., and Erenstein, O. 2001. Nigeria's Rice Economy: State of the Art. Project Report - The Nigerian Rice Economy in A Competitive World: Constraints, Opportunities and Strategic Choices. Bouake, WARDA. ii - 57pp. [ Links ]
Amaza, P.S. and D.C. Maurice. 2005. Identification of Factors that Influence Technical efficiency. Paper Presented at Workshop on Policies and Strategies for Promoting Rice Production and Food Security in Sub-Sahara Africa 7-9 2005. Cotonou (Benin). [ Links ]
Awe, O. 2006: Ban on Rice Importation Depresses Global Trade. Punch 2006, May 20. [ Links ]
Babatunde, R.0 and Oyatoye, E.T.O. 2005: Food Security and Marketing Problems in Nigeria: The Case of Maize Marketing in Kwara State. The Global Food and Product Chain-Dynamics, Innovations, Conflicts, Strategies, Proceedings of Tropentag 2005, Tielkes, E., Hulsebusch, C, Hauser, I., Deininger, A. and Becker, K. (eds.) 475-484. [ Links ]
Daramola, B. 2005. Government Policies and Competitiveness of Nigeria Rice Economy. Paper Presented at the 'Workshop on Rice Policy and Food Security in Sub-Sahara Africa' organized by WARDA, Cotonou, Republic of Benin, November 7-9 2005. [ Links ]
Erenstein, O., Lancon, F., Osiname, O. and Keddeh, M. 2004. Operationalising the Strategic Framework for Rice Sector Revitalisation in Nigeria. Project Report - The Nigerian Rice Economy In A Competitive World: Constraints, Opportunities and Strategic Choices. Abidjan, WARDA - The Africa Rice Centre, ii - 38pp. [ Links ]
Esmaeili, A. 2008. Measuring Competitiveness of Shrimp Farming in Southern Iran: Using Pam Approach World Applied Sciences Journal 4: 724-729. [ Links ]
Eyo, E. O. 2008. Macroeconomic Environment and Agricultural Sector Growth in Nigeria. World Journal of Agricultural Sciences 4: 781-786. [ Links ]
Fang, C and Beghin .1999. Food self - sufficiency, comparative advantage and agriculture trade: A policy analysis matrix for Chinese Agriculture. Card working paper no 99-Wp223, 29pp [ Links ]
Guy, R. 2001. The Tropical Agriculturist Maize Technical Centre for Agriculture and Rural Cooperation (CTA), Macmillan Publishers. [ Links ]
Iken, J.E and Amusa, N.A. 2004. Maize Research and Production in Nigeria. African Journal of Biotechnology. 3: 302-307. [ Links ]
Imolehin ED and AC Wada. 2000. Meeting the rice production and consumption demands of Nigeria with improved technologies. International Rice Commission Newsletter Vol. 49: 33-41. FAO Corporate Document Repository. [ Links ]
Iwe, M. O. 2004. Stagnation of Nigerian Agriculture-A Case of The Neglect of The Food Processing Sector. Journal of Agriculture and Food Science. 2: 155-159. [ Links ]
Kehinde I.K. 1999. Agronomy of upland and lowland rice in Nigeria, paper presented at the special rice production project (SRPP) held at APMEU, Kaduna, 26-28 April, 1999. In Udoh, E.J. and Omonona, B.T. Adoption and welfare impact of improved rice varieties on rural farming households in Akwa Ibom state of Nigeria. A paper presented at Africa Rice Center (WARDA). 2008. P Kormawa and AA Touré (eds). Rice Policy and Food Security in sub-Saharan Africa. Proceedings of a workshop held on 7-9 November 2005, Cotonou, Benin. Cotonou, Benin: Africa Rice Center (WARDA). 418 pp. [ Links ]
Keyser, J.C. 2006. Description Of Methodology And Presentation Of Templates For Value Chain Analysis. Part 1: Narrative Text. Background paper for the Competitive Commercial Agriculture in Sub-Saharan Africa (CCAA) Study. [ Links ]
Kwanashie, M., Ajilima Land Garba, A. 1998. The Nigerian economy: Response of agriculture to adjustment policies. AERC Research Paper 78 African Economic Research Consortium, Nairobi. [ Links ]
Lançon, F., and David-Benz, H. 2007. Rice Imports in West Africa: Trade Regimes and Food policy formulation. Pro-poor development in Low Income Countries. Food, Agriculture, Trade and Environment. [ Links ]
Masters, W.A. and Winter-Nelson, A. 1995. Measuring the Comparative advantage of agricultural activities: domestic resource costs and the social cost-benefit ratio. Am. J. Argic. Econ.77: 243-50. [ Links ]
Mohanty, S., Fang, C. and Chaudhary, J. 2003. Assessing Competitiveness of Indian Cotton Production: A Policy Analysis Matrix Approach. The Journal of Cotton Science.7: 65-74. [ Links ]
Monke, E. and Pearson, S. 1989. The Policy Analysis Matrix for Agricultural Development. Cornell UniversityPress. Ithaca, and London. [ Links ]
Nelson, G.C. and M. Panggabean. 1991. The Cost of Indonesian Sugar Policy: A Policy Analysis Matrix Approach, Am. J. Agri. Econ., 73: 703-712. [ Links ]
Nweke, F. 2004. New Challenges In The Cassava Transformation In Nigeria And Ghana. EPTD Discussion Paper No. 118. Environment And Production Technology Division. International Food Policy Research Institute 2033 K Street, NW. Washington, D.C. 2006 USA. In: Alabi, R. A and Esobhawan, A.O.(2006): Relative Economic Value Of Maize- Okra Intercrops In Rainforest Zones, Nigeria. Journal of Central European Agriculture. 7: 433-438. [ Links ]
Odusina, O.A. 2008. Urban Rice Demand Analysis: A case Study of Ijebu-Ode Township. Middle-East Journal of Scientific Research 3:62-66. [ Links ]
Olowa, O.W and Olowa, O.A. 2010. Sources of Technical Efficiency among Smallholder Maize Farmerd in Osun State of Nigeria. Research journal of Applied Science 5: 115-122. [ Links ]
Okoruwa V. O., Rahji, M. A. Y and Ajani, O. 2007. Rice and Maize Stratification Project in Nigeria. Technical Report sponsored by IITA-WA SAKSS, WARDA and USAID. [ Links ]
Tijani, A.A and Osotimehin, K.O. 2007. Economics of Pesticides Use among Maize Farmers in Edo State, Nigeria. Research Journal of Agricultural Biological Sciences, 3: 129-132. [ Links ]
UNEP. 2005. Integrated Assessment of the Impact of Trade Liberation. A Country Study on the Nigerian Rice Sector. ISBN 92-807-2450-9. [ Links ]
Wiendiyati ,Umbu Reku and Raya Paulus Un. 2002. The Impact Of Tariff Policy And Inter-Island Transport Cost On The Profitability Of Soybean Production In Ngada Regency, NTT Faculty of Agriculture Nusa Cendana University. [ Links ]
Yao, S. 1993. Policy Analysis Matrix. The major crops of Pakistan. Report for Food and Agriculture Organization of the United Nations and the Ministry of Agriculture of the Pakistan Government. In: Productive Sector Growth and Environment Office of Sustainable Development Bureau for Africa U.S Agency for International Development (1999): Analysis of the Comparative Economic Advantage of Alternative Agricultural Production Options in Tanzania. Final Report. Technical Paper No. 102. [ Links ]

