


Servicios Personalizados
Revista
Articulo
 Inglés (pdf)
 Artículo en XML
 Referencias del artículo
 Enviar artículo por email
Indicadores
-
 Citado por SciELO
 -
 Accesos
Links relacionados
-
 Similares en
SciELO
Similares en
SciELO
Compartir

 Permalink
Revista mexicana de ciencias farmacéuticas
versión impresa ISSN 1870-0195
Rev. mex. cienc. farm vol.42 no.4 Ciudad de México oct./dic. 2011
Trabajo científico
The evaluation of peptide/histidine transporter 1 (PHT1) function: uptake kinetics utilizing a cos-7 stably transfected cell line
David J. Lindley, Stephen M. Carl, Stephanie A. Mowery and Gregory T. Knipp*
Department Industrial and Physical Pharmacy, College of Pharmacy, Nursing and Health Sciences, Purdue University.
Correspondencia
* Gregory T. Knipp, Ph.D.
Department of Industrial and Physical Pharmacy
College of Pharmacy
Purdue University
575 Stadium Mall Dr.
West Lafayette, IN 47907-2091
Phone: 765-494-3765
Fax: 765-494-6545
E-mail: gknipp@purdue.edu
Fecha de recepción: 17 de agosto de 2011.
Fecha de recepción de modificaciones: 4 de octubre de 2011.
Fecha de aceptación: 5 de octubre de 2011.
Abstract
There have been relatively few studies focused on the proton-dependent oligopeptide transporter (POT) superfamily member, Peptide/Histidine Transporter 1 (PHT1), with respect to its contribution to the ADME of peptides and peptide-based drugs. These studies were conducted to determine hPHT1-mediated, H+-dependent uptake kinetics of histidine, carnosine, Gly-Sar and valacyclovir in stably transfected hPHT1-COS-7 cells comparative to kinetics determined in an empty vector (Mock) stably transfected cell line. The results suggest that Gly-Sar appears to be a substrate for PHT1 based on efflux from the stably transfected hPHT1 COS-7 cells. Histidine and Gly-Sar concentration- and time-dependent studies suggest mixed-uptake kinetics. These studies suggest that stably transfected hPHT1-COS-7 cells exhibit different uptake kinetics than those observed in our previous studies and illustrate the requirement for experiments to delineate the physiological role of hPHT1.
Key words: proton-dependent oligopeptide transporter, peptide/histidine transporter 1, PHT1, COS-7 cells, stable transfection, peptide transport, transporter screening.
Introduction
The proton-dependent oligopeptide transporter (POT) superfamily (SLC15A) is comprised of several transporter isoforms that utilize a proton-dependent mechanism for the transmembrane transport of primarily di- and tripeptide-based substrates.1,2 The majority of POT isoform characterization studies have focused on PepT1 (SLC15A1) and PepT2 (SLC15A2), which have been widely demonstrated to actively partake in the influx of numerous peptide-based therapeutic agents, as reviewed previously.1-4 Two additional POT members, the Peptide/histidine transporters, PHT1 (SLC15A4) and PHT2 (SLC15A3), and their splice variants were recently identified in rats (rPHT1 and rPHT2) and humans (hPHT1 and hPHT2).1,5,6 However, little is known regarding their tissue specific expression patterns, molecular and functional characteristics, and cellular localization.7
Initially, the rat PHT1 isoform (rPHT1) was cloned from a rat brain cDNA library and was found to be 2751 bp long with an open reading frame of 1719 bp.8 This gene encodes a 572 amino acid protein with a molecular weight of 64.9 kDa. Functional assessments in Xenopus laevis oocytes revealed that rPHT1 exhibited a high affinity, H+-dependent histidine transport activity, which reached a maximum capacity at pH 5.5.8 Histidine uptake was further characterized as saturable (Km=17 μM) and Na+-independent. Further studies suggested that rPHT1-mediated histidine uptake could be inhibited by di- and tri-peptides. However, histidine uptake was not inhibited by other free amino acids such as glutamate, glycine, leucine, methionine and aspartate. These studies also demonstrated rPHT1 affinity for the dipeptide carnosine (β-alanyl-histidine).8
In order to gain insight into hPHTFs physiological relevance our laboratory amplified the hPHT1 cDNA sequence from the human placental choriocarcinoma BeWo cells and Caco-2 cells using human expressed sequence tags, as predicted by both Botka et al and our laboratory.1,5,6,9 HPHT1 was found to be approximately 2.7 kb long with 577 predicted amino acids, a molecular weight of 62 kDa, and a predicted pI of 9.2.1,6
The functional characterization of hPHT1 was first attempted in an hPHT1-transiently transfected COS-7 (a non-polarized simian kidney origin) cell line using the pcDNA3.1-V5&His expression vector from Invitrogen (Carlsbad, CA).9 Our laboratory has used this expression vector previously to delineate the function of hPepT1.10-12 Consistent with the functional characteristics of the rPHT1 orthologue,9 hPHT1 mediated the H+-dependent, Na+-independent uptake of histidine and carnosine.9 In addition, histidine uptake was further demonstrated to be inhibited by a variety of di- and tripeptides. Moreover, valacyclovir, the valine substituted amino acid prodrug of acyclovir, also appeared to be a substrate for hPHT1 in these studies, whereas Gly-Sar did not demonstrate affinity for hPHT1.9
These studies describe the establishment of an hPHT1 stably transfected COS-7 cell line (COS-7/hPHT1) to corroborate the transient transfection data discussed above and provide a model to further investigate hPHTFs potential impact on the ADME of related histidyl-like and peptide-based substrates. This work was also performed due to the fact that transiently transfected systems typically suffer from a number of limitations comparative to their stable counterparts including: 1) They are less rigorous than stably transfected cells due to a broad variability in transgene expression that results from inconsistencies in transfection efficiency; 2) The evaluation of the transfection efficiency can be quite laborious and difficult to reproduce; and 3) High quantities of amplified plasmids are typically required to achieve suitable rigor for drug screening purposes. In contrast, stably transfected cell lines enable selection for transgene expression, allowing direct correlation of expression to function.10-12
Material and method
Materials
TRIzol® reagent for RNA extraction, the TOPO-pcDNA3.1-V5&His plasmid, Lipofectamine 2000®, G418 solution, the V5-epitope monoclonal antibody and Positope control protein were obtained from Invitrogen (Carlsbad, CA). Dulbecco's Modified Eagle Medium (DMEM), fetal bovine serum (FBS), penicillin-streptomycin solution, trypsin and Phosphate Buffered Saline (PBS) were obtained from Mediatech (Manassas, VA). Radiolabeled compounds were obtained from Moravek Biochemicals (Brea, CA). The AffinityScript® QPCR cDNA Synthesis kit and Brilliant II® SYBR® Green QRT-PCR Master Mix were obtained from Stratagene (La Jolla, CA). All other chemicals, reagents and DNA purification kits were obtained from Sigma Chemical Company (St. Louis, MO).
Cell Culture
COS-7 cells were obtained from and cultured under the protocol as described by ATCC (CRL-1651). Briefly, the cells were maintained in culture medium comprised of DMEM that was supplemented with 10% FBS and penicillin-streptomycin. Cells were trypsinized and passaged every 3-4 days at 80-90% confluence. Cells were cultured at 37°C under 5% CO2 and 90% relative humidity, as described previously.9
Stable Transfection
The empty pcDNA3.1-V5&His (Mock) and pcDNA3.1 -hPHT1 - V5&His (hPHT1) vector plasmids were amplified from previously prepared glycerol stocks9 and purified using the GeneElute Mini-prep kit from Sigma Chemical Company. Prior to transfection, the amplified plasmid identities were confirmed by restriction enzyme digestion with subsequent sequence analysis. The COS-7 cells were then transfected following the Lipofectamine 2000® protocol, using the Mock and hPHT1 plasmid vectors as described previously. 9,10
Briefly, COS-7 cells were seeded on to 24 well, tissue culture treated plates at a density of 5 x 10⁴ cells/cm2. On the second day post-seeding, 0.8 μg of each respective plasmid was mixed with 2.0 μL of Lipofectamine 2000® diluted in OPTI-MEM® transfection media. The media was removed the following day and replaced with fresh culture media adjusted to contain 20% FBS to promote growth (growth medium). Cells were then passaged two days post transfection into a T-25 culture flask. Three days post-transfection, stable transfects were then selected by further supplementing the growth medium with 1.0 mg/mL G418 for the isolation of parental transfects that contained the plasmid of interest. The G418 concentration was predetermined to be above the lowest cytotoxic dose by a cytotoxicity-curve in the wild type COS-7 cells. One week post-transfection, the FBS was returned to 10% v/v and the cells were maintained under selective pressure (1.0 mg/mL G418, 0.4 mg/mL above the wild-type cytotoxic dose) throughout the remainder of the experiments. The parental transfects were amplified and all experiments were performed within 20 passages post transfection to minimize confounding effects resulting from expanded passaging.
Analysis of Transgene mRNA Expression
Total RNA was extracted from the COS-7/Mock and COS-7/hPHT1 stably transfected cells using the TRIzol® protocol. RNA integrity was verified prior to any expressional analysis. Relative hPHT1 expression was determined utilizing an optimized, two-step SYBR®-based qRT-PCR reaction scheme, according to the manufacturer's protocol (Stratagene). Briefly, the cDNA's were first generated from total cellular RNA with the AffinityScript® qRT-PCR cDNA Synthesis kit, as recommended by the manufacturer (Stratagene). Total hPHT1 expression was determined using gene-specific primers for hPHTl (Forward: CCAACATCACGCCCTTCG (150 nM) and Reverse: ACAGTGGGGATCGCATAA (100nM)), and normalized to the GAPDH housekeeping mRNA (Forward: TTCGACAGTCAGCCGCATCTTCTT (175nM) and Reverse: GCCCAATACGACCAAATCCGTTGA (175nM)). Primers were designed using Primer3 software and SYBR-reaction conditions for each primer set were optimized for the annealing temperature (60oC) and primer concentrations according to the methodology recommended by Stratagene. The amplification temperatures/conditions were optimized to be as follows: denaturing for 3 minutes at 94oC followed by 40 cycles for annealing and extension of 94oC-1 min, 60oC-1 min, and 72 o C-1min. A dissociation curve according was also performed to confirm specific primer annealing. Threshold cycle (Ct) values were obtained using the optimized Brilliant II MasterMix protocol on a Stratagene Mx3000P® QPCR system. Amplification plots were analyzed using Stratagene's MxPro version 3.00 software. Results were calculated and presented as the ΔCt values after normalization to GAPDH expression.12
Total Protein Isolation
Total protein was isolated from the COS-7/Mock and COS-7/hPHT1 cells using a modified RIPA buffer. Briefly, cells were lysed in an isotonic radio-immunoprecipitation assay (RIPA) buffer containing 0.1% Triton-X and 1μg/mL protease inhibitor cocktail. Final protein concentration was determined by bicinchoninic acid (BCA) assay (Pierce Biotech).
Analysis of Transgene Protein Expression Using Western Blotting
Forty μg of the total protein cell lysate was electrophoretically separated on 10% SDS polyacrylamide gels in the COS-7/Mock and COS-7/hPHT1 transfected cells. Separated protein products were then electrophoretically blotted onto PVDF membranes. Membranes were then blocked with 5% powdered nonfat dry milk (NFDM) in TBST (1X tris-buffered saline (TBS) with 0.1% Tween20) and probed with a 1:200 dilution of a custom designed hPHT1 antibody (Invitrogen, Inc.) in 5% NFDM in TBST for 1 hour at room temperature and also probed on a separate blot with a monoclonal anti-V5 antibody (1:5000 dilution) directed against the V5-epitope attached to hPHT1. The Positope protein, containing the V5-epitope was added as a positive control in both studies. The blots were then washed 3X for 10 minutes with TBST. The blot was probed with an HRP-conjugated secondary antibody (1:5000) in 5% NFDM in TBST for 1 hour at room temperature. Blots were then incubated with the West Femto Supersignal Chemiluminescent Detection kit (Pierce Chemical Company) and the resultant immunoreactions were visualized using a Biorad ChemiDoc XRS chemiluminescent imaging system equipped with a 12-bit peltier cooled digital CCD camera. Data captured by the camera were analyzed using the Biorad QuantityOne Software Suite.
Uptake Studies
Uptake studies were performed as described previously.10,11 Briefly, the experiments were performed in triplicate two days post-seeding. On the day of the experiment, the cells were washed twice with buffered Ringer's solution (BRS; 15mM MES pH 5, 15mM MES pH 6, or 15 mM HEPES pH 7.4) and allowed to equilibrate for 15 minutes in BRS before use. Substrate solutions were then added at concentrations ranging between 0.01 to 50 mM for concentration-dependent studies and 0.01 mM substrate solutions at pH 5.0 for time and pH dependent studies. Cellular uptake was quenched by washing the cells 2x with ice-cold PBS. The cells were then lysed by adding 200 μL of 1% Triton X-100 per well. A 150 μL aliquot was used for scintillation counting and a 20 μL sample was used to standardize to total protein as determined by the Bicinchoninic acid (BCA) protein quantitation assay.
Concentration Dependency
COS-7/Mock and COS-7/hPHT1 stably-transfected cells were washed and then incubated for 10 minutes in pH 5.0 MES buffer with 0.01, 0.1, 1, 2.5, 5, 10, 20 and 50 mM, respectively, each with 1 μCi/ml [3H] histidine or [3H] Gly-Sar at 37°C. The incubation time was selected to be 10 minutes based on uptake linearity determined in the time-dependent studies.
pH Dependency
Cells were seeded as specified above under uptake studies. Cells were then incubated with 10 μM, 1 μCi/mL [3H] histidine,3H] carnosine, [3H] Gly-Sar, or [3H] valacyclovir at 37°C for 10 minutes at pH 5.0 or pH 7.4.
Calculations and Statistics
Calculations were performed and presented as uptake into the cells normalized to the total protein concentration per well. Each experiment was performed in triplicate. Uptake results for COS-7/Mock vs. COS-7/hPHT1 stably transfected cells were statistically contrasted using an unpaired, two-tailed student's t-test at a 95% confidence level to determine potential differences between data sets. Statistical significance was denoted in the figures using the following notations: * for a p ≤ 0.05, ** for a p ≤ 0.01, and *** for a p ≤ 0.001.
Results
PHT1 Transgene mRNA Expression Utilizing qRT-PCR
PHT1 mRNA transcripts were evaluated at initial and final passages in the COS-7/Mock and COS-7/hPHT1 stably transfected cells by quantitative real-time PCR (qRT-PCR). Results indicated an approximate 10 fold increase in the relative hPHT1 mRNA expression in the hPHT1 transfects compared to Mock at initial-passaging (Figure 1A). In addition, the relative expression levels and a ten-fold difference in PHT1 expression in the COS-7/hPHT1 cells comparative to COS-7/Mock transfects was conserved over the course of the functional studies, as evidenced by the expression levels observed post-experimentation (Figure 1B).

PHT1 Transgene Protein Expression Utilizing Western Blotting
In addition, to confirm protein expression of the transgene, we utilized a custom designed hPHT1 antibody from Invitrogen9 to confirm over-expression of the protein as well as a monoclonal V5 antibody that is specifically designed to react with the V5-eptitope tag that is translated and attached to the hPHT1 protein's C terminal end. The results of these studies are illustrated by Western Blotting in Figure 2 which demonstrates hPHT1 protein expression in the COS-7/Mock (M) and COS-7/hPHT1 (T) transfected cells. Figure 2A indicates higher hPHT1 protein expression in the COS-7/hPHT1 (T) cells utilizing the custom designed hPHT1 antibody. Wild-Type (WT) COS-7 RNA was used as a positive hPHT1 control. Figure 2B demonstrates that V5 expression was limited to the COS-7/hPHT1 (T) cells and not observed in the COS- 7/Mock (M) cells, indicating expression of the transgene in the COS-7/hPHT1 (T) transfected cells. V5-epitope expression was also confirmed at initial and final passaging of experimentation, demonstrating no apparent change, as in Figure 2B. A V5-epitope containing positive control, Positope protein (Invitrogen), was included in the gel to confirm hPHT1 transgene expression.10,11 Note that the overall hPHT1 expression observed in the COS7/hPHT1 transfects is indicative of both endogenous hPHT1 and transgene protein expression, while that in the COS7/Mock is indicative of only endogenous expression. GAPDH was used as a biological and loading control as indicated in both figures.

Uptake Studies
Uptake studies were performed in COS-7/Mock and COS-7/hPHT1 stably transfected cells, as described above. Histidine concentration-dependent uptake was performed using a 10 minute incubation period, based on linearity of uptake determined from time-dependent histidine uptake studies (data not shown). This concentration-dependent uptake data revealed that saturation occurred between 1 and 10 mM for both the COS-7/Mock and COS-7/hPHT1 transfected cells (Figure 3). It should be noted that we did not perform saturation kinetic studies in our earlier transient transfections studies due to the uncertainty surrounding transfection efficiency.9 Incubation with higher concentrations of histidine exhibited higher overall uptake in COS-7/Mock transfected cells comparative to the COS-7/PHT1cells, suggestive of either efflux or saturation at these higher concentrations. Figure 4A and 4B, represent the passive and active uptake components of COS-7/Mock and COS-7/hPHT1, respectively, extrapolated from the histidine concentration-dependent studies in Figure 3. These studies also indicate saturation of both COS-7/Mock and COS-7/hPHT1 stable transfects between approximately 1 and 2.5 mM with saturation occurring at slightly lower concentrations in the COS-7/Mock cells.


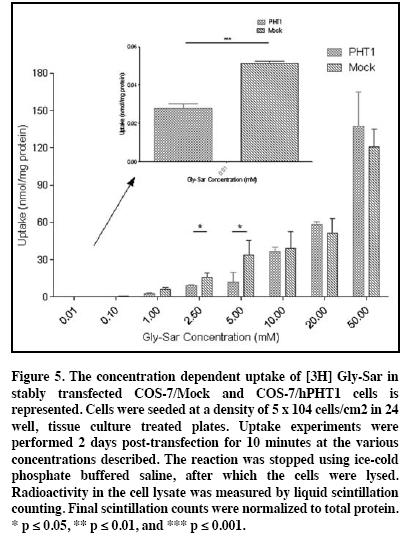
Gly-Sar concentration-dependent uptake (Figure 5) was performed using a 10 minute incubation period, based on linearity of uptake determined from time-dependent Gly-Sar uptake studies (data not shown). The data reveals fluctuating kinetics with significantly higher uptake observed 0.01 mM (p ≤ 0.001), and at 2.5 mM and 5 mM (p ≤ 0.05) in the COS-7/Mock cells. The Michaelis-Menten (MM) parameters for Gly-Sar were not calculated or extrapolated due to the presence of multiple inflection points in the data (see discussion).
The MM parameters (VMAX,KM and KD; presented in Table 1) were calculated for the histidine passive vs. active uptake concentration curves shown in Figures 4 A) and 5 B) utilizing equation 1 below:
V0 = (Vmax [S] / Km + [S]) + K.[S] (1)
where Vo is the intial velocity of the reaction, Vmax is the maximum velocity of a reaction, [S] is substrate concentration, Km is the Michaelis constant, and Kd is the dissociation constant.

Finally, Figure 6 illustrates the pH-dependent uptake of histidine, carnosine, Gly-Sar and valacyclovir in the COS-7/Mock and COS-7/hPHT1 stable transfects. Histidine, carnosine and valacyclovir demonstrated similar pH-independent uptake values in both the COS-7/Mock and COS-7/hPHT1 transfects, whereas Gly-Sar exhibited significantly higher uptake in the COS-7/Mock cells in contrast to COS-7/hPHT1 cells, suggesting a potential efflux mechanism for hPHT1. Interestingly, while Gly-Sar uptake demonstrated an overall pH-independence between like transfects (hPHT1 pH 5.0 vs. hPHT1 pH 7.4, etc.), similar to the other compounds evaluated, COS7/Mock cells exhibited a significantly higher Gly-Sar uptake at pH 5.0 comparative to COS7/hPHT1 cells, suggestive of a potential efflux mechanism for hPHT1 in stark contrast to data previously reported by this lab.9

Discussion
Previous studies in our laboratory suggested PHT1 acts to influx histidine, carnosine, and valacyclovir in a H+-dependent, Na+-independent manner in transiently transfected COS-7 cells.9 Interestingly, Gly-Sar did not appear to be a substrate in these studies. In addition, PHT1 and PHT2 were shown to be endogenously expressed in this cell line by RT-PCR, whereas hPepT1 was not expressed, making it an attractive cell line to study hPHT1 function.9 In order to obtain a more reliable and reproducible system, COS-7/hPHT1 stably transfected cells were established and characterized with respect to PHT1 expression and function. The results observed in the stably transfected cells illustrated here directly conflict with those previously reported.9
One of the more significant limitations with studying transient transfection systems is the inability to probe direct expressional changes in real time, not only in terms of expressional changes due to study conditions, but also heterogeneity of transfection efficiency. In these studies, we were able to establish that hPHT1 mRNA expression in the COS-7/hPHT1 cells was 10-fold higher than that observed in the COS-7/Mock cells, indirectly suggesting that the transgene mRNA is responsible for the net expressional differences throughout these experiments (Figures 1A and 1B). Since it is clear that RNA expression is not always indicative of protein expression these observations were further confirmed at the protein level by Western Blotting. Transgene hPHT1 expression was confirmed by probing with a polyclonal anti-hPHT1 antibody (Figure 2A), which demonstrated considerably higher relative hPHT1 expression in the COS-7/hPHT1 (T) cells comparative to the COS-7/Mock (M) cells (endogenous PHT1). Furthermore, Figure 2B illustrates a blot probed with a monoclonal V5 antibody directed towards the V5 epitope tag attached to the hPHT1 transgene expressed protein, and showed no expression in the COS-7/Mock (M) cells at the current detection level, whereas significant hPHT1 expression was detected in the COS-7/hPHT1 (T) cells at initial and final passaging. This suggests not only successful transfection, but that the cells are stably expressing the plasmid/transgene at the protein level throughout all experiments performed. The positope positive control protein containing the V5 peptide fragment was loaded in this gel, demonstrating the specific detection of the V5-epitope. Furthermore, GAPDH was used a loading and biological control probed for on each of the Western Blots shown above. GAPDH results suggested consistent expression in all samples (with possibly slightly higher expression in the Mock), thereby further confirming a higher PHT1-V5 expression in the COS-7/hPHT1 (T) cells.
Concentration-dependent histidine studies (Figure 3) exhibited higher uptake in COS-7/Mock cells when compared to COS-7/hPHT1 cells at higher concentrations, whereas statistically significant differences were not observed below 2.5 mM concentrations of histidine. These results suggest that hPHT1 may act to efflux histidine from cells at higher levels, although mixed mechanisms or saturation of uptake cannot be ruled out. The 0.01 mM concentration of histidine was chosen for further pH-dependent studies, to ensure that any potential confounding mechanisms of uptake observed at higher levels would not be an issue in the comparative results between the COS-7/Mock and COS-7/PHT1 cells. It must be noted that the potential mechanisms hypothesized to be responsible for those observations noted in these studies are in direct contrast to our previous results as discussed below.9
The COS-7/Mock and COS-7/PHT1 histidine concentration-dependent curves appeared to saturate around 2.5 mM . Their corresponding extrapolated passive and active components are shown in Figure 4. Figure 4A illustrates the extrapolated curve for the COS-7/Mock uptake up to 2.5 mM and Figure 4B illustrates the extrapolated COS-7/PHT1 curve also up to 2.5 mM histidine. It is interesting to note that the levels of passive diffusion of histidine is similar in both cell lines (no statistically different Kd values, Table 1), suggesting that variation in the kinetics is most likely due to transporter mediated effects. Michaelis-Menten parameters were calculated for these curves and their corresponding VMAX and KM values are shown in Table 1. Interestingly, a statistically significant difference was not observed for either parameter when comparing the COS-7/Mock and COS-7/hPHT1 cell lines. Although contrary to the previously reported data,9 this is not surprising considering the superimposability of the uptake vs. histidine concentration curves at the lower concentrations studied and potentially the linear time dependent curves.
Although unexpected, Gly-Sar demonstrated conflicting results comparative to the previously reported data in the COS-7 transiently transfected cells.9 In the time-dependent studies (data not shown), Gly-Sar illustrated a similar trend in the COS-7/Mock and COS-7/PHT1 cells with linearity occurring up to 10 minutes. Whereas, Figure 5 illustrates the concentration-dependent uptake of Gly-Sar at this time point reveal similar curves with multiple statistically significant differences observed. This data was reproducible in other experiments with Gly-Sar, and although not clear, may potentially indicate a mixed uptake mechanism for this substrate. At 2.5 mM and 5 mM Gly-Sar concentrations, the COS-7/Mock illustrates higher uptake (p ≤ 0.05) when compared to the COS-7/PHT1 transfects. In contrast to histidine, the COS-7/Mock also exhibited higher uptake than COS-7/PHT1 cells (p ≤ 0.001) at 0.01 mM Gly-Sar. Taken together, this data may suggest that Gly-Sar may be a relatively good substrate for hPHT1 efflux in these cells at lower concentrations. This proves very interesting considering the hPHT1 affinity for GlySar was not observed previously, in addition to the fact that hPHT1 was shown to play a role in substrate influx into hPHT1 transiently transfected cells.9 However, due to the multiple inflection points observed for the Gly-Sar concentration dependent curves, extrapolation to obtain Gly-Sar MM kinetic parameters were not possible. Based on this, we cannot rule out the potential for mixed uptake mechanisms confounding interpretation of Gly-Sar kinetics in either study.
For comparative purposes, 0.01 mM was selected for determining the pH-dependent uptake of histidine and Gly-Sar in these stably-transfected cells. In addition, to compare results with the prior study, 0.01 mM of both carnosine and valacyclovir were also added as substrates in the pH-dependent studies. Figure 6 illustrates the pH-dependent uptake of these substrates in the COS-7/Mock and COS-7/PHT1 cell lines.
Again contradictory to the studies performed in the transiently transfected cells,9 the data does not reveal a pH-dependent influx of the substrates in question. Furthermore, at 0.01 mM, Gly-Sar appears to be a hPHT1 substrate that exhibits efflux from the cells (p-value ≤ 0.01) at pH 5.0. Taken together, this data provides additional evidence suggesting that Gly-Sar is indeed a potential hPHT1 substrate at 0.01 mM, whereas in contrast to the previous studies, histidine, carnosine, and valacyclovir do not appear to be substrates under similar conditions.9
The confounding data derived from our attempts to elucidate hPHTFs function in the COS-7 cells are ultimately inconclusive, suggesting that a more suitable cell model may be necessary to proceed. Several hPHT1 splice variants have been identified in other cell lines, with each isoform having the potential to regulate function.1,6 Splice variants have also been implicated to be functional for hPepT1.1,5,7 As such, we could not rule out the possibility that PHT1 splice variants could be critical to overall PHT1 function. We also suspected that post-translational modifications may have differed across species and are possibly a confounder in the MDCKII studies. Based on these assumptions, we sought to find a cell line that lacked PepT-isoform expression, possessed endogenous PHT1 expression along with potentially functional splice variants, and would possess post-translational machinery that was closer to that observed in humans.
We have conducted COS-7 cell uptake kinetics under both hPHT1 transiently9 and a stably transfected conditions. The transient cell studies proved useful for the initial proof of concept investigations and were performed with the utmost scientific rigor. However, in these studies, we have reported results in a more efficient, well controlled stable-transfect cell line. The hPHT1 stably transfected COS-7 studies reported within this manuscript were supported by both mRNA and protein characterization, and as such, had been conducted using better controls. We currently cannot rectify the differences in the data between the two studies, but due to the control that were performed, we do feel that these latter studies may provide a more accurate reflection of hPHT1's function. Unpublished data from our laboratory is also supportive of the results we have reported here.
As previously discussed, COS-7 cells are not a polarized model, and therefore, this limits the experimental functional studies to substrate uptake kinetic measurements and not allowing the determination of transport kinetics. There is no question that permeability studies will be necessary for a more comprehensive mechanistic study of hPHT1 function. Related to the previous transient transfection studies, our stable transfection studies were performed under selective pressure using the aminoglyco-side neomycin-derivative, G418. Recently, Jacobsen et al.13 demonstrated the importance of selecting and optimizing the best possible transfection reagent for transiently transfected cells, as they can lead to significant differences in expressed transcripts. It should also be noted that several researchers in the field have also attempted to characterize the function of hPHTl, but the results of their studies also were ultimately inconclusive.14-16 Finally, the fact that hPHT1 expression is virtually ubiquitous across human tissues17,18, justifies the need for the development of improved models to delineate its function and determine its physiological role. Based on these considerations, our primary conclusion is that a more appropriate human-derived cell line may be necessary to truly delineate the functional relevancy of hPHT1.
Ackknowledgements
The authors would like to acknowledge the financial support from the National Institute of General Medical Sciences (R01-GM65448).
References
1. Herrera-Ruiz D, Knipp GT. Current perspectives on established and putative mammalian oligopeptide transporters. J Pharm Sci. 2003; 92:691-714. [ Links ]
2. Daniel H, Kottra G. The proton oligopeptide cotransporter family SLC15 in physiology and pharmacology. Pflugers Arch. 2004; 447:610-618. [ Links ]
3. Rubio-Aliaga I, Daniel H. Peptide transporters and their roles in physiological processes and drug disposition. Xenobiotica. 2008; 38:1022-1042. [ Links ]
4. Brandsch M, Knutter I, Bosse-Doenecke E. Pharmaceutical and pharmacological importance of peptide transporters. J Pharm Pharmacol. 2008; 60:543-585. [ Links ]
5. Botka CW, Wittig TW, Graul RC, Nielsen CU, Higaka K, Amidon GL, Sadee W. Human proton/oligopeptide transporter (POT) genes: identification of putative human genes using bioinformatics. AAPS PharmSci. 2000; 2:E16. [ Links ]
6. Knipp GT, Herrera-Ruiz D. Nucleic acid encoding the human peptide Histidine transporter 1 and methods of use thereof. U.S. Patent #6,683,169 (filing date: 5/31/01, issued: 1/27/04). [ Links ]
7. Carl SM, Herrera-Ruiz D, Bhardwaj R, Gudmundsson OS, Knipp GT. Mammalian oligopeptide transporters. In Drug Transporters: Molecular Characterization and Role in Drug Disposition. You G., Morris M.E. Editors. Hoboken, NJ: John Wiley & Sons, Inc., 2007. pp. 105-145. [ Links ]
8. Yamashita T, Shimada S, Guo W, Sato K, Kohmura E, Hayakawa T, Takagi T, Tohyama M. Cloning and functional expression of a brain Peptide/Histidine transporter. J Biol Chem. 1997; 272:10205-10211. [ Links ]
9. Bhardwaj RK, Herrera-Ruiz D, Eltoukhy N, Saad M, Knipp GT. The functional evaluation of human Peptide/Histidine transporter 1 (HPHT1) in transiently transfected COS-7 cells. Eur J Pharm Sci. 2006; 27:533-542. [ Links ]
10. Herrera-Ruiz D, Faria T, Bhardwaj RK, Timoszyk J, Gudmundsson OS, Moench P, Wall DA, Smith RL, Knipp GT. A novel hPepT1-stably transfected cell line: establishing a correlation between expression and function. Mol Pharm. 2004; 1:136-144. [ Links ]
11. Bhardwaj RK, Herrera-Ruiz D, Sinko PJ, Gudmundsson OS, Knipp GT. Delineation of human peptide transporter (hPepT1)-mediated uptake and transport of substrates transfected hPepT1/Madin-Darby canine kidney clones and Caco-2 cells. J Pharmacol Exp Ther. 2005; 314:1093-1100. [ Links ]
12. Livak KJ, Schmittgen TD. Analysis of relative gene expression data using real-time quantitative PCR and the 2-AACt method. Methods. 2001; 25:402-408. [ Links ]
13. Jacobsen LB, Calvin SA, Lobenhofer EK. Transcriptional effects of transfection: The potential for misinterpretation of gene expression data from transiently transfected cells. BioTechniques. 2009; 47:617-624. [ Links ]
14. Jappar D, Hu Y, Keep RF, Smith DE. Transport mechanisms of Carnosine in SKPT cells: Contribution of apical and basolateral membrane transporters. Pharm Res. 2009; 26:172-181. [ Links ]
15. Fujita T, Kishida T, Wada M, Okada N, Yamamoto A, Leibach FH, Ganapathy V. Functional characterization of brain peptide transporter in rat cerebral cortex: identification of the high-affinity type H+/peptide transporter PEPT2. Brain Res. 2004; 997:52-61. [ Links ]
16. Ocheltree SM, Keep RF, Shen H, Yang D, Hughes BA, Smith DE. Preliminary investigation into the expression of proton-coupled oligopeptide transporters in neural retina and retinal pigment epithelium (RPE): lack of functional activity in RPE plasma membranes. Pharm. Res. 2003; 20:1364-1372. [ Links ]
17. Herrera-Ruiz D, Wang Q, Gudmundsson OS, Cook TJ, Smith RL, Faria TN, Knipp GT. Spatial expression patterns of peptide transporters in the human and rat gastrointestinal tracts, Caco-2 in vitro cell culture, and multiple human tissues. AAPS PharmSci. 2001; 3:Article 9. [ Links ]
18. Nishimura M, Naito S. Tissue-specific mRNA expression profiles of human ATP-binding cassette and solute carrier transporter superfamilies. Drug Metab Pharmacokin. 2005; 20:452-477. [ Links ]

