


Servicios Personalizados
Revista
Articulo
 texto en
  Inglés (pdf)
 Artículo en XML
 Referencias del artículo
 Enviar artículo por email
Indicadores
-
 Citado por SciELO
 -
 Accesos
Links relacionados
-
 Similares en
SciELO
Similares en
SciELO
Compartir

 Permalink
Migraciones internacionales
versión On-line ISSN 2594-0279versión impresa ISSN 1665-8906
Migr. Inter vol.12 Tijuana ene./dic. 2021 Epub 20-Sep-2021
https://doi.org/10.33679/rmi.v1i1.2175
Papers
The Incidence of Crimes in Municipalities with Land Communication Networks and Social Backwardness in Chiapas

1 El Colegio de la Frontera Norte, Mexico, cfuentes@colef.mx
The objective of the article is to investigate the spatial relationship between socio-economic characteristics, demographics, terrestrial communication networks, and crime in the municipalities of Chiapas. The methodology includes a multiple spatial regression model estimated with maximum likelihood. We obtained the information from the Executive Secretariat of the National Public Security System (SESNSP, 2019) and the 2015 Intercensal Survey (INEGI, 2015) at the municipal level. The results confirm that the municipalities connected by road and rail networks have higher unemployment rates and extreme poverty. They also present higher crime rates such as robbery to passers-by and homicides. The results can be used as a public policy instrument to target crime prevention and containment programs.
Keywords: 1. routes; 2. robbery; 3. homicides; 4. Chiapas; 5. Mexico
El objetivo del artículo es investigar la relación espacial entre las características socioeconómicas, demográficas, redes de comunicación terrestre y delitos en los municipios de Chiapas. La metodología incluye un modelo de regresión espacial múltiple estimado con máxima verosimilitud. La información usada se obtuvo del Secretariado Ejecutivo del Sistema Nacional de Seguridad Pública (SESNSP, 2019) y la Encuesta Intercensal 2015 (Inegi, 2015) a nivel municipal. Los resultados confirman que los municipios que están comunicados por redes de carreteras y vías del ferrocarril, tienen mayores tasas de desempleo y pobreza extrema, presentan mayores tasas de delitos como robos a transeúntes y homicidios. Los resultados pueden ser usados como un instrumento de política pública para focalizar programas de prevención y contención del delito.
Palabras clave: 1. rutas; 2. robos; 3. homicidios; 4. Chiapas; 5. México
Introduction2
From the year 2000, the state of Chiapas presented serious challenges in terms of public security due to the globalization process of illegal/illicit economies given its border condition and structural disadvantages such as high unemployment rate and extreme poverty (Basail, 2012). This led to an increase in transnational organized crime, local criminal organizations, and common crime operating in the region (Fuentes, Arzaluz, Díaz, Ixcol, & Mendoza, 2019).
Despite the above, as of 2004, Chiapas presented a low rate in most crimes when compared with the rest of the states in Mexico and with the national average, the reason for which it was classified as one of the safest entities in the country (Isacson & Meyer, 2014). However, some municipalities with functions of nodes and routes of migratory flows in transit, drug, and human trafficking present high crime rates. Also, like the rest of the state, they have structural disadvantages such as precarious employment conditions and a high percentage of its population living in extreme poverty (Basail, 2012).
Therefore, spatial patterns were formed in which municipalities with high crime rates are located; the first, along with the Pacific coast from the municipality of Suchiate to Arriaga;
and the second, in the northwest from the municipality of Benemérito de las Américas,
which passes through Tenosique to Palenque. Empirical studies on crime incidence conclude that criminality is not distributed randomly but is rather concentrated in some municipalities (Wortley & Townsley, 2008).
In Mexico, research has been carried out that studied the crime rate in Chiapas (Basail, 2012; Armijo, 2011; Casillas, 2011; Ruiz, 2001), but none followed a spatial approach in order to test a hypothesis of crime clustering along with the land communication networks through which the transit routes of the illegal/illicit economies pass. In this context, the purpose of this article is to investigate the spatial relationship between socioeconomic and demographic characteristics, land communications networks, and crime in the municipalities of Chiapas.
The article is divided into four sections. The first discusses a proposal from two complementary perspectives on environmental criminology called routine activity theory (Cohen & Felson, 1979) and crime pattern theory (Brantingham, Brantingham, & Wong, 1991) that highlight three concepts: nodes, routes, and boundaries for the location of crimes. The second section presents a first approach to how land communication networks and economic disadvantages relate to crime rates. The third presents the methodological strategy through the construction of a spatial regression model estimated with maximum likelihood to deepen the previous relationship. The fourth section reports the results of the spatial regression model. Finally, closing remarks are presented.
Theories from the ecological approach to criminology
To establish the link between crime rates and the spatial dimension, two theories from the ecological perspective of criminology will be employed: the routine activity theory (Cohen & Felson, 1979) and crime pattern theory (Brantingham & Brantingham, 1993a).
The routine activity theory seeks to explain the concentration of crime based on the activities that are carried out in the given location, and that can attract both suitable targets and criminals motivated by time and space. This theory states that for crimes to be committed, there must be a conjunction of three factors in time and space: motivated offender, a suitable target, and the absence of a capable guardian (Felson & Clarke, 1998).
Empirical studies from this approach that seek to test the reasons why people commit crimes include the following variables: unemployment rate, high percentages of low-income households, and low education levels.
Environmental criminology also provides a complementary approach to the routine activity theory, the crime pattern theory, which focuses on the study of environmental factors that can influence criminal activity (Brantingham & Brantingham, 1993b). The main argument of the crime pattern theory is that some places have higher crime rates because they provide greater opportunities as a result of the activities taking place therein (Vilalta & Fondevila, 2019).
Likewise, this theory sets forth that there are areas where crime is generated and others that attract it. The crime-generating areas are zones to which a large number of people are attracted for different reasons, and wherein they may end up being victims of crime; these areas are located at the communication nodes where different ways converge. For example, towns that function as highway hubs or having railroad stations (Brantingham & Brantingham, 1993a). In these areas, crimes are generated due to concentrations of people who potentially become targets of crime converging in time and space. Areas that attract crime are places that create opportunities for criminals.
This theory highlights three fundamental concepts that can be applied at different scales: nodes, routes, and boundaries. Nodes are the places where people who commit crimes and people who may be victims live or pass through. Both individual and aggregate crime patterns are clustered around the nodes of the victims and the perpetrator, along the main communication routes. For example, crimes such as robbery and rape are committed in the nodes and places where people carry out their daily activities (Brantingham & Brantingham, 1993b).
The criminogenic characteristics of the nodes are sometimes enhanced by the type of activities carried out in them and by high-risk users, such as drug users. For example, if a drug user goes to a drug den looking for drugs, it is possible that they will find other drug users or drug dealers, and a crime may arise in that place.
For their part, routes are critically important in shaping day-to-day activities and determine where people travel and how long it takes to travel. Given that routes are established through communication networks; they influence the distribution of crime patterns. People and goods travel to and from their nodes through existing communication networks such as railroads and highways, and these are areas with a high activity where crime concentrates. For example, borders are not generally the destination of migrant and drug flows, but rather are spaces of transit. In the case of the southern Mexican border, the flows of migrants in irregular transit seek to reach the northern border through land communication networks such as roads and railroads.
Limits refer to where there is a notable change in crime rate, as is the case of those municipalities not communicated by railroad and main roads (Brantingham & Brantingham, 1993a).
Spatial distribution of crime in chiapas municipalities
The state of Chiapas, despite being a flow space for drug and human trafficking, had a low crime rate as of 2004, when compared to the national average for most crimes3 (Fuentes et al., 2019). For example, in the case of homicide rate went from 30.5 murders per 100,000 inhabitants in 2000 to a rate of 8.8 in 2017. Table 1 shows that the crime rates in Chiapas are below the national average for most crimes, except for homicide, kidnapping, and rape, which are very similar to the other states.
Table 1 Rates of Reports of Various Crimes per 100,000 Inhabitants in Chiapas and the National Average (Average for the Period 2000-2017)
| Type of crime | Chiapas | Mexico |
|---|---|---|
| Homicide | 14.3 | 15 |
| Motor Vehicle theft without violence | 27.2 | 121.8 |
| Robbery | 18.1 | 72.1 |
| Kidnapping | 0.4 | 0.9 |
| Rape | 26 | 27 |
| Extortion | 2.7 | 4.1 |
Source: Own elaboration based on information from the Executive Secretariat of the National Public Security System (SESNSP), Crime Rate at the State Level. Secretariat of Home Affairs (Secretaría de Gobernación, 2018).
The above panorama changes at the municipal level, since some municipalities in the state, registered high rates of crimes such as robbery, extortion, rape, motor vehicle theft without violence, among others (Fuentes et al., 2019). The concentration of these crimes in some municipalities is mainly explained by three reasons: 1) being land communication networks such as highways and railroads through which the routes of irregular migratory transit flows and human trafficking pass, which may be victims of a crime; 2) having unfavorable well-being indicators such as high unemployment rates and a higher proportion of the population living in extreme poverty, which affect the participation of the young population in criminal offenses; 3) the presence of local and transnational organized crime such as drug cartels (Paris, Ley, & Peña, 2016).
Since 2000, the southern border, and specifically the state of Chiapas, has become a strategic area for the flow of irregular migrants in transit, drug, and human trafficking who cross Mexico to reach mainly the United States. To measure some studies, indicate that the highest volume of migrants in irregular transit was reached in 2005, estimated at between 390,000 and 430,000 (Rodríguez, Berumen, & Ramos, 2011; Rodríguez, 2013 & Berumen, Narváez, & Ramos, 2011). Likewise, different studies showed that migrants are the target of different crimes on the routes (Anguiano & Trejo, 2010; Benítez, 2011; Casillas, 2010; Casillas, 2011; Castillo, 2000); similarly, the U.S. Department of State reported that 80% of the cocaine that reached the United States market in 2013 crossed through Guatemala, and most of it was transported by land or sea through Mexico (Isacson, Mayer, & Smith, 2017).
The flows of migrants and drugs are transported mainly by means of land communication networks since they seek to reach their final destination as soon as possible. In Chiapas, the highway network is made up of eight axes, of which three connect the border between Chiapas and Guatemala with the rest of the country: 1) Ciudad Hidalgo-Tapachula-Arriaga;
2) Comalapa-Motozintla-Comitán-Tuxtla Gutiérrez border; and 3) Palenque-San Cristóbal
de las Casas-Tuxtla Gutiérrez. In addition, some of the routes are also connected by the railroad, such as in Chiapas4 and Mayab.5
These routes communicate municipalities with social backwardness indicators related to high crime rates, such as unemployment, poverty, young population, and so on. It is important to remember that the state of Chiapas stands out at the national level due to a high percentage of its population living in extreme poverty, high unemployment rate, low levels of schooling, high marginality index, etc., which could influence some people deciding to participate in criminal activities in order to earn an income (Casillas, 2011).
The Pacific Coast route crosses municipalities in the Soconusco and Isthmus-Coast regions, wherein most of their border municipalities show serious lags in socioeconomic indicators despite being considered the richest areas of Chiapas. For example, almost 50% of the inhabitants of the municipality of Suchiate live in extreme poverty, 41.6% of its population reside in urban areas, 20.54% of its population is 15-24 years old, and its marginality index is high. Similarly, in the municipality of Frontera Comalapa 26.68% of the population lives in extreme poverty, only 27.91% of its population is urban, 20.15% of its population is 15-24 years old and its marginality index is high (see Table 2).
Table 2 Sociodemographic Indicators in Main Municipalities with Border Crossings and the State of Chiapas
| Suchiate | Frontera Comalapa | Tuxtla Chico | Chiapas (state level) | |
|---|---|---|---|---|
| % Of population in extreme poverty | 37.73 | 26.68 | 23.8 | 39.30 |
| % Of urban population | 41.66 | 27.91 | 18.68 | 49.71 |
| Unemployment rate | 0.02 | 0.02 | 0.03 | 0.2 |
| Marginality index | 0.581 | 0.331 | 0.295 | 2.406 |
| % Of people ages 18 and + with an education | 58.26 | 59.28 | 62.36 | 57.72 |
| % Of the population aged 15-24 | 20.54 | 20.15 | 19.76 | 20.18 |
Source: Own elaboration based on the Intercensal Survey (INEGI, 2015), CONEVAL (2017), and CONAPO (2016).
For their part, municipalities located along with communication networks, such as Tapachula, despite being the main urban centers along the route also show unfavorable socioeconomic indicators, as a high percentage of their population lives in poverty, most employment is precarious, and so on. As for the municipality of Huixtla, it has a higher proportion of the population in extreme poverty, a higher index of marginalization, and a higher rate of unemployment than Tapachula (See Table 3). Mapastepec’s panorama is no different since 30.8% of its population lives in extreme poverty, 49.8% of its population lives in urban locations, and evidences a high index of marginalization.
Table 3 Sociodemographic Indicators in the Main Municipalities of the State of Chiapas
| Tapachula | Huixtla | Mapastepec | Chiapas (state level) | |
|---|---|---|---|---|
| % Of population in extreme poverty | 23.70 | 25.18 | 30.8 | 39.30 |
| % Of urban population | 63.24 | 40.83 | 40.83 | 49.71 |
| Unemployment rate | .02 | 0.03 | 0.02 | 0.2 |
| Marginality index | .577 | 0.141 | 0.249 | 2.406 |
| % Of people ages 18 and + with an education | 63.3 | 61.49 | 59.02 | 57.72 |
| % Of the population aged 15-24 | 19.5 | 19.65 | 20.55 | 20.18 |
Source: Own elaboration based on the Intercensal Survey (INEGI, 2015), CONEVAL (2017), and CONAPO (2016).
Most localities in the municipality of Pijijiapan are rural and a high percentage of its population lives in extreme poverty. On this route, at the end of the Chiapas section, the municipality of Arriaga is located, which borders the state of Oaxaca. The high crime rate is also affected due to 25.85% of its population living in extreme poverty and presenting a medium level of marginality (See Table 4).
Table 4 Sociodemographic Indicators in Main Municipalities with Border Crossings and the State of Chiapas (2015)
| Indicator | Pijijiapan | Arriaga | Palenque | Chiapas (state level) |
|---|---|---|---|---|
| % of population in extreme poverty | 36.95 | 25.81 | 48.13 | 39.3 |
| % of urban population | 33.78 | 61.05 | 38.71 | 49.71 |
| Unemployment rate | 0.01 | 0.02 | 0.04 | 0.2 |
| Marginality index | 0.51 | 0.27 | 0.475 | 2.406 |
| % of people ages 18 and + with an education | 61.46 | 64.54 | 56.18 | 57.72 |
| % of the population aged 15-24 | 19.13 | 17.28 | 20.69 | 20.18 |
Source: Own elaboration based on the Intercensal Survey (INEGI, 2015), CONEVAL (2017), and CONAPO (2016).
In the Tenosique-Palenque-Tuxtla Gutiérrez highway axis, the municipality of Palenque also evidences large social backwardness, since about 50% of its population lives in extreme poverty and experiences a high unemployment rate. It is important to remember that Palenque is part of the northeastern migration route, which begins at the El Ceibo border crossing in the municipality of Tenosique and continues through Palenque until it reaches the north of Tabasco and the south of Veracruz. It is not only connected by highway, but it is also part of the Mayab railroad route, which contributed to the fact that once the arrival of the railroad to Tapachula was canceled, it became an important means of transport for migration flows (Martínez, Cobo, & Narváez, 2015). This is corroborated with information from the EMIF- Sur (Survey on Migration in the Southern Border of Mexico): in 2005, out of the migrants returned by Mexico 41.5% declared that they crossed through Ciudad Hidalgo, 20.6% through Talismán, 24.5% through Ciudad Cuauhtémoc and 7% through El Ceibo. By 2012, this same group reported that 41.5% crossed through Ciudad Hidalgo, 30.8% through Ciudad Cuauhtémoc, 8% through Carmen Xhan, and 16.6% through El Ceibo (COLEF et al., 2012).6
The existence of terrestrial communication networks that facilitate the people and drug flows, a higher concentration of population, and unfavorable indicators of well-being could influence crime rates above the state average, for crimes such as robbery, motor vehicle theft without violence, and homicides.
The municipalities with the highest rates of robbery in Chiapas were Suchiate (107.4), Tapachula (104.6), Palenque (82), Arriaga (74.5), Comitán (26.74), Metapa (26.24), Chiapa de Corzo (88.6), Huixtla (40.4), Reforma (56.1), while the state average was 10.2. For its part, the border municipality of Tenosique in Tabasco reached a rate of 303.8 per 100,000 inhabitants.7
One of the municipalities with the highest rate of robberies is Arriaga, which is a strategic place for migratory flows since once the coastal route of the Chiapas-Mayab train was canceled, migrants arrive in buses or trailers to continue the route of the railroad that crosses through Oaxaca to reach the center of the country and from there seek to reach the northern border.
In relation to this, the presence of some members of the MS-13 and Barrio 18 gangs was reported in this municipality, committing crimes such as robbery, extortion, rape, and kidnapping, mainly targeting migrants as they boarded the train (International Crisis Group, 2018).
Robbery is not homogeneously represented throughout the Chiapas territory, but rather shows a defined spatial pattern. Map 1 shows that the municipalities with the highest rates of robbery are located mainly along the roads and railroad networks. Two spatial patterns can be clearly identified where municipalities with higher rates are located: 1) the Pacific coast route that is connected by Federal Highway 200 and the Chiapas train route, in which the cases of Suchiate, Tapachula, Huixtla, Mapastepec, and Arriaga stand out; and 2) the northeastern route, which includes the municipalities communicated by the Federal Highway 199 and the Mayab train line, and where the municipalities of Tenosique, in Tabasco, and Palenque and Tuxtla Gutiérrez, in Chiapas, stand out.

Source: Own elaboration based on information from the Executive Secretariat of the National Public Security System (SESNSP), Crime Rate at the State Level. Secretariat of Home Affairs (Secretaría de Gobernación, 2018).
Map 1 Rate of Reports of Robbery per 100,000 Inhabitants in the Municipalities of the State of Chiapas (Average 2011-2017)
Rape is another highly rated crime, which in most cases is the product of deeply-rooted intrafamily violence in the state, but also as a result of sexual violence perpetrated on migrant women and girls (Paris, Ley and Peña, 2016). Although Chiapas is one of the states with a high rate of rape, there are municipalities that have rates twice or triple the state average such as Suchiate (32.2), Arriaga (25.8), Mazatán (20.5), Tapachula (21.6), Huixtla (25.1), Pijijiapan (17.9), and Tenosique (44.8), while the state average was 14.3. The case of Tenosique in Tabasco is particularly outstanding, as it is a space in which this crime has a high rate due to its bordering status.
Map 2 shows that the municipalities with the highest rates of rape also show a defined spatial pattern. On the Pacific coast route, the municipalities of Suchiate, Tapachula, Huixtla, Mapastepec, Pijijiapan, Tonalá and Arriaga can be identified. The municipalities of Palenque, in Chiapas, and Tenosique and Balancán, in Tabasco, are located along the northeastern route.

Source: Own elaboration based on information from the Executive Secretariat of the National Public Security System (SESNSP), Crime Rate at the State Level. Secretariat of Home Affairs (Secretaría de Gobernación, 2018).
Map 2 Rate Of Reports of Rape Per 100,000 Women in Municipalities of the States of Campeche, Chiapas, and Tabasco (2011-2017)
There is a high rate of rape in the municipality of Huixtla, explained by its function as a highway axis, as it is connected by Federal Highways 200 and 199. Therefore, it is an obligatory place for the transit of migration flows and therefore a strategic space for migration control, due to which a migration booth was set there. For this reason, as immigration control increased, the flow changed its route towards more dangerous roads such as the area called La Arrocera (the rice fields), where various media sources reported that migrants were victims of a large number of criminal activities, such as organized crime (Enríquez & Chávez, 2012).
A crime mainly linked to the presence of transnational organized crime, especially drug cartels and gangs is homicide. It is therefore not surprising that municipalities with border crossings that are routes for the flow of illegal drugs such as Benemérito de las Américas (98.37), Suchiate (61.4), Tuxtla Chico (23.8), and Tenosique (19.3) have higher homicides rates. Likewise, the municipalities that are nodes of the communication network routes such as Tapachula (17.2), Huixtla (12.4), Mapastepec (12.7), Arriaga (21.6) have high rates when compared to the state average (8.8) (see Map 3).
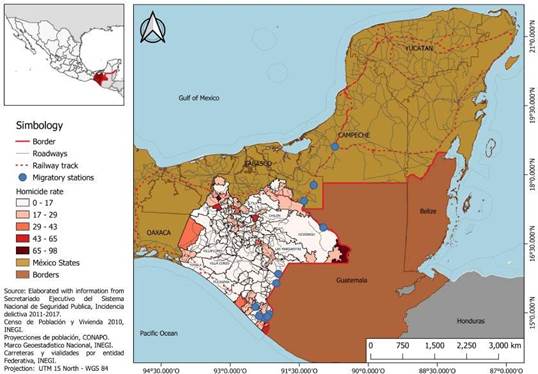
Source: Own elaboration based on information from the Executive Secretariat of the National Public Security System (SESNSP), Crime Rate at the State Level. Secretariat of Home Affairs (Secretaría de Gobernación, 2018).
Map 3 Rate of Homicide per 100,000 People in the Municipalities of the States of Campeche, Chiapas, and Tabasco (Average for the Period 2011-2017)
The municipality of Huixtla is a space through which not only migrants but also illegal drugs flow, evidenced for example by different media sources reporting seizures of cocaine shipments in this municipality by the Navy (Orbe, 2019). The same happened with Mapastepec, especially due to the presence of some members of the MS-13 and Barrio 18 gangs, according to media information. Likewise, there is evidence that this is one of the routes for drug trafficking since it was documented that in this municipality large quantities of drugs, mainly cocaine, have been seized.
The municipality of Benemérito de las Américas8 represents an extreme case of homicidal violence; it has a border crossing in the town of Nueva Orizaba, which presented a rate almost ten times higher than the state average during the 2011-2017 period, due to its proximity to the municipality of Ixtcán in the Guatemalan department of Quiché, which is the route of cocaine trafficking (Zepeda, González-Izás, & Scholter, 2018).
Motor vehicle theft is another crime linked to the border condition since some of the stolen vehicles are taken to Guatemala for sale by transnational organized crime. Therefore, it is not surprising that non-violent motor vehicle theft is concentrated in border municipalities such as Tapachula (62.3), Suchiate (36.1), Frontera Comalapa (27.1), Tenosique (13.7), as well as in municipalities that serve as routes such as Huixtla (35.9), Mapastepec (21.1), Pijijiapan (20.6), and Arriaga (23.7). Map 4 shows that the municipalities with the highest rates of non-violent vehicle theft are located along Federal Highway 200. The same happens in the northeast in the municipalities connected by Federal Highway 199 that passes through Palenque and Tuxtla Gutiérrez.

Source: Own elaboration based on information from the Executive Secretariat of the National Public Security System (SESNSP), Crime Rate at the State Level. Secretariat of Home Affairs (Secretaría de Gobernación, 2018).
Map 4 Rate of Motor Vehicle Theft Without Violence per 100,000 in the Municipalities of the States of Campeche, Chiapas, and Tabasco (2011-2017)
The municipality of Tenosique became a key space for the flows of migrants, especially of Honduran origin,9 who make use of this route seeking to reach the United States, as this border crossing is the closest to Honduras (Isacson, Meyer, & Smith, 2017). The journey on foot from the international crossing of El Ceibo to Tenosique takes 20 hours; during this journey, Central American migrants report having been victims of kidnappings, robberies including sexual assaults (Isacson, Meyer, & Smith, 2017). The official crime statistics comparing Tenosique with the Tabasco average do not seem to differ much, yet they show important differences when compared with Chiapas. The crime of robbery is worth noting, which reached a rate of 303.8. According to investigative reports, the Jalisco Nueva Generación cartel recently took control of drug trafficking through the municipality of Tenosique, making it a significant source of crime (International Crisis Group, 2018).
The municipality of Palenque is a strategic node on the northeastern route due to the convergence of land communication routes along the Tabasco-Guatemala border, coming from Frontera Coroza (Martínez et al., 2015), as well as of the Mayab train route that crosses from Campeche to Chiapas to continue through Palenque and reach the north of Tabasco. In Palenque, migrants coming mainly from Tenosique take the freight train nicknamed “La Bestia” (The Beast) in order to reach the south of Veracruz and continue their journey towards the northern border. Once on the train, gangs charge migrants $100 pesos per person for each section of the journey (Isacson, Meyer, & Smith, 2017). The foregoing makes it a space with a high crime rate due to both common criminality and some members of gangs such as MS-13; crimes such as extortion (3.7), rape (18.5), robbery (11.5), and kidnapping (4.8) stand out there. Similarly, there are other crimes with rates above the state average, such as motor vehicle theft without violence (29.2) and homicide (14.8), which can be explained due to this place also being a route of illegal drug trafficking.
Methodology and database
A multiple spatial regression model will be used to delve into the hypothesis of the crime clustering along municipalities communicated by highway networks that are used for the flows of migrants in irregular transit and drug trafficking, and where there is also a larger population with indicators of social disadvantage. A cross-sectional database was built for each of the municipalities of the state of Chiapas; the dependent variables included in the model are the following: the rate for robbery and homicide. For their part, the independent variables include two proxy variables; one for the municipalities that are part of the main highway and railroad network, and another for the municipalities with official border crossings. Also, socioeconomic and demographic variables that are predictors of crime incidence according to the routine activity theory such as unemployed population, urban population, young population, marginality index, extreme poverty in each Chiapas municipality.
The sociodemographic variables were obtained from the Intercensal Survey 2015 acronym in Spanish for Encuesta Intercensal 2015 (INEGI, 2015), the National Council for the Evaluation of Social Development Policy (CONEVAL, acronym in Spanish for Consejo Nacional de Evaluación de la Política de Desarrollo Social) (2017), the National Population Commission (CONAPO, acronym in Spanish for Consejo Nacional de Población) (2016), and the Executive Secretariat of the National Public Security System (SESNSP) (2018).10 The variance inflation factor (VIF), which is a measure of redundancy among independent variables, shows in all cases values less than 2, which suggests that there are no multicollinearity problems between the explanatory variables.
Dependent Variables
Robbery Rate per 100,000 Inhabitants (ROBRATE)
The robbery11 rate variable was selected because it is one of the crimes with the highest rate in municipalities with routes and node functions, affecting both migrants and the local population of these municipalities. This variable was expressed in rates in order to standardize the data and calculated for each of the municipalities of the state of Chiapas. The data on robbery correspond to the average for the period 2011-2017,12 and the source of the information is the Executive Secretariat of the National Public Security System (SESNSP, 2018).
Homicides rate per 100,000 Inhabitants (HOMRATE)
The homicides13 variable was selected as a result of the presence of transnational organized crime groups in the area, such as drug and human traffickers who use extreme violence to defend their routes and territories. This variable was also expressed in rates to standardize the data and calculated for each of the municipalities of the state of Chiapas. The data on homicide corresponds to the average for the period 2011-2017 (SESNSP, 2018).14
Independent Variables
The crime rate in the municipalities is conditioned by being part of highway and railroad networks through which the flows of people and drugs pass, and by functioning as border crossings, and by socioeconomic and demographic conditions.
Municipalities Along Main Roads and Railroad Networks (MARRN)
Under the crime pattern theory, it is argued that there is probably a greater number of crimes on the routes through which people or goods move from one place to another (Brantingham & Brantingham, 1993b). Thus, a proxy variable of the flow was constructed that seeks to identify the crime rate in the municipalities part of the roads and railroad networks and which, in the case of Chiapas, are the routes through which migrants in irregular transit, drugs, and human trafficking moves. Therefore, the municipalities that are crossed by train tracks and main highways take the value 1, and the value 0 otherwise.
Municipalities with Border Crossings (MBC)
Likewise, from the crime pattern theory nodes are places where criminal activity can be concentrated, and therefore another proxy variable of the node was constructed as a result of the existence of official border crossings in the municipalities of the state of Chiapas. Part of the flow of unauthorized migrants, drugs, and people cross through these municipalities. The variable takes the value 1 for municipalities with a formal border crossing and the value 0 otherwise.
Control Variables
Some control variables were selected from the routine activity theory perspective (Felson & Clarke, 1998). According to this theory, the socioeconomic variables that predict crime are the percentage of the urban population, the proportion of the young population, marginality index, population in extreme poverty, and unemployed population for each municipality.
Percentage of Urban Population (PURBPO)
In order to capture the urban-rural duality of the municipalities, the variable percentage of urban population was constructed, elaborated by dividing the urban population by the total population and then multiplying the result by 100. This variable is an indicator commonly used under the routine activity theory, which considers that when there is a larger urban size, there is a greater number of people willing to commit crimes, so a positive influence is expected on the crime rate (Andersen, 2006; Cahill & Mulligan, 2007). This information was obtained from the Intercensal Survey 20155 (INEGI, 2015).
Unemployed Population (UNEMPO)
The unemployed population variable was constructed by subtracting the employed population of the municipality from the population aged 12 and over. According to the routine activity theory, the unemployed population has a positive impact on the occurrence of crime, and so a positive relationship with the crime rate is expected. The information was obtained from the Intercensal Survey 2015 (INEGI, 2015).
Percentage of the Population Between 18 and 24 Years of Age (PPB18A24)
This variable aims at identifying the concentration of the young population and its impact on the increase in crime in the municipalities. This variable was constructed by dividing the population of the 18 to 24 age group by the total population of the municipality multiplied by 100. The routine activity theory emphasizes the concentration of the young population as a strong predictor of crime (Andersen, 2006). According to the RA theory, it is expected that when there is a high percentage of the young population, the relationship will be positive with the increase in crime. The information was obtained from the Intercensal Survey 2015 (INEGI, 2015).
Marginality Index (MARGINDEX)
The urban marginality is constructed as an indicator of deprivation suffered by the population as a result of lack of access to education, health services, residence in inadequate housing, and lack of goods. This was constructed through the use of factor analysis using the principal components technique. The source of information is the Marginalization index by municipality 2015 (Conapo, 2015).
Percentage of the Population in Extreme Poverty (PPEPOV)
Poverty is a variable that explains the concentration of crime in the municipalities. The population in extreme poverty variable was constructed by dividing the population in extreme poverty by the total population of the municipality, multiplied by 100. The information at the municipal level was obtained from the National Council for the Evaluation of Social Development Policy (CONEVAL, 2017). According to the routine activity theory, a higher percentage of the population living in extreme poverty has a positive impact on the occurrence of crimes of homicide, robbery, assault, and rape. Table 5 shows the descriptive statistics for each variable employed in the regression model.
Table 5 Descriptive Statistics of the Variables of the Crime Rate Model in Chiapas, at the Municipal Level (N = 118)
| Variables | Mean | SD * | Min | Max |
|---|---|---|---|---|
| Unemployed population (UNEMPO) | 0.02 | 0.02 | 0.0 | 0.12 |
| Percentage of urban population (PURBPO) | 176.02 | 562.9 | 0.01 | 5764.3 |
| Percentage of the population between 18 and 24 years of age (PPB18a24) | 20.22 | 1.40 | 10.35 | 22.31 |
| Marginality Index (MARGINDEX) | 0.90 | 0.69 | 0.0 | 3.95 |
| Proxy variable of border crossings (MBC) | 0.05 | |||
| Proxy variable of roads and railroad networks (MARRN) | 0.10 | |||
| Percentage of the population in extreme poverty (PPEPOV) | 45.91 | 18.02 | 9.10 | 89.54 |
| Robbery rate (ROBRATE) | 7.67 | 9.9 | 0.00 | 53.55 |
| Homicide rate (HOMRATE) | 1.38 | 9.8 | 0.10 | 1.6 |
* SD = Standard Deviation
Source: Own elaboration based on the Intercensal Survey (INEGI, 2015), CONEVAL (2017), CONAPO (2016), and SESNSP (2018).
Specifying the Spatial Regression Model
Given that the database is cross-sectional, there is the possibility that the model may present spatial autocorrelation, which is why the use of a spatial regression model is proposed in order to correct this situation that could produce biased estimates. Therefore, the procedure consisted first of running a multiple regression model estimated with the ordinary least squares technique in the GeoDa® program.
The model is specified as follows: 𝑙𝑛𝑦i = 𝛽O + ∑𝑛&1 𝛽𝑘$i𝑘 + 𝜀I where the dependent variable yi was applied a natural logarithm of 𝑦i𝛽O & 𝛽𝑘 k=1,2…, n-1), are the independent variables 𝑋i𝑘. 𝜀i is the error term (or residual) of the equation. It is important to remember that spatial autocorrelation and spatial heterogeneity violate the principles of homogeneity of variance and independence of residuals (Miller, 1990; Selvin, 1998).
Spatial dependence will lead to inefficient regression estimators, t and F statistics will be biased, and the goodness of fit of the model will be inaccurate (Anselin, 1995).
If the spatial dependence tests of the regression model estimated by OLS show that the values of the Moran's I and the multipliers 𝐿𝑀(, 𝐿𝑀𝜌 are significant, that will imply that the model presents spatial autocorrelation; this way one will have to choose between an error spatial model or lag spatial model, through the following specification:
ln 𝑦𝑖 = 𝜌 ∗ 𝑤 ∗ 𝑙𝑛𝑦𝑖 + 𝛽O + 𝛽1 ∗ 𝑢𝑛𝑒𝑚𝑝𝑙𝑜𝑦𝑚𝑒𝑛𝑡𝑟𝑎𝑡𝑒 + 𝛽* ∗ 𝑢𝑟𝑏𝑎𝑛𝑝𝑜𝑝𝑢𝑙𝑎𝑡𝑖𝑜𝑛 + 𝛽+
∗ 𝑝𝑝18𝑦24 + ⋯ + 𝜀i
Wherein 𝑊 is the square matrix of first order Queen type spatial contiguity contacts,
W ? ln yi is the spatial lag of the logarithm of the crime rate that allows identifying the existing interrelationships in each municipality, and 𝜌 is an autoregressive parameter.
Municipalities with land communication networks and social backwardness as predictors of criminality in chiapas
The result of model 1 of robbery confirms that the municipalities communicated by main highways and railroad networks are more likely to experience robbery (See Table 6). Similarly, municipalities with a higher percentage of unemployed population and urban population have a higher rate of robberies. In contrast, municipalities with a high percentage of the population living in extreme poverty are less likely to experience robbery. The above is a sign that the poorest municipalities do not necessarily tend to experience higher crime rates, in this case of robbery. Finally, the variable referring to municipalities with border crossings was not statistically significant.
Table 6 Local Models of the Robbery and Homicide Variables in the Municipalities of the State of Chiapas (2010)
| Variables | Model 1 | Model 2 | Model 3 | Model 4 |
|---|---|---|---|---|
| Independientes | (OLS) | (SEM) | (OLS) | (SEM) |
| Robbery | Robbery | Manslaughter | Manslaughter | |
| (Constant) | 8.31 | 7.945 | -2.05 | -2.01 |
| PPEPOV | -0.157** | -0.163** | -0.02* | -0.02* |
| PURBPO | 0.136** | 0.135** | ||
| UNEMPO | 93.082** | |||
| MARGINDEX | 12.70** | 12.66** | 1.618* | 1.66* |
| MBC | -1.65 N.S. | 1.204* | 1.21* | |
| PPB18A24 | .187* | 0.16 N.S. | ||
| IMARG | .6460* | 0.55* | ||
| N | 112 | 112 | 112 | 112 |
| R2 | 0.55 | 0.74 | 0.16 | 0.24 |
| Adjusted R2 | 0.53 | 0.13 | ||
| Log-Likelihood | -389.783 | -391.87 | -210.00 | -205.68 |
| AIC | 791.50 | 799.75 | 430.01 | 423.01 |
| SC | 808.19 | 821.92 | 443.86 | 440.56 |
| Spatial dependence | ||||
| Moran’s I (error) | 0.2474** | 2.816** | ||
| LM Error | 16.04** | 5.93** | ||
| Robust LM Error | 7.92** | 0.19** | ||
| LM Lag | 8.1297** | 7.93** | ||
| Robust LM Lag | 8.05** | 1.95 |
Significance level * p< 0.05; ** p<0.001 (N.S) Not significant.
Source: Own elaboration.
The previous results support the relationship found in the municipalities identified of the Pacific coast route, Suchiate, Huixtla, Mapastepec, Tonalá, and Arriaga, which function as highway axes of the state through which the flows of irregular migrants and drug trafficking, and wherein social backwardness are also evident. The same happens in the municipalities located along the northeastern route from Tenosique, Palenque, and Tuxtla Gutiérrez.
Since the regression model only explains 55% of the variance of risks related to robbery, it is clear that other factors represent risks not accounted for in the model. This can be attributed to the fact that the estimated parameters represent the global averages of the processes that could show a substantial degree of spatial variation (Fotheringham, Bunsdon, & Charlton, 2002). Thus, a part of the unexplained variance may be associated with the assumptions of spatial seasonality of multiple regression models.
The results of the Moran’s I show that the residuals of the multiple regression model estimated by ordinary least squares present positive and statistically significant autocorrelation (Moran’s I statistic =0.2474, p-value; 0.001), which justifies the use of a spatial regression technique. The spatial distribution of the results suggests that there are no local variations in the relationship between the relative risks of the robbery rate and the characteristics of the regional context (Malczewski & Poetz, 2005).
Model 2 confirms that robbery is more likely in municipalities with higher percentages of unemployed population, urban population, and that have ground-based communication networks (highways and railroad). In contrast, robbery is less likely in municipalities with border crossings and populations in extreme poverty.
Model 3, where the dependent variable is homicide, shows a positive relationship with the municipalities with the highest index of marginalization, young population, and the proxy variables of communication networks and border crossings. This means that both municipalities with node and route functions have a higher likelihood of experiencing higher homicide rates. However, the model has a low level of explanation (R2 of 0.16 and an adjusted R2 of 0.13), thus it is not conclusive. Similarly, Moran’s I show that the model presented spatial autocorrelation, which is why model 4 (lag spatial) was run, in which the statistically significant variables were the same as in the model estimated with OLS, yet the R2 increased to 0.24.
Closing remarks
The determinants of crime rates in Chiapas and Tabasco municipalities can be explained by global and local factors. Global factors include being part of the communication networks through which unauthorized migrant flows and human trafficking pass. With regard to local factors, there are structural factors also conditioning crime rates, such as high rates of unemployment and extreme poverty.
Despite the above, the municipalities analyzed showed low crime rates, especially when it comes to homicide when compared to other states in the country. However, there are spatial patterns showing this behavior is not homogeneous for all municipalities in the state of Chiapas, since crimes are clustered both in those with border crossings as well as in those that are connected by main highways and railroad networks, as the crime pattern and routine activity theories predict. This is explained as a result of the fact that in the municipalities that are part of the communication networks, crimes are generated by the convergence in time and space of concentrations of people who potentially become targets of crime due to their vulnerability.
In addition, not all crime in the municipalities can be explained by land communication networks through which drug and human trafficking flows, but there are also socioeconomic and demographic variables that influence the levels of crime in each of the municipalities. The results of the model identify variables such as urban status, poverty levels, and unemployment rates as predictors of crime incidence, as indicated by the routine activities theory.
The identification of criminal patterns can be employed as an instrument for programs targeted at crime prevention in the municipalities that are part of the networks through which the flows of drugs and migrants pass, wherein crimes are mainly concentrated, such as robbery, motor vehicle theft, kidnapping, and rape.
Crime levels are also explained by the high levels of corruption of the State representatives, such as different police forces, agents of the National Institute of Migration, and local criminal organizations, and transnational organized crime.
Therefore, it is necessary to move from a State-centric border security approach to one of citizenship security, in which the structural causes of poverty and unemployment are addressed in order to prevent people from having to participate in criminal activities to earn an income, moreover when it comes to the young population.
Translation: Fernando Llanas
REFERENCES
Andersen, M. (2006). Crime measures and the spatial analysis of crime activity. British Journal of Criminology, 46(2), 258-285. https://doi.org/10.1093/bjc/azi054 [ Links ]
Anguiano, M.E. y Trejo, A. (2007). Políticas de seguridad fronteriza y nuevas rutas de movilidad de migrantes mexicanos y guatemaltecos. Liminar. Estudios sociales y humanísticos, 5(2), 47-65. Recuperado de https://www.redalyc.org/articulo.oa?id=74511236004 [ Links ]
Anselin, L. (1995). Local indicators of spatial association-LISA. Geographical Analysis, 27(2), 93-115. https://doi.org/10.1111/j.1538-4632.1995.tb00338.x [ Links ]
Armijo, N. (2011). Frontera sur de México: los retos múltiples de la diversidad. En N. Armijo (Ed.), Migración y seguridad: nuevo desafío en México, (pp. 35-51). México: CASEDE. [ Links ]
Basail, A. (2012). Figuig: más que una isla en el desierto. Notas de campo en un oasis entre Marruecos y Argelia. En M. C. García y M. Castañeda (Ed.), Anuario CESMECA 2010, 16(10), (pp.129-170). Tuxtla Gutiérrez: Universidad de Ciencias y Artes de Chiapas. Recuperado de http://repositorio.cesmeca.mx/handle/11595/539 [ Links ]
Benítez, R. (2011). México, Centro América y Estados Unidos: migración y seguridad. En N. Armijo (Ed.), Migración y seguridad: un nuevo desafío en México, (pp. 179-197). México: CASEDE . [ Links ]
Berumen, S., Narváez, J. C. y Ramos, L. F. (2011). La migración centroamericana de tránsito irregular por México: una aproximación a partir de registros administrativos migratorios y otras fuentes de información. En E. Rodríguez, L. M. Salazar y G. Martínez (Coords.), Construyendo estadísticas. Movilidad y migración internacional en México, (pp. 89-134). México: Centro de Estudios Migratorios/ UPM/ SPARM/ SEGOB/ TiIde editores. [ Links ]
Brantingham, P. L. y Brantingham, P. J. (1993a). Environment, routine and situation: Toward a pattern theory of crime. En R. V. Clarke y M. Felson (Eds.), Routine Activity and rational choice, Advances in Criminological theory, (pp. 29-294). New Brunswick: Transaction Publishers. [ Links ]
Brantingham, P. L. y Brantingham, P. J. (1993b). Nodes, paths and edges: considerations on the complexity of crime and the physical environment. Journal of Environment Psychology, 13(1), 3-28. https://doi.org/10.1016/S0272-4944(05)80212-9 [ Links ]
Brantingham, P. L., Brantingham, P. J. y Wong, P. S. (1991). How public transit feeds private crime: notes on the Vancouver ‘Skytrain’ experience. Security Journal, 2(2), 91- 95. [ Links ]
Cahill, M. y Mulligan, G. (2007). Using geographically weighted regression to explore local crime patterns. Social Science Computer Review, 25(2), 174-193. https://doi.org/10.1177/0894439307298925 [ Links ]
Casillas, R. (2010). Masacre de transmigrantes. Reflexiones e interrogantes sobre los significados del asesinato de 72 migrantes. Foreign Affairs Latinoamérica, 10(4), 52-59. [ Links ]
Casillas, R. (2011). The dark side of globalized migration: the rise and peak of criminal networks. The case of Central American in Mexico. Globalizations, 8(3), 295-310. https://doi.org/10.1080/14747731.2011.576846 [ Links ]
Castillo, M. A. (2000). Las políticas hacia la migración centroamericana en países de origen, de destino y de tránsito. Papeles de Población, 6(24), 133-157. Recuperado de http://www.scielo.org.mx/scielo.php?pid=S1405- 74252000000200007&script=sci_abstract&tlng=en [ Links ]
Código Penal Federal. (2017). Diario Oficial de la Federación, art. 302 [última reforma], México, 22 de junio de 2017. Cámara de Diputados del H. Congreso de la Unión. Secretaría General, Secretaría de Servicios Parlamentarios. Recuperado de https://www.gob.mx/cms/uploads/attachement/235549/Co_digo_Penal_Federal_22_06_ 2017.pdf. [ Links ]
Cohen, L. E. y Felson, M. (1979). Social change and crime rate trends: a routine activity approach. American Sociologial Review, 44(4), 588-608. https://doi.org/10.2307/2094589 [ Links ]
Consejo Nacional de Población (Conapo). (2016). Indice de marginación por entidad federativa y municipio 2015. Recuperado de https://www.gob.mx/conapo/documentos/indice-de-marginacion-por-entidad-federativa-y-municipio-2015 [ Links ]
Consejo Nacional de Evaluación de la Política de Desarrollo Social (Coneval). (2017). Medición de la pobreza 2010. Recuperado de http://coneval.org.mx/medicion/MP/Paginas/Pobreza-2010.aspx [ Links ]
El Colegio de la Frontera Norte, Unidad de Política Migratoria, Registro e Identidad de Personas, Consejo Nacional de Población, Consejo Nacional para Prevenir la Discriminación, Secretaría del Trabajo y Previsión Social y Secretaría de Relaciones Exteriores, Secretaría de Bienestar. (2012). Encuesta sobre Migración en la Frontera Sur de México, http://www.colef.mx/emif [ Links ]
Enríquez, E. y Chávez, M. (4 de diciembre de 2012). Aumentan agresiones a migrantes en Chiapas. La Jornada, p. 7A, Estados. [ Links ]
Felson, M. y Clarke, R. V. (1998). Opportunity makes the thief. Practical theory for crime prevention. Police Research Series, (98), 1-36. [ Links ]
Fotheringham, A., Brunsdon, C. y Charlton, M. (2002). Geographically weighted regression: the analysis of spatiallity varying relationships. Inglaterra: John Wiley & Sons. [ Links ]
Fuentes, C., Arzaluz, S., Díaz, E., Ixcol, C. y Mendoza, C. (2019). Seguridad pública en la región transfronteriza México-Guatemala; incidencia delictiva, vícitimas y escenarios de riesgo. Ciudad Juárez: Conacyt-Región Transfronteriza México-Guatemala. [ Links ]
Instituto de Estadística y Geografía (Inegi). (2015). Encuesta Intercensal 2015. Aguascalientes, Aguascalientes, México. Recuperado de https://www.inegi.org.mx/programas/intercensal/2015/default.html [ Links ]
International Crisis Group. (2018). La frontera sur de México: seguridad, violencia y migración (Reporte núm. 66). EE. UU.: International Crisis Group. [ Links ]
Isacson, A. y Meyer, M. (2014). Mexico´s other border: security, migration and humanitarian crisis at the line with Central America. Washington: WOLA. Recuperado de https://www.wola.org/analysis/new-wola-report-on-mexicos-southern-border/ [ Links ]
Isacson, A., Mayer, M. y Smith, H. (2017). La frontera sur de México, seguridad, migración Centroamericana y políticas estadounidenses. Washington: WOLA . Recuperado de https://www.wola.org/es/analisis/informe-de-wola-la-frontera-sur-de-mexico-seguridad- migracion-centroamericana-y-politicas-estadounidenses/ [ Links ]
Malczewski, J. y Poetz, A. (2005). Residential burglaries and neighborhood socioeconomic context in London, Ontario: global and local regression analysis. The Professional Geographer, 57(4), 516-529. https://doi.org/10.1111/j.1467-9272.2005.00496.x [ Links ]
Martínez, G., Cobo, S. y Narváez, J. (2015). Trazando rutas de la migración de tránsito irregular o no documentada por México. Perfiles Latinoamericanos, 23(45), 127-155. Recuperado de http://www.scielo.org.mx/scielo.php?script=sci_abstract&pid=S0188- 76532015000100006&lng=pt&nrm=iso [ Links ]
Miller, A. (1990). Subset selection in regression. Nueva York: Chapman and Hall. [ Links ]
Orbe, E. (9 de junio de 2019). Fuerzas federales logran decomisos de drogas en la frontera con Tabasco. El Orbe, p. 5. [ Links ]
Paris, D., Ley, M. y Peña, J. (2016). Migrantes en México, vulnerabilidad y riesgos. Un estudio teórico para el programa de fortalecimiento institucional, reducir la vulnerabilidad de migrantes en emergencia. Ginebra/México: Organización Internacional para las Migraciones/El Colef. [ Links ]
Rodríguez, E. (2013). Migración centroamericana de tránsito irregular por México. Estimaciones y características geneales. México: Centro de Estudios Migratorios-INM. [ Links ]
Rodríguez, E., Berumen, S. y Ramos, L. (2011). Migraciones centroamericanas de tránsito irregular por México. Estimaciones y características generales. México: Centro de Estudios Migratorios del INM. [ Links ]
Ruiz, O. (2001). Los riesgos de cruzar. La migración centroamericana en la frontera México- Guatemala. Frontera Norte, 13(25), 7-41. Recuperado de http://www.scielo.org.mx/scielo.php?script=sci_arttext&pid=S0187-73722001000100001 [ Links ]
Secretariado Ejecutivo del Sistema Nacional de Seguridad Pública (SESNSP). (2018). Incidencia delictiva del fuero común. Secretaría de Gobernación. Recuperado de https://www.gob.mx/sesnsp/acciones-y-programas/incidencia-delictiva-87005 [ Links ]
Selvin, S. (1998). Modern Applied Biostatistics Methods: using S-plus. Inglaterra: Oxford University Press. [ Links ]
Vilalta, C. y Fondevila, G. (2019). Modeling crime in an uptown neighborhood: the case of Santa Fe in Mexico City. Papers in Applied Geography, 5(1-2), 1-12. http://dx.doi.org/10.1080/23754931.2018.1554502 [ Links ]
Wortley, R., y Townsley, M. (Eds.). (2008). Environmental criminology and crime analysis. Cullompton: Willan Publishing. [ Links ]
Zepeda, B., González-Izás, M., y Scholter, C. (2018). Guatemala: fronteras y mercados ilegales en la era de la globalización. Guatemala: Flacso-Guatemala/Flacso- Ecuador/IDRC-CRDI. [ Links ]
2 This study derives from the project Mexico-Guatemala Cross-Border Region, Regional Dimension and Basis for its Integral Development program, first phase 2017-2018 (RTMG, acronym in Spanish for Región Transfronteriza México-Guatemala) financed by the Institutional Fund for the Regional Promotion of Technological Development and Innovation (FORDECYT, acronym in Spanish for Fondo Institucional de Fomento Regional para el Desarrollo Tecnológico y de Innovación).
3 This is striking in a national context in which most of the country’s states have shown growth in various crimes.
4 It is important to note that as of 2005 due to the damage caused by Hurricane Stan to the infrastructure that supported the train, it no longer reaches Tapachula.
5 The Mayab line connects Valladolid-Mérida-Campeche-Coatzacoalcos (1000 kilometers and the section of the jungle that includes Tenosique, Tabasco, and Palenque, in Chiapas) to continue through Palenque and reach the north of Tabasco.
6 An alternative explanation for the increase in the flow at the El Ceibo crossing is that it was due to increased activity by the National Institute of Migration (Instituto Nacional de Migración).
7 It is important to highlight the exponential growth in the homicide rate that the state of Tabasco registered as of 2012, as a result of the presence of criminal groups of the Jalisco Nueva Generación cartel. This increase in crime was also reflected in the case of Tenosique.
8 This is also explained by the presence in the area of the Los Zetas cartel, an association that characterized by the use of extreme violence during its presence in that area of the border between Chiapas and Petén, unlike the Sinaloa Cartel, which operated for a long time in the coastal municipalities and was not a source of homicidal violence.
9 More than 80% of the migrants passing through this crossing are of Honduran origin (EMIF-SUR) (COLEF et al., 2012)
10 Although the information on crimes from the Executive Secretariat of the National Public Security System does not include the migratory status of the victims, and it is very likely that migrants do not report the crimes they were subjected to. There are other sources such as EMIF-SUR and the National Human Rights Commission (CNDH, acronym in Spanish for Comisión Nacional de los Derechos Humanos) reporting on the link between being a migrant and being victim of crime.
11 Robbery is legally defined in Mexico in article 220 of the Criminal Code of the Federal District. The definition is as follows: someone who, with the intention of claiming ownership and without the consent of the person who can legally grant it, seizes someone else’s personal property with the use of violence.
12 The period 2011-2017 was chosen because the Executive Secretariat of the National Public Security System only publishes information at the municipal level as of 2011.
13 In Mexico, homicide is defined as “intentionally depriving another individual of their life” (Federal Criminal Code, 2017, article 302).
Received: September 09, 2019; Accepted: June 02, 2020
 Este es un artículo publicado en acceso abierto bajo una licencia Creative Commons
