


 texto en
  Inglés (pdf)
 Artículo en XML
 Referencias del artículo
 Enviar artículo por email
 Citado por SciELO
  Similares en
SciELO
Similares en
SciELO 
 Permalink
INTRODUCTION
The second half of the 20th century witnessed a resurgence of international migration, not just to traditional immigrant-receiving nations such as the United States and Canada, but to new destination countries throughout the world. This resurgence of transnational movement was largely motivated by the desire of migrants, in less developed nations, to access economic opportunities in more developed nations, and unsurprisingly the principal theoretical models of 20th century migration focused on the movement of workers. The neoclassical microeconomic model, for example, assumed that migrants move in order to maximize lifetime earnings whereas the new economics of labor migration viewed international migration as a strategy adopted by households to generate remittance streams that overcome missing, failed, and inefficient markets for insurance, capital, and credit (Massey et al., 1998).
The emphasis on labor migration was not confined to micro-level theories; it also characterized macro-structural theories. Segmented labor market theory argued that migration is rooted in a persistent demand for low-wage workers built into the structure of post-industrial economies. World systems theory viewed international migration as a byproduct of economic globalization, whereby workers in peripheral countries respond to the shocks of capitalist development by following links of transportation and communication to work opportunities in core capitalist nations. Neoclassical macroeconomic theory assumes that workers will move from low-wage to high-wage nations until binational market equilibrium is achieved. Social capital theory sees migrants as rational actors who make use of social networks to gain access to high-wage jobs in wealthier nations (Massey et al., 1998).
Some migrants in the 20th century were moving to escape threats rather than to access opportunities, of course. However, to the extent that people moved to escape threats, they were typically categorized as “refugees” and treated separately as objects of political and policy interest rather than theoretical concern (Fiddian-Qasmiyeh, Loescher, Long, & Sigona, 2014). In formal terms, refugees have classically been defined as people migrating to escape a well-founded fear of persecution based on race, religion, nationality, or group membership.
Over time, however, persons fleeing other threats to wellbeing apart from persecution have also come to be recognized conceptually (if not always officially) as refugees. El-Hinnawi (1985), for example, coined the term “environmental refugees” to describe persons forced to leave places of origin owing to factors such as desertification, deforestation, land degradation, and rising sea levels, as well as persons fleeing natural disasters such as draughts, hurricanes, cyclones, tornados, earthquakes, and volcanic eruptions (Suhrke, 1994; Myers & Kent, 1995; Hugo, 2008).
In addition to environmental events, another threat increasingly prevalent in the world today is violence, which may emanate from a variety of sources, including crime, civil warfare, guerilla insurgencies, terrorism, gang disputes, domestic violence, state-led repression, and conflict over scarcities created by climate change itself (Hsiang, Meng, & Crane, 2011). Indeed, studies have linked violence to migratory movements in Nepal, (Bohra-Mishra & Massey, 2011), Haiti (Shellman & Stewart, 2007), Colombia (Engel & Ibáñez, 2007; Ibáñez & Vélez, 2008; Silva & Massey, 2014), Guatemala (Morrison, 1993; Morrison & Lafaurie, 1994), Nicaragua (Lundquist & Massey, 2005; Alvarado & Massey, 2010), and Central America more generally (Massey, Durand, & Pren, 2014; Córdova & Hiskey, 2019; Inkpen, 2019).
In recent years, Mexico experienced a sharp rise in lethal violence associated with the narcotics trade. Shortly after he became President of Mexico in December 2006, Felipe Calderón, launched a direct assault on Mexico’s well-armed drug cartels, mobilizing the military to arrest drug kingpins, raid their hideouts, and eliminate their staging areas. Rather than slowing down the drug trade, Calderon’s actions spurred a sharp surge in the level of violence as the cartels fought back against the State, often placing ordinary citizens in the crossfire. Moreover, whenever authorities succeeded in capturing or killing a cartel leader, the violence did not end. Instead, it increased as the drug kingpin’s lieutenants battled among themselves to inherit territory and influence. Over time, the cartels have also expanded into other rackets, such as threatening citizens who resist extortion demands, fail to pay ransoms, cooperate with law enforcement authorities, or simply get in the way.
The solid black line in Figure 1 draws on data from Mexico’s Instituto Nacional de Estadística y Geografía (INEGI, 2019) to show the trend in the Mexican homicide rate from 1990 to 2018. As can be seen, prior to Calderón’s assumption of office at the end of 2016, the murder rate had been falling, going from a figure of 19.7 per 100,000 in 1992 to bottom out at 8.4 per 100,000 in 2007. Thereafter it shot upward to peak at 24.2 per 100,000 in 2011, higher than at any point in the prior four decades.
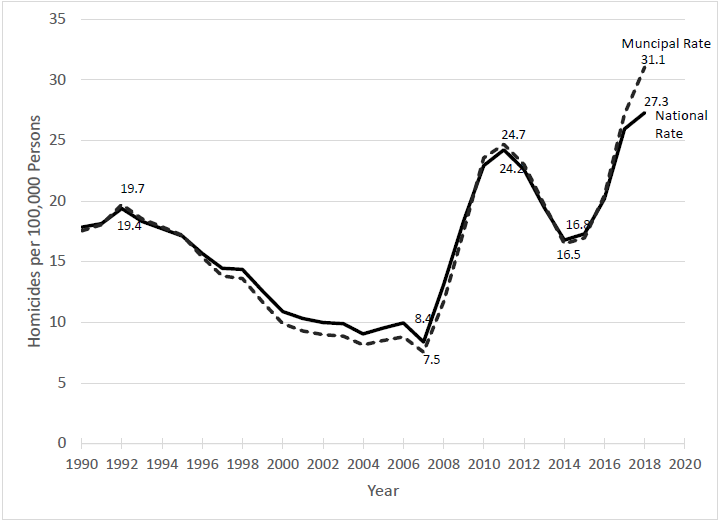
Source: Authors’ elaboration of INEGI homicide data (INEGI, 2009).
Figure 1. Mexican Homicide Rate by Year 1990-2018
Following Calderón’s departure from office in late 2012, the homicide rate fell during the early years of Enrique Peña Nieto’s administration. Subsequently, however, the decline stalled out at 16.8 in 2016 and then rose sharply back up to 27.3 in 2018, his final year in office. The rise in lethal violence has led to speculation that the risk of homicide might have become a driver of Mexican migration, both externally to the United States and internally within Mexico (McCaffrey & Scales, 2011; Correa-Cabrera, 2013; Albuja, 2014). The empirical results on the effects of violence on migration, however, have been mixed.
Using national-level homicide rates to indicate violence within Mexico, both Alvarado and Massey (2010) and Massey, Durand, and Pren (2014) found no significant effect on violence on the likelihood of departure to the United States. In contrast, Arceo-Gómez (2012) found that rising rates of violence in Mexico’s northern states were associated with the arrival of Mexican immigrants north of the border, a finding consistent with the evidence adduced by Chort and Rupelle (2016). Rios Contreras (2014) likewise found that increasing drug-related homicides within communities increased out-migration above what normally would have been expected from conditions prevailing in Mexico and the United States. However, Basu and Pearlman (2017) found little evidence that rising violence had increased rates of out-migration from Mexican municipalities, either to the United States or within Mexico. More recently, Orozco-Aleman and Gonzalez-Lozano (2018) found that violence within Mexican municipalities increased migration to the United States whereas violence along routes to the north discouraged such migration, with the overall balance of these opposing effects working to increase the rate of international migration modestly.
In this paper, we revisit the question of the effect of violence on Mexican migration to improve upon prior analyses. First, we draw upon new data from INEGI that provides homicide rates by municipio4 from 1990 through 2018. Second, in addition to considering undocumented emigration to the United States, we simultaneously consider the effect of lethal violence on internal migration within Mexico.
We focus on undocumented U.S. migration because legal entry is constrained by U.S. policies that do not permit agentic migration as a response to changing circumstances at points of origin. Given that movement within Mexico is far easier and less costly than migrating to the United States, we hypothesize that if there is a migratory response to rising violence it is more likely to be expressed in the form of short-distance moves to safer but more accessible locations in Mexico rather than undertaking an undocumented departure for the United States.5
In the ensuing sections, we describe our data and analytic methods and then estimate a series of multivariate logistic regression models to conduct a discrete-time event history analysis to determine whether and how exposure to lethal violence within a person’s municipio of residence affects the likelihood of migrating without documents to the United States versus moving to another location within Mexico. Results indicate that the local homicide risk positively predicts migration within Mexico but negatively predicts the odds of unauthorized migration to the United States.
DATA AND METHODS
Our data on migration comes from the latest incarnation of the Mexican Migration Project database (MMP170), which includes information on 28,319 households from 170 Mexican communities surveyed between 1987 and 2018, with 27,262 households interviewed in Mexico and 1,057 in U.S. destination communities. Information for the MMP is collected using a semi-structured interview schedule that compiles basic social, economic, and demographic data on the household head, the spouse, all children of the head (noting which ones no longer live in the household), and other household residents present at the time of the survey.
A detailed life history is compiled for each household head and spouse, which includes complete histories of migration, labor force participation, and border crossing. Household heads with U.S. migrant experience also answer a detailed set of questions about their most recent U.S. trip. Since 2007 these questions have been administered to another household member with U.S. experience whenever the head has not been to the United States.
The data for the present analysis comes from life histories compiled for household heads, which we used to undertake a discrete-time event history analysis predicting the likelihood of taking first and additional trips away from the origin community to destinations in the United States or elsewhere in Mexico. From the life histories, we created a person-year file that followed each household head from age 15 to the date of the first trip within Mexico, the first undocumented trip to the U.S., or the survey date, whichever came first. The outcome variable was coded 0 in person-years where no trip was taken, 1 if a first trip was taken within Mexico, and 2 if a trip was made to the United States.
In addition, we created two other person-year files: one following Mexican migrants from the time of their return from the first trip to the time of their second Mexican trip, first U.S. trip, or the survey date, whichever came first, plus another file that followed U.S. migrants from the time of their return from the first trip to the U.S. to the time of their first Mexican trip, second undocumented U.S. trip, or the survey date, whichever came first. As before, the outcome variable was coded 0 in persons-years when no additional trip was taken, 1 if a trip was taken within Mexico, and 2 if a trip was taken to the United States.
Using these files, we estimated multinomial logit models to predict the probability of out- migration to each destination (the United States or Mexico) in year t+1 from independent variables defined in year t. The independent variables used in our statistical models are essentially those used in earlier analyses by Massey, Durand, and Pren (2014, 2016) except that we substituted municipal-level homicide rates for the national homicide rates used in Massey et al. (2014), employing the data recently made available by INEGI (2019).
The dashed line in Figure 1 shows the trend in average homicide rate computed across person years for municipios in the MMP171 dataset. As can be seen, the trend in municipal homicide rates closely follows the national trend except that after 2017 and 2018, when the average municipio rate rises sharply above the national rate, suggesting that violence worsened particularly in MMP communities at the end of the Peña Nieto administration. Indeed, of the nine communities surveyed during 2017 and 2018, five were in the state of Morelos where the homicide rate was 42% above the national average. Apart from this departure, however, the municipio rates generally follow the same trend as the national rates, falling through 2007 and rising thereafter.
Means and standard deviations for independent variables are listed in Table 1. Except for the region of origin, all variables are time-varying, and the figures are computed across the 202,819 person-years in the dataset that we used to model of first departures. The principal variable of interest is the municipal homicide rate, measured as murders per 100,000 persons (see INEGI, 2019). In estimating homicide’s effect on migration, we hold constant three other elements of the Mexican context: the rate of GDP growth, the rate of population growth, and the minimum daily wage. We also control for several contextual variables on the U.S. side: the natural log of the Border Patrol budget in 2015 dollars, the rate of U.S. employment growth, the number of legal residence or work visas issued to Mexicans, and the U.S. daily earnings for eight hours of labor at the minimum wage. The foregoing control variables were downloaded from the Mexican Migration Project Database and extracted from the publicly available NATLYEAR and NATLHIST files (see MMP, 2020).
Table 1. Means and Standard Deviations of Independent Variables Used in Analysis of Violence and Migration in Mexico
| Variable | Means | S.D. |
|---|---|---|
| Mexican Context | ||
| Municipal Homicide Rate | 15.33 | 4.20 |
| Rate of GDP Growth (%) | 3.56 | 14.30 |
| Population Growth Rate (%) | 1.56 | 0.18 |
| Mexican Minimum Daily Wage | 4.81 | 0.80 |
| U.S. Context | ||
| LN Border Patrol Budget | 7.48 | 0.45 |
| Rate of US Employment Growth (%) | 1.02 | 1.20 |
| Residence / Work Visas (000) | 389.45 | 265.57 |
| U.S. Minimum Daily Wage | 56.40 | 3.41 |
| Demographic Background | ||
| Age | 41.21 | 16.02 |
| Female | 0.18 | 0.38 |
| Married | 0.74 | 0.44 |
| No. of Minors in Household | 1.59 | 1.75 |
| Human Capital | ||
| Years of Labor Force Experience | 26.83 | 16.56 |
| Years of Education | 6.45 | 4.32 |
| Months of Prior US Experience | 0.10 | 5.80 |
| Agricultural occupation | 0.34 | 0.47 |
| Unskilled occupation | 0.35 | 0.48 |
| Skilled occupation | 0.16 | 0.37 |
| Social Capital | ||
| Parent a U.S. Migrant | 0.02 | 0.12 |
| No. of U.S. Migrant Siblings | 0.20 | 0.69 |
| Spouse a U.S. migrant | 0.002 | 0.05 |
| No. of U.S. migrant children | 0.22 | 0.79 |
| No. of U.S. Born children | 0.002 | 0.05 |
| Prop U.S. Migrants in Community | 10.83 | 9.94 |
| Physical Capital | ||
| Land | 0.15 | 0.36 |
| Home | 0.69 | 0.46 |
| Business | 0.18 | 0.38 |
| Region of Origin | ||
| Historical | 0.31 | 0.46 |
| Community Size | ||
| Metropolitan Area (100,000+) | 0.16 | 0.36 |
| Small Cities (10,000-99,999) | 0.23 | 0.42 |
| Town (2,501-9,999) | 0.44 | 0.50 |
| Rural Villages ( < =2,500) | 0.18 | 0.38 |
| Number of Person-Years | 202,819 | |
Source: Authors’ elaboration of Mexican Migration Project Data (MMP, 2020).
At the individual level, we control for the individual’s demographic background (age, gender, marital status, children present in the household), human capital (years of labor force experience, years of schooling, months of U.S. experience, occupational skill), social capital (parent a U.S. migrant, number of U.S. migrant siblings, spouse a U.S. migrant, number of U.S. migrant children, number of U.S. born children, and the proportion of people in the origin community with U.S. experience), and physical capital (ownership of land, home, and business enterprises).
A dummy variable indicates the historical region for migration to the United States (which includes the states of Guanajuato, Jalisco, Michoacán, San Luís Potosí, and Zacatecas), where migration to the U.S. has its deepest roots. Finally, we control for the size of the origin community by using dummy variables to indicate metropolitan areas (100,000+ inhabitants), small cities (10,000-99,999 inhabitants), towns (2,501-9,999 inhabitants), and rural villages ( < =2,500 inhabitants).
PREDICTING FIRST MIGRATION
Table 2 presents a discrete time event history model estimated to predict the likelihood of migration on a first trip within Mexico versus a first trip to the United States. As shown in the top line, we see that the municipal homicide rate has a significant positive effect on the probability of initiating migration to another community within Mexico (p < 0.01) but a negative effect on the likelihood of initiating migration to the United States (p < 0.001).
Table 2. Discrete Time Event History Analysis Predicting the Probability of Taking a First Trip within Mexico versus a First Undocumented Trip to the United States (1990 to 2018)
|
Trip
Variable |
First Mexican Trip | First Undocumented | |||
|---|---|---|---|---|---|
| B | SE | B | SE | ||
| Mexican Context | |||||
| Municipal Homicide Rate | 0.028** | 0.013 | -0.133*** | 0.200 | |
| Rate of GDP Growth (%) | -0.004* | 0.002 | -0.006** | 0.002 | |
| Population Growth Rate (%) | -0.226 | 0.647 | 0.599 | 0.626 | |
| Mexican Minimum Daily Wage | 0.084 | 0.159 | 0.413** | 0.145 | |
| U.S. Context | |||||
| LN Border Patrol Budget | -0.344 | 0.804 | -0.164 | 0.878 | |
| Rate of US Employment Growth | 0.042 | 0.038 | 0.059 | 0.037 | |
| Residence / Work Visas (000) | 0.000 | 0.000 | -0.002*** | 0.0002 | |
| U.S. Minimum Daily Wage | 0.062 | 0.109 | 0.098 | 0.120 | |
| Demographic Background | |||||
| Age | 0.010 | 0.017 | -0.034 | 0.021 | |
| Age-Squared | 0.000 | 0.000 | -0.001*** | 0.0003 | |
| Female | -0.096 | 0.097 | -1.216*** | 0.139 | |
| Married | -0.114 | 0.082 | 0.063 | 0.081 | |
| No. of Minors in Household | -0.005 | 0.028 | 0.032 | 0.023 | |
| Human Capital | |||||
| Years of Labor Force Experience | -0.024** | 0.008 | 0.024** | 0.001 | |
| Years of Education | 0.044*** | 0.010 | -0.027** | 0.009 | |
| Agricultural occupation | --- | --- | --- | --- | |
| Unskilled occupation | -0.015 | 0.072 | -0.051 | 0.063 | |
| Skilled occupation | -0.233** | 0.104 | -0.672*** | 0.114 | |
| Social Capital | |||||
| Parent a U.S. Migrant | 0.224 | 0.186 | 0.779*** | 0.131 | |
| No. of U.S. Migrant Siblings | 0.031 | 0.043 | 0.240*** | 0.026 | |
| Spouse a U.S. migrant | -0.521 | 0.596 | 1.513*** | 0.234 | |
| No. of U.S. migrant children | -0.152 | 0.110 | 0.170** | 0.082 | |
| No. of U.S. Born children | 0.144 | 0.469 | -13.187 | 590.172 | |
| Prop U.S. Migrants in Community | 0.030*** | 0.003 | 0.024*** | 0.003 | |
| Physical Capital | |||||
| Land | -0.074 | 0.147 | -0.532 | 0.121 | |
| Home | -1.372*** | 0.087 | -0.153** | 0.071 | |
| Business | -0.342** | 0.119 | -0.396*** | 0.114 | |
| Region of Origin | |||||
| Historical | -0.398*** | 0.073 | -0.135** | 0.065 | |
| Community Size | |||||
| Metropolitan Area (100,000+) | -- | -- | -- | -- | |
| Small Cities (10,000-99,999) | -0.541*** | 0.093 | 0.946*** | 0.130 | |
| Town (2,501-9,999) | -0.644*** | 0.088 | 0.795*** | 0.128 | |
| Rural Villages ( < =2,500) | -0.519*** | 0.109 | 1.213*** | 0.130 | |
| Intercept | -5.380*** | 1.001 | -8.625*** | 1.023 | |
| Log Likelihood | -12994.793 | ||||
| Likelihood Ratio Chi Square | 3856.160*** | ||||
| Number of Person-Years | 201,899 | ||||
Source: Authors’ elaboration of Mexican Migration Project data (MMP, 2020).
+p = 0.10;
*p < 0.05;
**p < 0.01;
***p < 0.001
Whereas every point increased in the municipal level homicide rate raises the odds of leaving for a Mexican destination by 2.8% [exp(0.028)=1.028], the same increase lowers the odds of leaving for a U.S. destination by 12.5% [1- exp(-0.133)=0.125]. Thus, consistent with our hypotheses, rising lethal violence across Mexican municipalities promotes internal migration within Mexico but inhibits undocumented migration to the United States. Therefore, rising levels of lethal violence in Mexico do not appear to be a significant cause of initiating migration to the United States, contrary to what some have hypothesized.
Among the other independent variables, the rate of GDP growth in Mexico is negatively associated with the likelihood of migration both internally and internationally, with each point increase lowering the odds of migration within Mexico by 0.4% and the odds of migration to the United States by 0.6%. Although the value of the minimum wage displays a positive association with both internal and international migration, only the latter is significant statistically (p < 0.01), with every extra dollar earned in Mexico raising the odds of first undocumented departure by 51%. Thus, migration to the United States is not predicted by poverty and stagnant wages but is facilitated instead, by better economic conditions and rising wages.
With respect to the U.S. context, none of the indicators are significantly associated with the likelihood of internal migration within Mexico; and only one U.S. indicator predicts the probability of initiating undocumented migration (access to U.S. visas) and its effect is negative. For every additional 1,000 visas available for U.S. work or residence, the odds of unauthorized migration drop by 0.2%, illustrating the direct tradeoff between documented and undocumented migration. As prior studies have found, the odds of undocumented departure are not significantly predicted by the size of the Border Patrol budget, suggesting that border enforcement has little influence on the decision to initiate unauthorized migration to the United States.
Turning to demographic characteristics, we see that the propensity to initiate migration within Mexico is not related to age, gender, or marital status. In contrast, undocumented migration to the U.S. is negatively predicted by rising age and is significantly lower among women (p < 0.001), with the odds of first departure being 70% lower for females. In terms of human capital, the effects of labor force experience and education have opposite signs in predicting U.S. versus Mexican migration.
Migrants to the United States are positively selected when it comes to labor force experience but negatively selected concerning education whereas migrants within Mexico are negatively selected with respect to labor force experience and positively selected on education. Although migrants to both destinations are negatively selected on occupational skills, the effect is much greater for migration to the United States.
As one would expect, U.S.-specific indicators of social capital strongly and positively predict departure for the United States but have little effect on migration within Mexico. Thus, the likelihood of taking a first U.S. trip is significantly greater for those who have a U.S. migrant parent and a U.S. migrant spouse and rises with the number of U.S. migrant siblings and the number of U.S. migrant children.
The probability of departure to the United States also rises as the share of people with U.S. migrant experience, in a community, increases. Although the likelihood of internal migration also increases as the share of U.S. migrants in the community rises, none of the other social capital indicators significantly predict the first departure to a destination in Mexico.
Ownership of a home or a business negatively predicts departure to both destinations, though the negative coefficient for homeownership is much stronger in predicting migration within Mexico than migration to the United States, reducing the odds of departure to the former by 75% but to the latter by just 14%. Likewise, the odds of departure from the historical homeland for U.S. migration are much lower for internal than for international migrants, with the odds of departure being 33% lower to Mexican destinations compared to just 13% lower to U.S. destinations.
As in earlier studies, the probability of taking a first U.S. trip is greatest in rural villages and higher in small towns and cities than in large metropolitan areas. In contrast, migration within Mexico is most likely in metropolitan areas and least likely in small cities, towns, and villages, suggesting that migration in Mexico is increasingly urban-to-urban rather than rural-to-urban.
PREDICTING ADDITIONAL MIGRATION
Table 3 continues the analysis by observing migrants who took a first trip to a Mexican destination from the point at which they returned from that trip onward, estimating a multinomial logistic regression equation across person-years to predict the likelihood of taking an additional trip within Mexico or a first trip to the United States.
Table 3. Discrete Time Event History Analysis Predicting Additional Trip within M Mexico or a First Undocumented Trip to the United States among
| Additional Mexican Trip | First Undocumented Trip | |||
|---|---|---|---|---|
| Variable | B | SE | B | SE |
| Mexican Context | ||||
| Municipal Homicide Rate | -0.037* | 0.022 | -0.151** | 0.500 |
| Rate of GDP Growth (%) | -0.006 | 0.004 | -0.004 | 0.006 |
| Population Growth Rate (%) | -0.990 | 0.973 | 2.858* | 1.663 |
| Mexican Minimum Daily Wage | 0.330 | 0.241 | 0.191 | 0.382 |
| U.S. Context | ||||
| LN Border Patrol Budget | 2.974* | 1.118 | -1.439 | 1.898 |
| Rate of US Employment Growth | 0.071 | 0.058 | 0.188* | 0.107 |
| Residence / Work Visas (000) | -0.000 | 0.000 | -0.001 | 0.001 |
| U.S. Minimum Daily Wage | -0.320** | 0.153 | 0.330 | 0.258 |
| Demographic Background | ||||
| Age | 0.035 | 0.029 | -0.166*** | 0.044 |
| Age-Squared | -0.001** | 0.000 | 0.000 | 0.001 |
| Female | -0.633*** | 0.168 | -1.235*** | 0.322 |
| Married | -0.010 | 0.125 | 0.330* | 0.197 |
| No. of Minors in Household | 0.014 | 0.035 | 0.031 | 0.052 |
| Human Capital | ||||
| Years of Labor Force Experience | -0.016 | 0.011 | 0.055** | 0.021 |
| Years of Education | 0.020* | 0.012 | -0.030 | 0.021 |
| Prior U.S. Experience (Months) | --- | ---- | --- | ---- |
| Agricultural occupation | --- | ---- | --- | ---- |
| Unskilled occupation | 0.030 | 0.122 | 0.015 | 0.171 |
| Skilled occupation | 0.100 | 0.142 | -0.477* | 0.249 |
| Social Capital | ||||
| Parent a U.S. Migrant | -0.074 | 0.242 | 0.242 | 0.297 |
| No. of U.S. Migrant Siblings | -0.006 | 0.055 | 0.285*** | 0.058 |
| Spouse a U.S. migrant | 0.295 | 0.606 | 0.875 | 0.565 |
| No. of U.S. migrant children | 0.017 | 0.133 | 0.135 | 0.151 |
| No. of U.S. Born children | -0.122 | 0.313 | -0.035 | 0.301 |
| Prop U.S. Migrants in Community | 0.009* | 0.005 | 0.009 | 0.007 |
| Physical Capital | ||||
| Land | 0.088 | 0.178 | 0.245 | 0.246 |
| Home | -0.839*** | 0.106 | -0.111 | 0.162 |
| Business | -0.547*** | 0.150 | -0.820** | 0.266 |
| Region of Origin | ||||
| Historical | 0.134 | 0.108 | -0.191 | 0.169 |
| Community Size | ||||
| Metropolitan Area (100,000+) | --- | ---- | --- | ---- |
| Small Cities (10,000-99,999) | 0.319** | 0.138 | 0.742** | 0.242 |
| Town (2,501-9,999) | 0.067 | 0.132 | 0.887*** | 0.220 |
| Rural Villages ( < =2,500) | 0.595*** | 0.147 | 0.786** | 0.250 |
| Intercept | -7.871*** | 1.561 | -12.850*** | 2.693 |
| Log Likelihood | -3719.975 | |||
| Likelihood Ratio Chi Squared | 878.710*** | |||
| Number of Person-Years | 46,644 | |||
Source: Authors’ elaboration of Mexican Migration Project data (MMP, 2020).
+p = 0.10;
*p < 0.05;
**p < 0.01;
***p < 0.001
As shown in the first line of the table, among migrants with one prior trip within Mexico, the municipal homicide rate negatively predicts both an additional Mexican trip and a first trip to the United States, though the size of the coefficient is significantly greater in predicting international than internal trips. Whereas a one-point increase in the homicide rate decreases the odds of taking a second Mexican trip by 3.6% (p < 0.05), it reduces the odds of taking a first international trip by 14% (p < 0.01).
The only other significant coefficient among the Mexican contextual indicators pertains to the influence of Mexican population growth on the odds of taking a first U.S. trip. For those who have taken one prior trip within Mexico, each percentage point increase in Mexican population growth increases the odds of initiating migration to the United States by a rather large factor of 17.4 (p < 0.05). Turning to the U.S. context, we see that the odds of taking an additional trip to Mexico are reduced by higher minimum wage levels in the United States (p < 0.01) but rise as the budget of the Border Patrol increases (p < 0.05).
With respect to demographic characteristics, the likelihood of taking an additional Mexican trip displays a curvilinear relationship with age whereas the likelihood of taking a first U.S. trip declines steadily as age increases. The probability of taking either an additional Mexican trip or a first U.S. trip is lower for women than men, but the coefficient is larger for the latter (-1.235) than the former (-0.633). Whereas being married positively predicts first migration to the United States (p < 0.05) it has no significant effect on the likelihood of taking an additional trip within Mexico. Conversely, education has a positive effect on the odds of taking another trip within Mexico (p < 0.05) but has no influence on the likelihood of taking a first U.S. trip.
Among social capital indicators, the only significant relationship is that between the number of U.S. migrant siblings and the probability of initiating U.S. migration. Each additional migrant sibling raises the odds of a first U.S. trip by around 33%. Owning a home or a business is negatively associated with the likelihood of taking both an additional Mexican trip and a first U.S. trip, though the coefficient linking home ownership to undocumented U.S. migration is not statistically significant.
Finally, the odds of initiating migration to the United States are once again higher in small cities, towns, and villages than in metropolitan areas. However, among those with prior migrant experience in Mexico, the odds of taking an additional Mexican trip are greater in small cities, towns, and rural villages than in metropolitan areas, whereas in the prior table they were lower in non-metropolitan communities, though the coefficient linking towns to additional Mexican trips is not significant.
Table 4 concludes the analysis by considering migrants who took their first trip to the United States, following them from the point of return to the origin community onward to predict the likelihood of taking an additional U.S. trip or a first trip within Mexico. As shown in the table’s first line, among returned U.S. migrants the likelihood of taking a first trip within Mexico is not significantly predicted by the homicide rate.
Table 4. Discrete Time Event History Analysis Predicting a First Mexican Trip or an Additional Undocumented U.S. Trip for Persons whose First Trip was to the United States (1990 to 2018)
|
Trip
Variable |
First Mexican Trip | Additional Undocumented | ||
|---|---|---|---|---|
| B | SE | B | SE | |
| Mexican Context | ||||
| Municipal Homicide Rate | 0.032 | 0.041 | -0.143*** | 0.030 |
| Rate of GDP Growth (%) | -0.004 | 0.008 | -0.006 | 0.004 |
| Population Growth Rate (% | 2.559 | 2.047 | 0.598 | 0.993 |
| Mexican Minimum Daily Wage | -0.667 | 0.500 | 0.729** | 0.235 |
| U.S. Context | ||||
| LN Border Patrol Budget | 0.517 | 2.719 | -2.144 | 1.498 |
| Rate of US Employment Growth | 0.131 | 0.126 | 0.006 | 0.057 |
| Residence / Work Visas (000) | 0.001 | 0.001 | -0.002*** | 0.000 |
| U.S. Minimum Daily Wage | -0.087 | 0.368 | 0.368* | 0.203 |
| Demographic Background | ||||
| Age | -0.004 | 0.064 | -0.045 | 0.034 |
| Age-Squared | 0.001 | 0.000 | 0.000 | 0.000 |
| Female | 0.472 | 0.393 | -0.398 | 0.277 |
| Married | -0.239 | 0.275 | 0.225 | 0.139 |
| No. of Minors in Household | -0.014 | 0.083 | 0.005 | 0.037 |
| Human Capital | ||||
| Years of Labor Force Experience | 0.027 | 0.032 | 0.015 | 0.016 |
| Years of Education | 0.001 | 0.033 | -0.023 | 0.016 |
| Months of Prior U.S. Experience | -0.002 | 0.002 | -0.005*** | 0.001 |
| Agricultural occupation | ---- | ---- | ---- | ---- |
| Unskilled occupation | 0.226 | 0.254 | -0.525*** | 0.104 |
| Skilled occupation | -0.408 | 0.451 | -0.683*** | 0.185 |
| Social Capital | ||||
| Parent a U.S. Migrant | -0.636 | 0.456 | -0.138 | 0.193 |
| No. of U.S. Migrant Siblings | -0.032 | 0.082 | 0.062* | 0.034 |
| Spouse a U.S. migrant | -0.031 | 0.378 | -0.824** | 0.269 |
| No. of U.S. migrant children | -0.205 | 0.215 | 0.031 | 0.094 |
| No. of U.S. Born children | 0.056 | 0.186 | -0.079 | 0.137 |
| Prop U.S. Migrants in Community | 0.004 | 0.009 | -0.006 | 0.004 |
| Physical Capital | ||||
| Land | 0.182 | 0.378 | 0.007 | 0.145 |
| Home | -1.584*** | 0.265 | -0.128 | 0.109 |
| Business | 0.051 | 0.338 | -0.407** | 0.169 |
| Region of Origin | ||||
| Historical | 0.185 | 0.213 | -0.468*** | 0.105 |
| Community Size | ||||
| Metropolitan Area (100,000+) | ---- | ---- | ---- | ---- |
| Small Cities (10,000-99,999) | -0.708** | 0.349 | 0.688** | 0.229 |
| Town (2,501-9,999) | -0.850** | 0.336 | 0.447** | 0.227 |
| Rural Villages ( < =2,500) | -0.791** | 0.393 | 0.724** | 0.234 |
| Intercept | -4.701 | 3.314 | -8.350*** | 1.667 |
| Log Likelihood | -2872.309 | |||
| Likelihood Ratio Chi Squared | 643.182*** | |||
| Number of Person-Years | 30,847 | |||
Source: Authors’ elaboration of Mexican Migration Project data (MMP, 2020).
+p = .10;
*p < .05;
**p < .01;
***p < .001
As in the model predicting first U.S. trips, however, the effect of homicide on the likelihood of taking an additional U.S. trip is strongly and significantly negative (p < 0.001). Indeed, with a coefficient value of -0.143 the effect is roughly of the same magnitude as in the prior two tables. Once again, the effect of lethal violence is to inhibit rather than to promote international migration to the United States.
Beyond the homicide rate, the likelihood of initiating migration within Mexico among returned first-time U.S. migrants is predicted by a few other variables. Among returned U.S. migrants, homeowners are less likely to migrate internally as are residents of non- metropolitan communities. In contrast, the likelihood of taking an additional undocumented trip to the United States is significantly related to a variety of independent variables.
Additional U.S. migration is positively predicted by the Mexican minimum wage, the number of U.S. migrant siblings, and residence in non-metropolitan communities, but is once again negatively predicted by the availability of legal U.S. visas, cumulative prior U.S. experience, having a migrant spouse, business ownership, and non-metropolitan residence.
CONCLUSION
Mexican President Felipe Calderón took office in December of 2006 and immediately launched an all-out war on the nation’s drug cartels, leading to a massive increase in lethal violence. From 2007 to 2011 Mexico’s homicide rose nearly three times and the killing has continued under Calderón’s successor Enrique Peña Nieto. By 2015 the cumulative total of murders since 2007 had reached 164,345 (Breslow, 2015) and at the end of 2018 it stood at 278,000. Although some have speculated that lethal violence might be a driver of migration to the United States, previous attempts to assess its effect on Mexican migration patterns have been hampered by a lack of reliable data at the municipio level.
Here we improve on earlier studies by using municipio- rather than national-level homicide rates to predict the migratory behavior of household heads surveyed by the Mexican Migration Project. Specifically, using homicide rates computed by INEGI for Mexican municipios from 1990 to 2018, we estimated a series of discrete-time event history models using multinomial logit regression analysis to predict first and additional trips to the United States and within Mexico.
While our estimates indeed detect a migratory response to lethal violence, it does not involve migration to the United States. Instead, the effect of homicide on the likelihood of taking a first undocumented trip to the United States is strongly and significantly negative. Rather than moving to the United States, the initial migratory response to lethal violence is expressed by moving to another destination within Mexico, as indicated by the strong and significant positive effect of homicide on the likelihood of taking a first Mexican trip.
Among internal migrants who have returned from a first trip within Mexico, however, the effect of exposure to a rising rate of homicide on the likelihood of taking an additional internal trip is negative, just as it is in predicting undocumented migration to the United States, though the deterrent effect on out-migration is smaller for internal than international trips. Among international migrants who have returned from a first U.S. trip, the muncipio homicide rate continues to have a strong and significant negative effect in predicting an additional undocumented U.S. trip but has no effect on the likelihood of taking a trip to a destination within Mexico.
The effect of rising lethal violence on the probability of migration to the United States is illustrated in Figure 2 , which presents predicted probabilities of taking an undocumented U.S. trip from the models shown in Tables 2-4 . The estimates were prepared by varying the muncipio-level homicide rate from 8 to 32 deaths per hundred thousand (the observed range of values) while holding other variables constant at their means. The solid line demonstrates the effect of rising lethal violence on the likelihood of taking a first undocumented U.S. trip relative to taking a first Mexican trip or not migrating at all. As can be seen, the likelihood of a first undocumented departure falls from an annual probability of 0.006 at the lowest rate of homicide to zero at the highest rate.
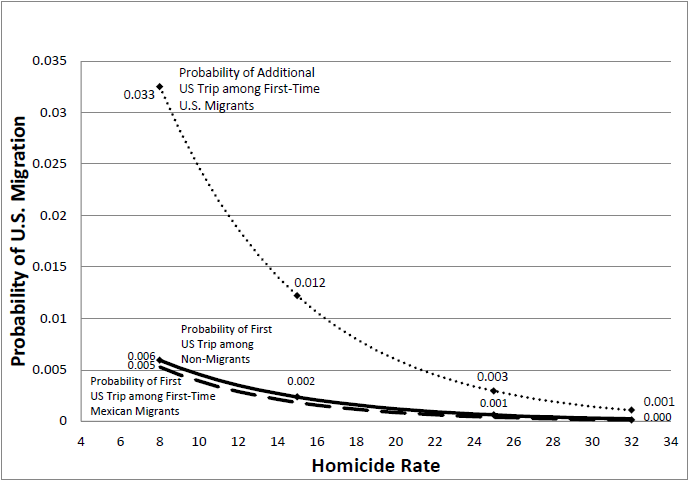
Source: Authors’ elaboration of Mexican Migration Project data (MMP, 2020).
Figure 2. Effect of Rising Homicide Rate on Probability of Migration to the United States
The dashed line just below the solid line shows how rising homicide rates influence the likelihood of taking a first undocumented trip the United States among those who have returned from a first trip within Mexico. The probability of departing for the United States in irregular status is much the same for internal migrants who have logged one prior trip within Mexico as for non-migrants, falling from a value of 0.005 with a homicide rate of eight per hundred thousand to zero at a rate of 32 per 100,000. As we would expect, the likelihood of departing for the United States on an additional undocumented trip is much greater among those migrants who have already been to the United States.
As indicated by the dotted line, the probability of taking an additional undocumented trip is 0.033 in communities with the lowest observed homicide rates, falling to just 0.001 among those with the highest observed homicide rates. Even among experienced U.S. migrants, therefore, rising exposure to the risk of homicide has a powerful effect in reducing the likelihood of going again to the United States without documents, possibly because households containing experienced migrants with access to remittances are targeted for extortion by criminal elements.
In sum, our results strongly suggest that the rising tide of lethal violence in Mexico is not an important driver of unauthorized migration to the United States. To the extent that violence has any effect on U.S. migration, it is likely confined to very affluent, educated Mexicans living near the U.S. border rather than the broader mass of Mexicans dispersed throughout the nation (Arceo-Gómez, 2012; Correa-Cabrera, 2013).
If anything, the rise of lethal violence is likely to have contributed to the decline of undocumented migration to the United States. Recent work indicates that undocumented Mexican migration ended in 2008 when the net volume of undocumented entries turned negative, causing the undocumented population to fall from 6.9 million to 5.6 million between 2008 and 2016 (Passel & Cohn, 2017).
Massey, Durand, and Pren (2016) attributed this fading of undocumented Mexican migration to the steady rise in the average age of those at risk of migration to the United States, which rose from an average age of 23 in 1970 to 45 in 2010, owing to Mexico’s transition to replacement-level fertility. According to data from the MMP, by 2018 the average age of those at risk of migration (those aged 15 or older) had reached 48. However, in addition to the rising average age in Mexico and the greater availability of legal visas for temporary and permanent entry into the United States, the present analysis suggests that the rising risk of homicide constitutes an additional factor helping to explain the decline of undocumented Mexico-U.S. migration since 2008.

