


Serviços Personalizados
Journal
Artigo
 Inglês (pdf)
 Artigo em XML
 Referências do artigo
 Enviar este artigo por email
Indicadores
-
 Citado por SciELO
 -
 Acessos
Links relacionados
-
 Similares em
SciELO
Similares em
SciELO
Compartilhar

 Permalink
Ingeniería mecánica, tecnología y desarrollo
versão impressa ISSN 1665-7381
Ingenier. mecáni. tecnolog. desarroll vol.4 no.5 México Set. 2013
Artículos
Indirect assessment of air conditioning energy savings in buildings
Joaquín Gutiérreza, Juan Francisco Villa-Medinaa José L. Fernández-Zayasb, and Miguel Ángel Porta-Gándaraa*
a Engineering Group, Centro de Investigaciones Biológicas del Noroeste S.C. La Paz 23000, BCS, México. *Corresponding author: Tel: +52-612-1238484 x 3614. E-mail address: maporta@cibnor.mx
b Instituto de Ingeniería, UNAM, Coyoacán 04510, D.F., México.
Fecha de recepción: 24-03-2013
Fecha de aceptación: 10-05-2013
Abstract
Electric consumption of a public building in the Northwestern Mexico town of La Paz is markedly oriented to the use of air conditioners (AC). The impact of AC on electrical bills is found to account for about one third of the total yearly expense. New laws and international agreements mandate that drastic electrical bill reductions be adopted in all public buildings, while no detailed measurements are available, and no specific savings opportunities have been established. An overall review of practical improvements reveals that implanting energy efficiency measures could be economically viable. An exploration of the overall electrical bill indicates which electrical uses would entail higher savings addressing weather- and non-weather-related electrical loads. Basic savings scenarios are explored to improve energy efficiency in office and laboratory equipment, as well as in electrical lighting. These findings indicate the need of measuring and monitoring, as part of a more lasting and formal campaign for energy savings in public buildings in Mexico.
Keywords: energy savings; air conditioner; electric consumption; public buildings.
Resumen
El consumo eléctrico en edificios públicos en la ciudad de La Paz al noroeste de México está considerablemente orientado por el uso de aires acondicionados (AC). Se encontró que el impacto de los AC en los recibos eléctricos representa alrededor de un tercio del gasto total anual. Nuevas leyes y acuerdos internacionales indican que deben aplicarse reducciones drásticas en los recibos eléctricos de edificios públicos. Una revisión general de mejores prácticas revela que implantar medidas eficientes de energía puede ser económicamente viable. Un análisis de los recibos eléctricos muestra cuales dispositivos eléctricos pueden representar grandes ahorros en consumos eléctricos independientes a las condiciones meteorológicas. Se exploran escenarios básicos de ahorro para mejorar la eficiencia energética en equipos de oficina y laboratorio, así como en iluminación. Los resultados indican la necesidad de medir y monitorear, como parte de una campaña formal y a largo plazo de ahorro de energía en edificios públicos en México.
Palabras clave: Ahorro de energía; aire acondicionado; consumo eléctrico; edificios públicos.
Introduction
The need to save electricity in public buildings in Mexico is established in a recent law [1, 2], whereby each of the managers of the many thousands of public buildings in the country is required to produce an energy savings program. This is part of a national effort to procure integral energy planning, in response to international interest to reduce impacts that affect weather change [3]. There are obvious areas in which electricity is heavily spent, such as air conditioning (AC), but little is known, and almost nothing is measured, to identify possible electricity savings.
In the present research, the electrical expenditure in a public building is analyzed. The building is the physical infrastructure of the Biological Research Centre in the northwest of Mexico, outside the city of La Paz, in Southern Baja California.
The total built area under study is 20,387 m2 (Figure 1), including offices, research labs and common areas, which is used by a total of 617 persons in average, including researchers, technicians, administrative assistants, students and visitors. The entire research center is sprawled over a total of 31,522 m2, if the 49 buildings and external areas are added together. In the figure, the lower part represents schematically the distribution of the buildings that can be appreciated in the photograph on the top.
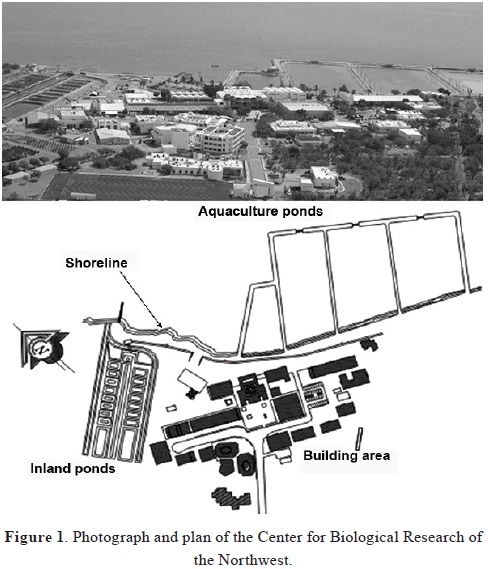
The dark shaded areas correspond to those where air conditioners are available. The total electric energy consumed is 147 kWh/m2. This consumption compares favorably with international standards: 340 kWh/m2 each year in semi-tropical weather according to one source [4]. The same indicator is quoted as 285.4 in USA and 269.4 in Canada. The analyzed research center does not use electrical ventilation devices, which would require about 30% of the total electrical load according with the American energy standard.
Some of these buildings (about 7,324 m2) house only biological laboratory installations, which are equipped with relatively poor lighting, which requires a specific energy supply estimated at 11.37 W/m2. However, these buildings are not conceived with a solar-illumination architecture, hence artificial lighting is employed an average of about 10 hours daily. Over half of these installations house living organisms which need attention and are subject to observations, which are usually done mainly by technicians and students, on a daily basis.
The rest of the installations employ slightly better illumination standards, which are calculated to require an average of 16.05 W/m2. Here is where most researchers and students spend most of the time, and these areas include cubicles, meeting rooms, classrooms, libraries and non-biology labs. We have a total staff of approximately 646 individuals, of which 113 are senior or junior researchers, 120 are assistants and technicians of diverse capacities, a total of about 300 persons integrate the administrative body, and there are 113 active students on average in a typical day. There are also some 23 visitors on average, which can use existing installations and office equipment, although occasionally they carry their own portable computers. Finally, there is a staff of 47 assistants for the up keeping and maintenance of the inside and exterior areas.
However, a preliminary inspection of monthly electricity bills reveals a certain weather dependence of electrical consumption. As shown in Figure 2, ambient dry bulb temperature, as registered in our own meteorological station, varies between a monthly average of 20°C in winter and 30°C in summer, and there is a very good agreement between ambient temperature variation and electrical consumption, which varies between 5.4 and 11 MWh/d, a variation almost entirely associated with AC equipment. The daily consumption in excess of 5.4 MWh/d is seen to consist of AC loads. On the other hand, the base load of 5.4 MWh/d results from laboratory equipment and office inner loads apart from AC loads. These inner loads are due basically to electrical illumination and electronic office equipment.
The plot in Figure 2 does not allow a segregation of electrical uses, and there are some electrical loads that prevail all year long, as in refrigerators and incubators, among other electrical equipment. However, the apparent correlation between ambient temperature and electrical bill can be further explored. Figure 3 shows the same values considering the daily electrical consumption as a function of mean ambient temperature. The agreement is quite good, even if in the summer months May-October (there are four-week holidays, two in July and two in August, but there is no rigorous control of people assistance in the center) shows a marked variation. The fraction of electricity load that is evidently related to ambient temperature is about one third of the total bill, which again is consistent with other work [5, 6, 7].
This AC electrical bill, about one third of the total electrical expenditure, is therefore a great target for energy savings and an electricity bill reduction. In this paper, some preliminary measurements indicate which rapid measures can be taken to reduce a measurable amount of electricity expenditure. These measurements also reveal the impact that other decisions might make in the near future, when dealing with the more complex features of heat generation and transmission within the buildings. Finally, some extrapolation allows for understanding basic measures that should be taken in the future to reduce further AC loads, which include a more detailed system of measurements in order to optimize electrical loads, since measurement quality determines the velocity of successfully advancing toward energy savings [8]. The intense solar irradiance available on site also suggests the convenience of solar-assisted AC measurements [9].
Previous work by others
The subject of AC electricity savings has been very much researched by some specialists who have also to deal with high electricity bills during a particular season of the year. This research has often been done with a view to also save electricity devoted to interior lighting [10]. Very often, the work has dealt with specific building types and applications, but produces important information for others [11]. Many have already offered a procedure, or decision making system, for gradually reducing AC electricity bills [12]. Proper procedures depend on many factors, including weather, costs of electricity, value of avoided GHG emissions, opportunity for introducing renewable (distributed) energy sources and the value of work developed in the building under study, as well as habits of the occupants. Important distinction must be made among already operating buildings, subject to several strategies for retrofitting, and new buildings in the design stage, where building materials, orientation and green building practices are a viable choice. In the particular situation of a building serviced by central AC, there are also several interesting strategies resulting from heat recovery, efficient controls and distance or remote automatic control, which involves continuous software development and adaptation, and promotes the sectioning of buildings for the purpose of air conditioning. It is also related to the new automated concept of Smart Grids [13]. In a separate work, Meyers et al [14] have evaluated the great savings potential of several emerging control technologies. Kusiak and Tang [15] have developed advanced optimization techniques to reduce electrical HVAC to a minimum, based on some measured values, which reinforces the notion that measurements have to be carefully performed if energy savings are procured.
Both situations are best analyzed with the aid of a properly validated computer program that helps the designer in understanding effects and costs of the myriad alternatives available. The options of programs and simulation or calculation procedures are very rich since this subject has been researched for many years [16]. Some very mature codes are continuously perfected and adapted to modern requirements [17, 18]. There is a very wide body of relevant research available that covers many aspects of energy savings and electricity reduction in AC systems [19].
AC Experimental results
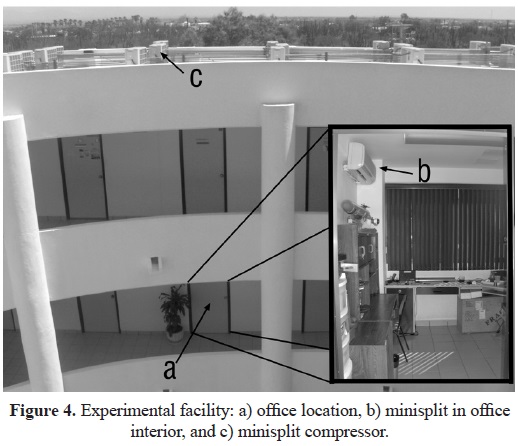
The work reported in the present paper results from detailed temperature and energy usage by a typical AC individual system in La Paz, Baja California Sur, in July 2010. Although other measurements were also performed, the ones herein reported are deemed to represent very properly the phenomena under analysis. A data set is chosen for days 18, 19, 21, 22, 25 and 26th July 2010. During that period, a typical office was monitored at CIBNOR research center in La Paz, BCS, while keeping the monitored office and contiguous offices without people and at constant temperature of 25 ± 0.7°C. Hence, sources of heat were only related to weather, not to lighting or equipment, nor humans. Apart from contiguous offices, the square office under scrutiny has a roof and two walls that are equipped with some thermal insulation, a door and a single pane window. The floor is the top of another office, also kept at constant temperature, which means that little thermal flow will take place there. The experimental facility is shown in Figure 4. Notice that the compressor and other parts of the mini split AC cooler sit on top of the roof, directly exposed to ambient.
It could be observed on 18th and 19th July that clouds were absent all the time and hence solar heat was maximum (Figure 5). On the next test days, 21 and 22, the AC system was protected from direct solar radiation by means of a total shadow that nevertheless allowed ambient air to flow freely around. Finally, on days 25 and 26 the artificial shadow was removed, so that the effect of shadowing the AC machine can be revealed directly, as will be discussed later. The outside temperature varied along the experiment as shown in Figure 6.
It can be noticed that solar radiation is very much direct, and there were almost no clouds or atmospheric moisture to alter the basic solar irradiation pattern. The corresponding ambient temperature is a consequence of solar heat. Ambient temperature for the test period as measured by a sensor stuck to the AC machine (Figure 7). Notice that while under shadow, on days 21 and 22, July, the recorded temperature didn't exceed 39°C, while on previous and successive days this temperature was between 50 and 55°C.
It is interesting to identify the rate of electricity requirement for the AC system as ambient temperature varies. This effect is represented in Figure 8. It is clearly seen that electricity requirements and ambient temperature are very well correlated. The electricity requirement curve for both 21 and 22, which were under a shadow, are consistently lower than the rest. Certainly, energy requirements in days 25 and 26 are also reduced, since cloud cover didn't allow much direct sunshine onto the compressors and ambient temperature was also lower. It must be noticed that the cooling machine was not sitting directly on top of the office under analysis, so the shadow on the AC system didn't affect the solar gains of the office.
Non-weather dependent electrical loads
When the average illumination load is calculated, it yields a total of 473 kW. If a typical day requires lighting to be turned on (there are no automatic switches) about 10 hours in the labs and 8 in the rest of the buildings, the daily mean consumption results in about 3.9 MWh/d.
Office equipment
The center has a total of 650 PCs, but the energy requirements and the number of hours they operate vary wildly. Some of them are equipped with scanning devices and printers, and some printers are quite energy intensive, and are used often. An average hourly estimate was produced and the office equipment was classified in two large groups. As a result, 600 PCs were assigned a typical energy requirement of 128 W and the remaining 50, a power need of 60 W in average. Total power adds up to 79 kW and, when operating slightly over 10 hours a day then the daily consumption is 798 kWh/d, the total energy used is rounded to 1.1 MWh/d including the peripheral equipment consumption which is about 300 kWh/d.
Laboratory equipment
Laboratory equipment is very variable in energy demands, and some of the most energy intensive equipment is employed only seldom. The largest pieces of equipment were reviewed individually and the main users were consulted as to their use. A final validation was reached when the power capacity installed in each lab was reviewed, and the electricians in charge were consulted. For the sake of the present study, a final overall average figure for lab equipment was set at 0.4 MWh/d. There is little confidence in this figure, but the main components of it were checked for consistency, both within the groups of equipment users and in terms of the overall electric billing, and the figure was finally adopted, since it represents a small chunk of the total energy expenditure, as Figure 9 illustrates:
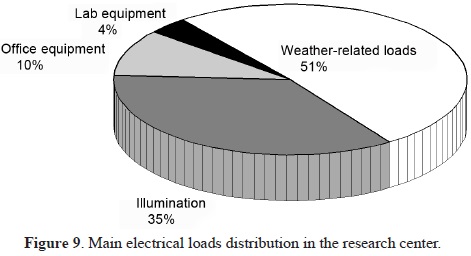
These overall figures agree well with Figure 2. In the coldest months of the year, when air conditioning is used only sparsely and mostly for ventilation, total energy expenditure is 5.4 MWh/d. But as months go by, and the weather gets warmer, AC equipment is employed to reach a consumption peak of 11 MWh/d. Clearly, the illumination load is the single most important load on a yearly basis, but the AC load establishes the overall electrical capacity of the whole system.
Heat transfer implications
Some of the most relevant findings related to future heat transfer strategies can be illustrated with the information gathered. In Figure 10, a plot is presented of a ty pical sunny day (18th July 2010). As opposed to Figure. 8, this time electrical energy consumption is plotted on an hourly basis versus ambient temperature. As expected, the curve that rises from left to right, from midnight to noon, as temperature increases, follows a lower path than the "returning" curve that describes electrical requirements from the time of sunset to midnight. This hysteresis effect relates both to several complex heat transfer phenomena that take place between the building and its surroundings, and within the building itself, and has been studied previously by the same Mexican group [20]. The same hysteresis effect was observed in all measured days.
It can be seen that the hysteresis encountered and depicted in Figure 10 can be employed to characterize the main heat transfer and thermal inertia parameters that belong to this particular building. The experimental registries are thus very relevant in the quest for representing and validating simulation models. In fact, the data discussed reveals that the building is too light and very inappropriate to fully take advantage of night cooling through natural circulation [21], a characteristic which is desirable in buildings in the semiarid weather of Northwestern Mexico.
Conclusions and recommendations
The main conclusions that can be derived from the reported experiments are:
1. The shadowing of the AC mechanisms indeed represents a measurable reduction in electrical consumption. This reduction can be associated to several factors, such as allowing for an operation more suitable to the machine specifications, and to thermodynamic consequences in the working fluid, for example. However, there is a measurable and benefic effect of putting those equipments under shadow.
2. Peak year-long electrical requirements are associated to weather and ambient temperature, more clearly so in the very sunny days of midsummer. It seems clear that the buildings' architecture strategy is not well suited to reduce electrical requirements for AC [22].
3. The buildings are also weak in its future capacities to employ natural cooling strategies, such as night ventilation. This issue can be addressed in many ways, such as artificially increasing the thermal mass.
The corresponding recommendations can be enumerated as follows:
1. Measuring specific electrical demands leads to a clearer understanding of the underlying phenomena and possible measures to be taken in order to reduce electrical consumption. The first one detected, which consists in placing of the AC machines under shadow, leads to a mínimum saving of about 5%, but can mean as much as 15% in sunny days. This is a large saving coming from a very minute effort. Surely there will be further savings, by shadowing windows, for example, that can be made evident by measuring further in the future.
2. The results reveal that the buildings are light (little thermal mass) and relatively no insulated. The fact that the windows employ a single pane reveals that the design project didn't account for extreme summer sunny days. A mathematical model will be devised and run with the view to validate it with the existing experimental evidence, and then to explore which insulation or glazing strategy is best and cheapest. However, this exercise should be preceded by more detailed measurements.
3. Many of the most promising measures to take are associated with point measurement and control, which leads to smart grids, distributed or isolated generation, solar cells, and ventilation and illumination controls. Much of this effort will require the devise and adaptation of electrical and electronic equipment to ambient comfort, which will largely benefit Mexican architecture.
4. These procedures should go in parallel with lighting savings, which should arise from a clever combination of lamp substitution, automatic controlling and remote management. The use of further electronic ballasts which are programmed to make best use of natural light, and are operated jointly by presence detectors, should induce continuous savings, gradually coupled with the use of PV systems to supply local loads, both in illumination and in some office equipment.
5. These results should be widely reported and discussed, in order to strengthen the local culture of energy efficiency and advanced technology, to be employed not only in research establishments but also in many other public buildings, as the law foresees.
References
[1] Sener, Protocol of activities for the implementation of actions for energy efficiency in buildings, vehicle fleets and installations of the Federal Public Administration (in Spanish), Mexico, published in the Federation Official Gazette 2009, 30 January, 14 pages. [ Links ]
[2] Sener, Bylaws for the sustainable use of energy (in Spanish), Mexico, published in the Federation Official Gazette 2009, 11 September, 6 pages. [ Links ]
[3] W. W. Clark, L. Eisenberg, Agile sustainable communities: On-site renewable energy generation. Util Policy 2008; 16: 262-274. [ Links ]
[4] DOE/EERE, Buildings Energy Data Book; DOE, USA: 2007. [ Links ]
[5] W. L. Lee, F. W. H. Yik, P. Jones, A strategy for prioritising interactive measures for enhancing energy efficiency of air-conditioned buildings. Energy 2003; 28: 877-893. [ Links ]
[6] K. Wangpattarapong, S. Maneewan, N. Ketjoy, W. Rakwichian, The impacts of climatic and economic factors on residential electricity consumption of Bangkok Metropolis. Energ Buildings 2008; 40: 1419-1425. [ Links ]
[7] A. T. Chan, V. C. H. Yeung, Implementing building energy codes in Hong Kong: energy savings, environmental impacts and cost Energ Buildings 2005; 37:631-642. [ Links ]
[8] T. Ueno, R. Inada, O. Saeki, K. Tsuji, Effectiveness of an energy-consumption information system for residential buildings. Appl Energ 2006; 83: 868-883. [ Links ]
[9] C. A. Balaras, G. Grossman, H. M. Henning, A. Carlos, C. A. Infante-Ferreira, E. Podesser, L. Wang, E. Wiemken, Solar air conditioning in Europe—an overview, Renew Sust Energ Rev 2007; 11:299-314. [ Links ]
[10] J. C. Lam, Energy analysis of commercial buildings in subtropical climates. Build Environ 2000; 35: 19-26. [ Links ]
[11] G. Bizzarri, On energy requirements and potential energy savings in Italian hospital buildings. 4th International Conference on Urban Regeneration and Sustainability, WIT Trans Ecol Envir 2006; 93: 419-431. [ Links ]
[12] O. M. Al-Rabghi, M. M. Akyurt, A survey of energy efficient strategies for effective air conditioning. Energ Convers Manage 2004; 45: 1643-1654. [ Links ]
[13] P. Crossley, A. Beviz , Smart energy systems: Transitioning renewables onto the grid. Renewable Energy Focus 2010; 11 (5):54-59. [ Links ]
[14] R. J. Meyers, E. D. Williams, H. S. Matthews, Scoping the potential of monitoring and control technologies to reduce energy use in homes, Energ Buildings 2010; 42: 563-569. [ Links ]
[15] A. Kusiak, M. Li, F. Tang, Modeling and optimization of HVAC energy consumption, Appl Energ 2010; 87: 3092-3102. [ Links ]
[16] W. F. Stoecker, Proposed procedures for simulating the performance of the components and systems for energy calculations. second ed., ASHRAE Pub 1971. [ Links ]
[17] D. C. Hittle, Building loads analysis and systems thermodynamics (BLAST). User Manual. Technical Report E-153, US Army Construction Engineering Laboratory, Champaign, Ill. USA 1979. See also updates in http://apps1.eere.energy.gov/buildings/energyplus/ [ Links ]
[18] L. Perez-Lombard, J. Ortiz, C. Pout, A review on buildings energy consumption information. Energ Buildings 2008; 40: 394-398. [ Links ]
[19] J. S. Haberl, C. H. Culp, Review of methods for measuring and verifying savings from energy conservation retrofits to existing buildings. Technical Report ESL TR-03/09-01. Energy Systems Laboratory, Texas Engineering Experiment Station, Texas A & M University System 2003; 61 pp. [ Links ]
[20] M. A. Porta, J. L. Fernandez, Experimental evaluation of thermal inertia effects in diffusion-type solar stills. Int Symp on Heat and Mass Transfer in Energy Systems and Environmental Effects, Cancún, Mexico 1993;179-184. [ Links ]
[21] J. L. Fernandez, M. A. Porta-Gandara, N. Chargoy, Rapid on-site evaluation of thermal comfort through heat capacity in buildings. Energ Buildings 2005; 37:1205-1211. [ Links ]
[22] I. Ahmad, Performance of antisolar insulated roof system. Renew Energy 2010; 35: 36-41. [ Links ]

