


Servicios Personalizados
Revista
Articulo
 Inglés (pdf)
 Artículo en XML
 Referencias del artículo
 Enviar artículo por email
Indicadores
-
 Citado por SciELO
 -
 Accesos
Links relacionados
-
 Similares en
SciELO
Similares en
SciELO
Compartir

 Permalink
Ingeniería mecánica, tecnología y desarrollo
versión impresa ISSN 1665-7381
Ingenier. mecáni. tecnolog. desarroll vol.3 no.2 México mar. 2009
Artículos
Full Vehicle Instrumentation for Dynamic Analysis
Liborio Bortoni-Anzures, Juan C. Cruz-Victoria, Hiram Herrera-Rivas, D. I. González-Sánchez, David Díaz-Romero & Isac Huixtlaca-Cuautecatl
Universidad Politécnica de Victoria
Fecha de recepción: 01-02-08
Fecha de aceptación: 15-03-09
Abstract
This paper presents the arrangement of a minimum set of components to track the vehicular dynamical behavior of a truck or an articulated vehicle, by using interpolated-GPS signals, vehicle CAN network, and MEMS inclinometers and accelerometers attached to a single on-board computer to evaluate vehicle maneuverability and performance.
Keywords: Vehicle dynamics, field test, multi–system instrumentation, maneuverability evaluation.
Resumen
Se presenta un arreglo con un mínimo de componentes para registro del comportamiento dinámico de un camión o semirremolque utilizando un interpolador de registros de GPS, la información del la Red CAN del vehículo e inclinómetros y acelerómetros MEMS conectados a una laptop con el propósito de evaluar la maniobrabilidad y confort del vehículo.
Palabras clave: Dinámica vehicular, pruebas de campo, instrumentación multiplataforma, evaluación de maniobras.
Introduction
Any moving object produces a force, as stated by newton's law, a force vector (f) results of combining an acceleration vector (a) and the body's mass (m).

This is a simple principle that can reach an important level of complexity when a mechanism is analyzed. Several masses, different accelerations, friction, inertia, mass interaction or even temperature variation results in a complex dynamical-forces system.
We can use these principles to model any motorized vehicle applying additional considerations, such as the effects of the interaction between the vehicle and the road, the ability of the vehicle to operate under different load conditions, the number of passengers or cargo. Several studies have been conducted for every part and every system of any commercial vehicle.
Dynamical studies on full vehicles are usually conducted to analyze safety, comfort or handling performance. Each objective requires specifi c instrument distribution.
Analisis Objective
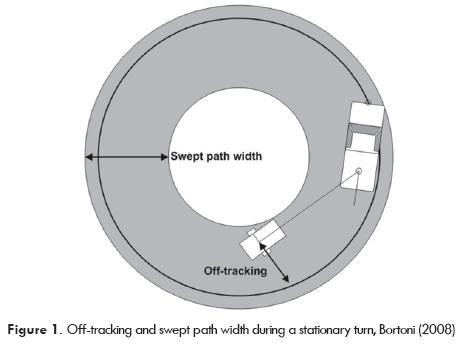
Handling performance - it is the result of a vehicle's steering inputs determined by the vehicle's weight, dimensions, tire's mechanical properties, suspension, vehicle's frames, and weight distribution among the axles, Bortoni (2008). Consequently, a number of performance measurements can be compiled to assess the maneuverability performance of vehicles. The most widely used performance measurements related to geometrical requirements are: Off-tracking - Whenever a vehicle with more than one axle turns, rear wheels fail to follow the exact path of front wheels. Off tracking measures the maximum distance between the paths of the steering axle and the axle of the most rearward wheels, Jujnovich (2002).
Swept path width - Jujnovich (2002) also describes the "swept path width" as the maximum width of the swept trajectory radius turn. Figure 1 shows both, the off-tracking and swept path width measurements during circular constant radius turns, also called a stationary turn.
VEHICLE CONFIGURATION
The physical characteristics of the vehicle determine its dynamical behavior. The most widely recognized key factors are:
Balancing the sprung mass
Strain caused by the lateral force
Strain caused by longitudinal forces
Strain caused by the auto-alignment pairs
Strain caused by the dynamic vertical loads
Wheel alignment and convergence
Par-balance and its distribution per axle
Longitudinal efforts
Self-alienating pairs
Distribution in the axes of the sprung mass
Distribution in the axes of the not suspended mass
Position the center of gravity
Distance between axles
Center of balance
Distribution of the balance pairs
Steering stiffness
Drift stiffness
Structural rigidity
Properties of the self-alignment pair
Aerodynamic Characteristics
5th wheel location
Also equally relevant are the payload and the state of the transported material because their dynamic response affects the vehicle and consequently the number of trailers towed. There are a number of important special vehicles, but most long articulated cargo vehicles can be classifi ed as:
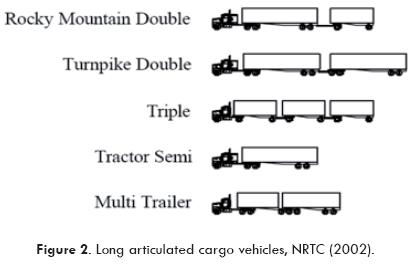
All of this vehicles share a number of important similarities, but they have specific characteristics that are refl ected in its dynamics.
Regarding comfort, the main difference between a passenger car and a heavy duty truck is that the driver's seat of the heavy duty truck is usually supported by a passive suspension assembly, responsible for isolating vibrations from the cabin fl oor. While a passenger cars are designed to provide full cabin comfort.
To identify the infl uence of a specifi c component in the overall vehicle's dynamical response, is a complex task that requires special sensor confi gurations in order to measure its interactions.
Because this paper focuses on maneuverability, the results are limited to full body effects on handling performance.
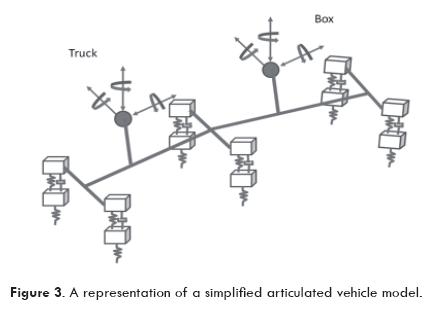
VEHICLE MODEL
Modeling a vehicle is not simple, there is an enormous amount of considerations to review, but basically the purpose of the model is the primary factor.
Vehicle dynamical behavior - In the area of dynamical analysis, an useful tool is the BOND-GRAPHS technique. Bond graphs are a domain-independent graphical description of the dynamical behavior of a physical system.
It is a tool for modeling engineering systems, it is especially useful when different physical domains are involved and is based on energy and energy exchange among elements of the system. There exist six different elementary concepts: storage of energy, dissipation, transduction to other domains, distribution, transport and input or output of energy, Broenink (1999).
To generate a bond-graph model, the fi rst concern is the domains and elements identifi cation, afterwards the connection structure description, and fi nally the interconnection of ports among elements.
The procedure for assigning causality on a bond graph begins with those elements that have the strongest causality constraint, namely fi xed causality. Via the bonds in the graph, one causality assignment can cause other causalities to be assigned. This effect is called causality propagation. A causal bond graph contains all information relevant to deriving the set of state equations. The mixed differential and algebraic equations are the constitutive relations of all elements in causal form, Broenink (1999).
The resulting set of equations of a bond-graph model is called the simulation model. It consists of first-order ordinary differential equations (ODEs), possibly extended with algebraic constraint equations (DAEs), and is simulated by using integration methods.
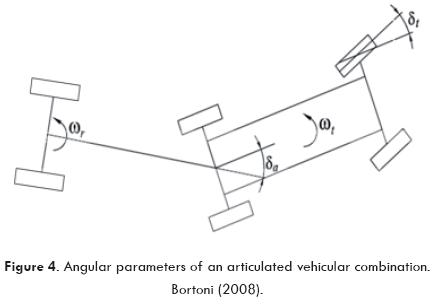
Steering model - Lateral dynamics are defi ned by the response of the steering system to the operator's actions and the effects of external forces acting on the vehicle as result of the wind or road conditions, Bosch (1991).
At lower speeds, the trajectory is defi ned by the wheels orientation as function of the position of the steering wheel. The steering system geometry should allow a minimum slip during the turn between the tire and the fl oor so that the tires rotate around a common instantaneous center of rotation. A curved trajectory transitory deviation of rolling is presented until the vehicle reaches its stationary state where all the axes of the vehicle align to their rotation centers.
VEHICLE INSTRUMENTATION
The instrumentation is the knowledge of the correct application of sensors aimed to support the user in the measurement, regulation, observation, and transformation of a set of variables used in a productive process. A great variety of instruments exists for these processes and can be classifi ed as: mechanical, electronic, optical or chemical.
An Integrated Circuit for Specifi c Applications (ASIC) is the electronic circuits applied in monitoring and controlling the information that comes from a physical variable. There is a wide range of ASIC devices, including the Micro-Electro-Mechanical Systems (MEMS) that solve most of dynamic sensor problems, with less signal noise, and are of a smaller size.
The advantage of MEMS, is that it can be designed for specifi c applications, or for real-time analysis, using a USB interface which simplify setting up. They also have very low power requirements, thus permitting their use in mobile devices.
Along the ASIC-MEMS are tilt/inclination and acceleration sensors. These devices have internal microscopic masses which are accelerated. This movement produces voltage.
A 3d tilt sensor combined with 3d acceleration can substitute a gyroscope, providing a Cartesian or spherical coordinated system within the ranges of 0-360° with a resolution of 0.043° (0-2π rad with 0.00075 rad resolution) and at accelerations of between 0 to 177 m/s2 at a resolution of 0.0074 m/s2, Toradex (2008).
Global positioning system - Originally designed for military purposes, Global Positioning System (GPS) technology is a navigation system based on two dozen satellites that orbit the earth twice a day at an altitude of 19,000 statute kilometers. The GPS unit receives a combination of three or more satellite-transmitted waves to triangulate a position on earth consisting of latitude, longitude and altitude on a geocentric coordinate system, such as the world geodetic system 1984 or WGS84, Nima(2000).
Once the user's position has been determined, the GPS unit can calculate other information such as speed, bearing, track and trip distance, facilitating the record the specifi c vehicle's trajectory.
Commercial GPS receivers usually work at sample ratios of two track point per second. This is enough information for a wide set of applications, but for tracking a high speed vehicle it is necessary to employ a higher rate of data input.
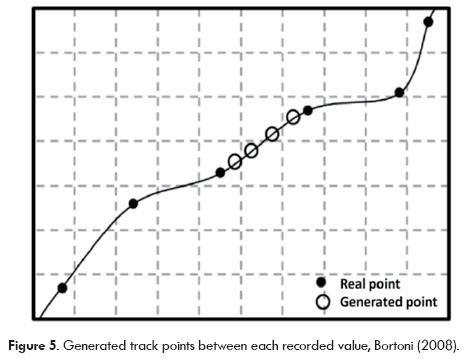
To overcome this limitation it was necessary to develop an interpolation program. In this case the interpolation algorithm of LaGrange was selected, achieving a sample rate of 10 Hz.
The method consists of passing the N latitude and longitude values to a N-1 order polynomial. The general form of the equation in the x axis is:
Where
A similar equation is used to calculate the corresponding y values.
Additionally it is necessary to calculate the proportional time stamp for each generated point in order to not lose synchronization. By using this method it is possible to rise the readings per second to 10. Figure 5 illustrate an example of 6 original values used to generate four new track points.
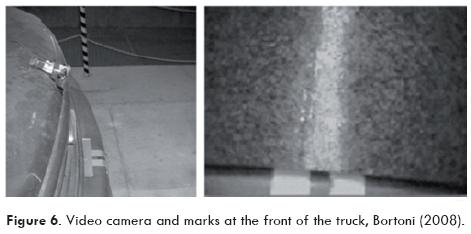
Video guide — An easy way to ensure repeatability of the maneuver is tracing it on the road and following it using a video camera installed on the front of the vehicle. Figure 6 shows a webcam located on a pickup truck and the camera vision.
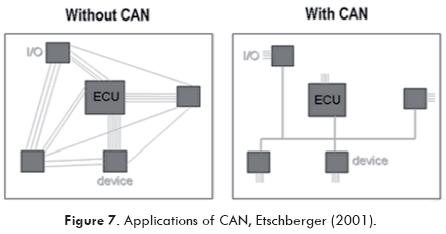
CAN Network - In automotive electronics, engine control units, sensors, anti-skid-systems, are connected using CAN bit rates of up to 1 Mbit/s. It is a durable and economic network that allows several devices to communicate and allows the ECUs to have a single interface CAN instead of different analogical and digital entrances for each device in the system, Etschber-ger (2001).
Depending on the car model and manufacturer, the CAN Network could be useful for data acquisition for the parameters of braking systems, including anti-lock braking systems (ABS), gear equipment, systems for steering, suspension and tires. This data combined can be used to take advantage of the vehicle sensors to incorporate more complete information regarding the vehicle dynamics in relation with vehicle operation events.
SIGNAL PROCESSING
The use of frequency and time analysis techniques can assist obtaining a wider vision of a vehicle design and performance.
Frequency analysis for example, is often used to characterize several components responses to a relevant frequency spectrum, for example road conditions for a suspension system, motor vibration, etc. Depending on component response, it is possible to adjust its behavior. These adjustments are made in order to enhance a desired characteristic or to coordinate the single component to a network of interrelated components.
There is a serious problem when quantity and interaction is being studied. Automotive systems are characterized by a huge quantity of small systems that interact and affect the vehicle's performance.
All of the sub-systems interact in a semi-independent manner, therefore, a proper coupling should be found that does not impede its operation or affect the operation of other sub-systems. How can one be assured that all of the systems act in a common way?
A good design should take into account all of the possible operative states among components, and adjust them in order to facilitate the complete system's performance.
Frequency analysis is generally applied to mechanical systems although it is not the only system that can be studied in this manner. A classical example is the suspension system where different frequencies may be experienced by the passenger and/or structure. Consequently obtaining information that can be used to achieve an optimal design between mechanical performance and passenger comfort is a must.
On the other hand, time analysis techniques can be applied to gather information that frequency analysis are unable to obtain. Time analysis techniques can offer an insight view of the system.
The main difference between time and frequency analysis is the way the systems are viewed. In frequency analysis the response of the system to a well known input can be studied with the system remaining as a "black box".
In modern time-analysis methods, otherwise known as state-space analysis, the system is modeled as a whole, i.e. all of its parts are considered when creating a mathematical representation of the system or sub-system, so, instead of working with a "black box" researchers would be working with ticking parts possessing a more defi ned individual behavior.
In this way, it can be ascertained what happens inside the system to the extent of and by utilizing innovative mathematical calculations, knowing the state to understand variables that would otherwise be impossible to comprehend, all of which can affect and be affected by the system's inputs from operators and the current surroundings.
All of this information can be used to design, analyze and control the whole system's performance.
The last topic is quite interesting and useful, it is possible to design controllers that use the information given by the system, in a way that, as in the example of the suspension system, we can fi rst design the whole structure and main desired behavior of the system, and then design a subsystem that rejects the vibrations to the passenger, to improve comfort.
It can be said that time and frequency analysis techniques are complementary, and that by using them together it is possible to obtain more robust and secure automotive systems.
SIMULATION
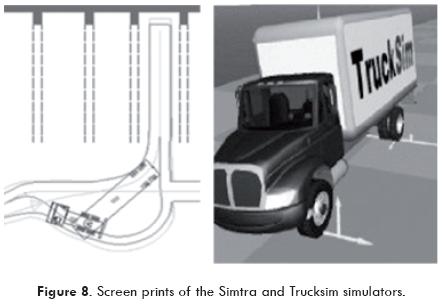
There is an important number of truck simulators for specific tasks. These simulators represent excellent means to reduce development costs and time. Several institutions worldwide have been working to characterize vehicle dynamics for decades.
The Yaw/Roll Model was developed at the University of Michigan Transportation Research Institute (UMTRI) with the purpose of predicting the directional and roll response of single and multiple articulated vehicles engaged in steering maneuvers of rigid, heavy vehicles with up to 11 axles.
UMTRI Phase 4 model has 71 degrees of freedom time-domain mathematical simulation for straight trucks, tractor-semitrailers, doubles, and triples. It is a computer model for simulating the braking and steering dynamics of commercial vehicles.
Trucksim — is a software tool for simulating and analyzing the dynamic behavior of medium to heavy trucks, buses and articulated vehicles. Trucksim uses detailed nonlinear tire models, nonlinear spring models, and includes the major kinematics and compliance effects in the suspension and steering systems of trucks, buses, and other large highway vehicles with solid-axle suspensions and asymmetric steering system.
SIMTRA. Path Planner R4 - Is as CAD based program to help assess layout and space requirements for intersections, roundabouts, bus terminals, parking facilities and loading bays.
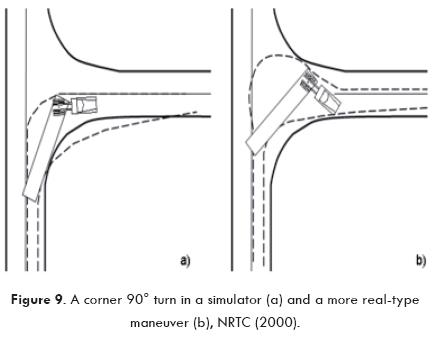
The importance of simulation results are invaluable, but it is also important to consider live maneuvers, basically because in a physical sense the driver can fi nd diffi cult to follow a precise path as a simulator does. It is also important to keep in mind that the vehicle maneuvers made by the simulator can be different from the necessary in a real life situation.
Because of the obstacles presented in real life situations are diffi cult to represent in mathematical simulation software, they are sometimes not exactly the same as the problems encountered by operators. Still, the information gathered from such tests could prove very useful even when comparing the relevant skills of various drivers.
Figure 9 presents a hypothetical situation were driver skills are the primary issue determining the maneuver performance which may be different from simulator results.
A station wagon was instrumented, with the sensors located as near as possible to the center of balance of the vehicle, next to the driver seat, recording sensors activity log on a mini notebook computer during an up-hill route. The instrumented vehicle is shown in figure 10.
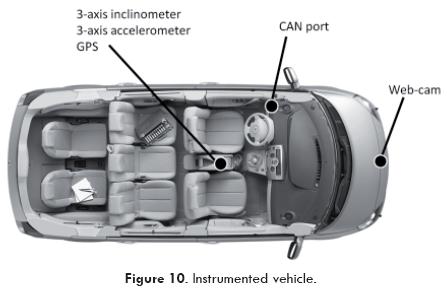
Figure 11 is the graphical representation of different radius turns, braking, and the road altitude over the sea level, as the up-hill route is perceived from the GPS System.
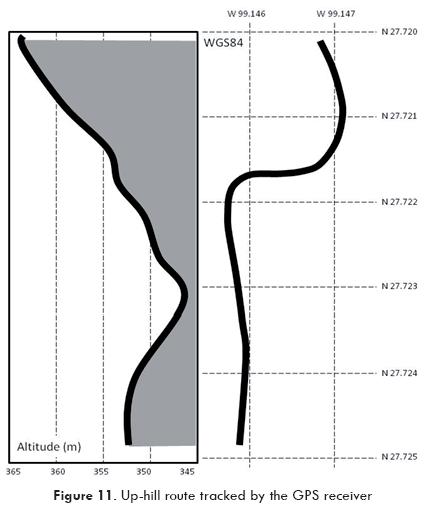
Depending on specific needs, a more detailed area map could be constructed from the GPS system, or even perform a pretest road scanning, permitting a better understanding of the specific vibrations resulting from the road-vehicle interaction. This test, has been obtained from the CAN network the engine's RPMs and the speed on the left front wheel, displayed as vehicular speed in figure 12. Also in the same fi gure are the readings on yaw angle, pitch angle and vertical an lateral acceleration. Readings are from the MEM-USB sensors installed inside the cabin of the vehicle.
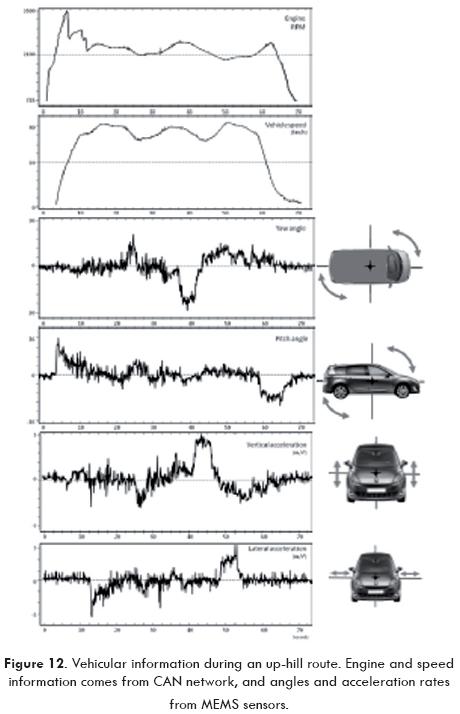
Referencing the dynamic results to the vehicle driving events is helpful in order to understand their relation, for research, educational purposes or to develop new active safety systems.
As was mention before, the driver has problems to follow an exact path or to maintain an specifi c vehicular speed, some of the pitch angles are result of the driving style, more than from road-vehicle interaction. Also regarding yaw angle, the driver evaluate the curve visually and adjust the steering wheel to deal with it, but usually because of the speed, inertia or centrifuge forces, the driver perception change and adjustments has to being made.
DISCUSSION
Prestigious institutions have created a legacy of knowledge; build on results from decades of research, experience, and expertise. However, vehicular engineering will continue to be a work-in-progress field, as long as new materials are developed, new design challenges arise, eco-friendly solutions or changes in the market's interests.
These are refl ected in the emergence of better, more intelligent, or even new technologies. Consequently, the models and simulators discussed herein will have to be continuously updated in order to meet new usage needs and regulation requirements.
There is already published results on vehicular maneuverability from computer simulators, and recently a few on real vehicle maneuvers, but by mixing maneuverability with dynamic studies and GPS and CAN systems could result a better understand of the vehicle behavior, discriminate human factors or provide more accurate results on vehicle's comfort.
At this time, some experiments are conducted to propose future measure parameters combination, and to develop a full vertical + lateral dynamic model.
REFERENCES
Bortoni L., D. Gomez, G. Herrera and M. Martinez. "Fuzzy-logic Controller for automatic forced-steering in semi-trailers". SAE paper 2008-01-2701. ISBN 978-0-7680-2092-2. USA. [ Links ]
Bortoni L., M. Fabela, R. Hernández, G. Herrera, M. Martínez. "Experimental study of the maneuverability of a testing trailer with a steering axle at low speed maneuvers". SAE paper 2008-01-2705. ISBN 978-0-7680-2092-2. USA. [ Links ]
Bosch R., GmbH, "CAN Specifi cation 2.0", Robert Bosch GmbH, 1991. [ Links ]
Broenink J. "Introduction to physical systems modelling with bond graphs" University of Twente, Dept EE, Control Laboratory. 1999. Netherlands. [ Links ]
Etschberger K., "Controller Area Network", IXXAT Press, We-ingarten, Germany, 2001 [ Links ]
Jujnovich B. and D. Cebon, "Comparative performance of semi-trailer steering systems", 7th International Symposium on Heavy Vehicle Weights and Dimensions. University of Cambridge, UK. 2002. [ Links ]
National Road Transport Commission (NRTC) "specifi cation of performance standards and performance of the heavy vehicle fl eet" Australia 2000. ISBN: 0-642-54461-1 [ Links ]
NIMA — National Imagery and Mapping Agency. (2000) 'World geodetic system 1984. Department of defense. NSN 7643-01-402-0347 [ Links ]
TORADEX Oak tilt and Oak G Datasheet. 2008. Switzerland. [ Links ]
Widas P. "Introduction to fi nite element analysis" Virginia Tech Material Science and Engineering. 1997. USA. [ Links ]

