


Services on Demand
Journal
Article
 English (pdf)
 Article in xml format
 Article references
 Send this article by e-mail
Indicators
-
 Cited by SciELO
 -
 Access statistics
Related links
-
 Similars in
SciELO
Similars in
SciELO
Share

 Permalink
Ingeniería mecánica, tecnología y desarrollo
Print version ISSN 1665-7381
Ingenier. mecáni. tecnolog. desarroll vol.3 n.1 México Sep. 2008
Artículos
Optimization of a 350 mW Oil-fired Boiler in Mexico for NOx and Particulate Matter Emissions Control
Carlos E. Romero1 , Nenad Sarunac1, Ricardo Moreno1, Zheng Yao1 and Harun Bilirgen1 Fernando Hernandez2, Guillermo Ronquillo2, Jose Luis Sanchez2 and Rodolfo Coria2 Antonio Hernandez3, Bonifacio Lara3 and Andrés Ordoñez3 Federico Gónzález4, José Luis Gómez4 and José Elías Montoya4 Keith R. Pulle5
1 Energy Research Center, Lehigh University Bethlehem, PA 18015, U.S.A. Correo electrónico: cerj@lehigh.edu.
2 Centro de Ingenieria y Desarrollo Industrial Queretaro, Qtro. 76130, Mexico.
3 Laboratorio de Pruebas de Equipos y Materiales, Comision Federal de Electricidad Irapuato, Gto. 36541, Mexico.
4 Complejo Termoeléctrico Presidente Adolfo López Mateos, Comision Federal de Electricidad Tuxpan, Ver. 92800, Mexico.
5 School of Engineering and Mathematical Sciences City University, EC1V 0HB, London, UK.
Fecha de recepción: 18-02-08
Fecha de aceptación: 25-04-08
Abstract
This project was done in an oil-fired 350 MW load-following unit with an opposed wall-fired boiler, steam-assisted atomized conventional burners and flue gas recirculation for steam temperature control. Combustion optimization was performed to improve unit performance while maintaining environmental compliance. A comprehensive combustion optimization program was carried out using a systematic approach that included: installation of a new continuous emissions monitoring system with a laser-based particulate matter monitor, combustion tuning of the burners to improve baseline performance, parametric field testing to create a database, data modeling using artificial neural networks, determination of optimal settings using a mathematical optimization algorithm, and development of an on-line advisory software. The real-time advisory software provides expert-system advice to the operators on the optimal boiler control settings for operation under area grid control. Operation with the advisory software allows better compliance with the environmental restrictions while maintaining optimal thermal performance of the unit. It also allows the operator to explore the impact of changes in operating parameters such as excess air, flue gas recirculation rate, fuel viscosity, fuel temperature, atomization pressure, and burner nozzle fouling on emissions and performance parameters.
Keywords: Combustion Optimization, Emissions Control, Power Plants.
Introducción
The unit is an opposed wall-fired 350 MW unit, with a balanced draft furnace and it is of the subcritical, single reheat design. The maximum continuous rating (MCR) steam flow output at 170 kg/cm2 and 538°C is 1,058 metric ton/hr. The firing system is composed of 24 conventional cell burners (12 per wall), with common secondary air registers per burner pairs. There is no individual control of the fuel flow to each particular burner. Fuel atomization is achieved with steam, with an expected atomizing viscosity at the nozzle in the range between 15 to 30 cSt. Main steam and hot reheat design temperatures are 538°C. Steam temperature control is achieved at the PALM Unit 1 with flue gas recirculation (FGR) and steam attemperation.
The unit fires Mexican and imported heavy fuel oil. The unit must comply with the Mexican regulation for stationary sources that utilize fossil fuels, which specifies for total suspended particles (TSP), nitrogen oxides (NOx) and sulfur dioxide (SO2) of 350 mg/Nm3, 375 ppmv and 2,200 ppmv, respectively, all at 5 percent reference oxygen (O2) level (NOM-085-SEMARNAT- 1994 [1]). The unit is operated on a particular load profile that involves operation in Area Grid Control (AGC) in a range from maximum load to approximately 340 MW. The rest of the load profile is defined at loads, in a boiler-follow mode, at 255 MW (75 percent load) and 175 MW (50 percent).
Combustion optimization of the unit was performed from March 2006 to March 2007. This project was jointly supported by the Mexican Federal Commission of Electricity (CFE for its acronym in Spanish) and the Mexican National Council of Science and Technology (CONACYT for its acronym in Spanish). The work was jointly performed by the Lehigh University Energy Research Center (ERC), the Center of Engineering and Industrial Development (CIDESI for its acronym in Spanish), the CFE's Laboratory of Tests for Equipment and Materials (LAPEM for its acronym in Spanish), and station engineers and Operations personnel.
Combustion optimization was performed using Boiler OP, an intelligent optimization software package developed by the ERC. Under the guidance from Boiler OP, parametric tests were performed over the operating load range of interest (full load to 50 percent load). The data obtained from the combustion optimization tests were used by Boiler OP to develop neural networks which provide functional relationships between emissions, performance and boiler control settings. These results were then used to determine combinations of boiler control settings which satisfy an optimization objective of maintaining a specified level of stack TSP and NO x emissions, subject to minimal impact on unit heat rate. In addition, an on-line advisory software, to provide advice to the operators on the optimal control settings, was developed and deployed at the Unit.
There is historical evidence that an optimized control of the combustion conditions of the unit would result in year round TSP emissions improvement. As an illustration, Figures 1 and 2 show TSP emissions on two different days, while the unit was on AGC at close to full load. No recommendations for the boiler control settings were given to the operators on both days. On the first day (Figure 1), the unit was operated at 305.9 ± 7.8 MW. The pertinent operating parameters on that day were set as follow: fuel temperature at 123.4°C, atomization pressure at 15.1 bar, fuel pressure at 20.5 bar, and the economizer excess O2 at 2.0 percent. In contrast, on the second day (Figure 2), the unit was operated at 303.6 ± 6.5 MW. The pertinent operating parameters on the second day, were set as follow: improved fuel temperature at 131.5°C, atomization pressure at 13.9 bar, fuel pressure at 18.6 bar (indicating the possibility of cleaned burner nozzles), and the economizer excess O2 at 1.7 percent. TSP emissions on the second day were lower than on the first day.


Boiler op Technical Approach
Combustion optimization of an oil-fired boiler is a complex process that requires in-depth knowledge of a boiler and the operation of its auxiliary systems, and factors affecting emissions and unit heat rate. Boiler OP is an intelligent software package designed to determine the optimal combination of boiler control settings resulting in minimum unit heat rate, subject to a target emissions level and other user-specified constraints. The ERC approach to combustion optimization relies on in-depth understanding of the underlying physics and significant experience in the operation of fossil fuel-fired boilers. The general approach used by the ERC for combustion optimization consists of the following seven steps. Since combustion optimization depends on data-based models describing the effect of boiler control settings on emissions and performance, issues related to creating a good database, and developing good correlation ANN models are very important in this approach.
RESULTS
Test Preparation and Combustion Tuning
As part of Step 1 of the Combustion Optimization Approach, a boiler inspection was performed at the Unit before a planned outage. During the outage, new burner tips and diffusers were installed on all burners in preparation for combustion optimization. Additionally, Zirconia oxide excess O2 probes were installed at the economizer outlet location together with infrared CO probes (one per duct) for flue gas monitoring.
As part of Step 2, combustion tuning was performed to balance the combustion stoichiometric conditions at the burners, and to identify burner out-of-service (O/S) patterns that will be advantageous for combustion optimization. This was accomplished using the secondary air registers that control the amount of secondary air that is introduced at each cell, and gas sampling at a 16-point sampling grid located at the economizer exit. Testing was accomplished at the three loads of interest, viz, full load, and 75 and 50 percent load. Some level of stratification in both CO and O2 concentrations was found at the economizer outlet at full load conditions (excess O2 in the range from 1.0 to 1.3 percent, and all burners in-service, I/S). Figure 3 shows results of flue gas mapping at baseline (as-found) conditions, indicating elevated CO emissions at the upper South corner of the B-duct and at the lower North corner of the A-duct. Following these baseline results, combustion cells were identified by following the flow streamlines from the burner front, along the convective pass, to the economizer exit (see Figure 4). Air-starved combustion areas were compensated by manipulation of the secondary air cell registers. The findings of this manipulation indicated that pushing more air toward the top burners and to the top and bottom of the measurement duct, resulted in increased windbox pressure and better combustion.

In addition to the tuning tests, a series of tests were performed at 50 and 75 percent load to find optimal burner configurations to be used with 2 cells O/S, or 75 percent load (255 MW), and with 4 cells out-of-service (O/S), or 50 percent load (175 MW). The 75 percent load testing was performed at approximately 264 MW, average plant economizer excess O2 of 2.55 percent, total oil flow of 61.9 m3/hr, fuel temperature of 131°C and atomization pressure of 15.05 bars. Five different combinations of cells O/S where tried. Figure 5 includes the results of the tested configurations in terms of their impact on TSP emissions. Configuration with the 4-A & 6-A Cell O/S resulted in the lowest TSP emissions and optimal steam temperatures.

This was also the configuration that produced the relatively lowest fuel pressure, which reduces the contribution from mechanical atomization, since the pressure differential between the fuel and the steam is minimized. The 50 percent load testing was performed at approximately 178 MW, average plant economizer excess O2 of 3.99 percent, total oil flow of 42.9 m3/hr, fuel temperature of 130°C and atomization pressure of 14.03 bars. Five different combinations of cells O/S were tried. Overall, the 1-A, 3-A, 4-A & 6-A O/S cell configuration was be the best configuration of cells O/S for 50 percent load, due to its lowest TSP emissions and highest reheat steam temperatures.
Parametric Testing
A series of parametric tests was performed at full-load, 75 percent load and 50 percent load operating conditions. For all runs, operating data were collected for at least a 15-minute time interval, once steady state operation of the unit was achieved. A combination of data collected automatically by the Distributed Control System (DCS), the E-DAS Continuous Emissions Monitoring (CEM) system, and data collected manually was used in data processing and for test documentation. Off-line data included fly ash carbon content of the soot, and net unit heat rate. Soot samples were collected isokinetically at the stack and analyzed at the station. Changes in net unit heat rate were calculated using a heat and mass balance model of the unit. Thirty-four parametric tests were performed at 50 percent load, with the 1-A, 3-A, 4-A & 6-A cell O/S configuration, and using a combination of excess O2 and FGR settings. Figure 6 shows TSP emissions as a function of economizer O2 at 50 percent load. Two sets of data are shown in Figure 6. The first set of data was taken with dirty burners, when the fuel pressure rose to 18.5 bars. The second set of data was taken with clean burners, after the burners were cleaned and the fuel pressure was reduced to the 15.4 bar level. The trend in both cases is similar; however, it indicates that as the burner nozzles get dirty the TSP vs. excess O2 curve shifts to the right and higher levels of excess air are required to operate at the "knee" of the curve and prevent TSP emissions from spiking above the environmental emissions limit. The "knee" in the TSP vs. O2 curve under clean conditions occurs at approximately 3.3 percent excess O2. Figure 7 shows NOx emissions vs. excess O2 at 50 percent load. The trend indicates that at 175 MW, NOx emissions decrease by approximately 35 ppmv for a 1 percent reduction in the average economizer O2 concentration.

Twenty-six parametric tests were performed at 75 percent load, with the 4-A & 6-A cell O/S configuration. As for the 50 percent load testing, the tests at 75 percent load included combinations of excess O2 and FGR. A similar response to the impact of excess O2 on emissions and performance at 175 MW was obtained at 255 MW. A series of tests was conducted at 75 percent load to evaluate the effect of FGR register position on boiler emissions and performance. Manipulation of the FGR registers was accomplished at different levels of excess O2, while the other boiler parameters were at baseline settings. The results of these tests are shown in Figures 8 and 9. It was found that at 255 MW, TSP emissions increase in the 20 percent range due to the addition of FGR from 0 to 100 percent. The impact of FGR on NOx ranges from 5 to 10 to percent for the 0 to 100 percent FGR range.


Fifty-six parametric tests were performed at full load with all cells I/S. The tests at 100 percent load included combinations of excess O2, fuel temperature and atomization pressure. Tests with the FGR registers were not performed at full load, since at this load the flue gas recirculation is not manipulated. The series of tests conducted at full load to evaluate the effect of atomization pressure and fuel temperature on boiler emissions and performance was accomplished at different levels of excess O2 in a range from 0.6 to 1.8 percent.
The results of the fuel pressure tests on TSP are shown in Figure 10. The effect of the steam atomization pressure on TSP is of reducing TSP emissions as much as 15 mg/Nm3 per bar increase in atomization pressure at the low O2 levels. The effect of steam atomization on NOx emissions was less significant than for TSP, representing approximately 1 percent increase in NOx emissions per bar increase in atomization pressure, independent of the excess O2 level.

Optimal Boiler Control Settings
A database was created from the test results for each load. The data were then used to create artificial neural network (ANN) models to establish the functional relationships (nonlinear mapping functions) between inputs (boiler controllable parameters) and outputs (emissions and performance). ANNs use a trial and error method of learning or training. Individual ANNs containing the relationships between TSP and NOx emissions, and heat rate, were developed as a function of the independent parameters, excess O2, FGR register opening, fuel temperature and steam atomization pressure [2,3]. The type of network used for this application was a feed-forward network with back-propagation learning. In this type of network, the information flows from the input vector to the output. The back-propagation training scheme is a generalized form of the Widrow-Hoff delta rule, which is basically a gradient descent algorithm designed to minimize the network error function. The transfer functions applied to the different layers were tanh and sigmoid functions. The predictive performance of the ANN models was evaluated via a statistical error. The error in the prediction of TSP at 50 percent load was approximately 14 mg/Nm3 (see Figure 11). The error in the prediction of NOx and heat rate at 50 percent load was approximately 3 ppmv, and 6.2 kJ/kW respectively. The error in the prediction of TSP at 75 percent load was approximately 23 mg/Nm3. The error in the prediction of NOx and heat rate at 75 percent load was approximately 3 ppmv, and 3.6 kJ/kWh respectively. The error in the prediction of TSP at 100 percent load was approximately 15 mg/Nm3. The error in the prediction of NOx and heat rate at 100 percent load was approximately 7 ppmv and 4.9 kJ/kWh, respectively.

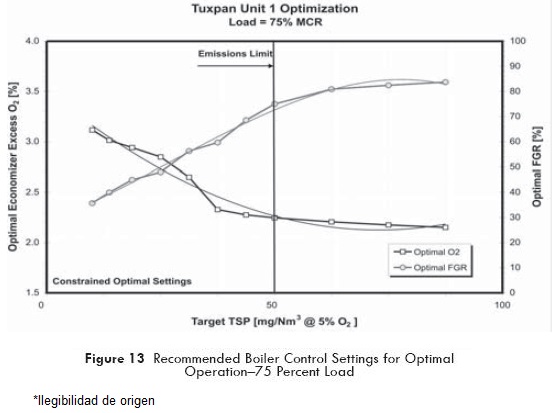
An optimization algorithm was used to determine boiler control settings for a target TSP emissions level for the three test loads, and for a range of target TSP levels. The optimization algorithm is an implementation of the Nelder-Meade Downhill Simplex optimization method [4]. For illustration, optimization results are presented in Figures 12 and 13 for 75 percent load. Heat rates were expressed as differences with respect to the minimum heat rate value obtained from all test points in the 75 percent load set. Solid symbols in Figure 12 indicate the optimal settings determined by the optimization algorithm. Two sets of optimal settings were obtained, one set unconstrained and the second set constrained by boiler control settings that achieved steam temperatures as close as possible to the design level. The test data (indicated by open diamonds) show that for each TSP emissions level there is a range of boiler setting combinations, with an associated heat rate penalty range. The heat rate penalty increases as the target TSP level is reduced. At 75 percent load, the results indicate that operation at minimal heat rate penalties is possible over the entire TSP range, where ANN solutions are available, if no constraints are imposed. However, if the combinations of excess O2 and FGR settings are constrained for hot reheat temperature, some heat rate penalty is incurred, as evidenced by the solid blue square trend in Figure 12. Based on the constrained results at 75 percent load, recommendations for the controllable parameters (excess O2 and FGR register opening) are provided in Figure 13 for the available range of target TSP levels. The recommended boiler control settings for the target TSP level are 2.33 percent and 60 percent for excess O2 and FGR, respectively. As it can be seen from Figure 13, to operate at reduced levels of TSP, the optimization algorithm recommends gradually higher levels of excess O2. In addition, the recommendation for optimal and constrained FGR is to operate close to 85 percent open at high levels of TSP and close the recirculation of gases gradually as lower TSP emissions levels are required. It was estimated that the recommended optimal settings would produce a NOx level of approximately 230 ppmv, main and hot reheat temperature at 538.4°C and a heat rate penalty of approximately 8 kJ/kWh.

On-Line Advisory Software
An on-line advisory software was developed and implemented at CTPALM Unit 1. A schematic diagram of the software system and data flow is presented in Figure 14. The on-line plant data, such as: unit load, TSP and NOx emissions level, excess O2, FGR damper setting, steam temperatures, etc. are provided on the plant Ethernet by an Alstom OPC client application. The data are processed by a DDE application and an interface program, which creates an input database. The input database is read by the Boiler OP software. The Boiler OP software, running on a dedicated computer, processes the received information and determines optimal boiler control settings (as functions of user-specified target TSP level) and calculates the emissions and heat rate penalty for not operating at optimal control settings. Recommendations are provided on required actions if the actual operating conditions deviate from the optimal values. Information concerning the actual operating conditions and target TSP and NOx level is displayed along with the recommended optimal settings and calculated emissions and heat rate penalties. An expert system is also provided in Boiler OP that tracks fuel pressure and indicates the potential fouling of the burner nozzles, making recommendations for their cleaning. This particular recommendation is linked by the operators at the station to the Coen flame management system and to particular burners which may have deficient flame frequency responses.
Summary and Conclusions
Combustion optimization of CFE's CTPALM Unit 1 was performed by the ERC, CIDESI and LAPEM. The objective of this project was to demonstrate the benefit of using a systematic approach to optimize combustion, with specific objectives of maintaining a specified level of stack TSP and NOx emissions, and subject to minimal impact on unit heat rate. The intelligent combustion optimization code Boiler OP was used to perform the combustion optimization of CTPALM Unit 1. Combustion optimization was performed at unit loads of 350, 255 and 175 MW. Tested boiler control parameters included excess O2, flue gas recirculation rate, atomization pressure and oil temperature. Data obtained from parametric testing were used by Boiler OP to develop neural networks which provided functional relationships between emissions, performance and boiler control settings. These results were then used to determine optimal combinations of boiler control settings which satisfy the optimization goal. An on-line advisory software was developed and deployed at CTPALM Unit 1 in May 2007. The on-line software has been operating since, with reliable results as indicated in Figure 15.

Acknowledgements
The authors would like to thank the support for this project provided by the Sectorial Fund for Research and Technological Development in Energy (Fondo Sectorial de Investigación y Desarrollo Tecnológico en Energía in Spanish), which is auspiced by the Mexican Federal Commission of Electricity and the Mexican National Council of Science and Technology.
References
1. Norma Oficial Mexicana NOM-085-SEMARNAT-1994. Secretaria de Medio Ambiente y Recursos Naturales, December, 1994. http://www.climate-policy-map.econsense.de/legalbasis. [ Links ]
2. Romero, C., et al., "Combustión Optimization of Pdte. Adolfo Lopez Mateos Unit 1." Energy Research Center Report No. 07-400-08-10, April 2007. [ Links ]
3. Romero, C., Sarunac, N and Levy, E., "Field Results from Application of Boiler OP to Utility Boilers." First Annual Joint ISA POWID/EPRI/DOE Inst. and Controls Conf., San Antonio, TX, 2000. [ Links ]
4. Press, W., et al., "Numerical Recipes in C: The Art of Scientific Computing." Cambridge University Press, 1992. [ Links ]

