


 nueva página del texto (beta)
 Inglés (pdf)
 Artículo en XML
 Referencias del artículo
 Enviar artículo por email
 Citado por SciELO
  Similares en
SciELO
Similares en
SciELO 
 Permalink
1. Introduction
Sickle cell disease (SCD) is a hereditary and life-long blood disorder with a 3.85% morbidity and mortality rate in the eastern province of Saudi Arabia (Alabdulaali, 2007; Jastaniah, 2011). SCD is characterized by changes in single nucleotide substitution in the sixth codon in the b-globin chain of the hemoglobin (Hb), forming Valine instead of Glutamic acid (Ilesanmi, 2010; Voskaridou et al., 2012). This gene is inherited from one parent or both, which can cause various types of SCD. The multiple types of SCD include sickle cell anemia (Hb-SS), hemoglobin C disease (Hb-SC), and Beta-Thalassemia disease (Hb-S/β thal) (Borhade & Kondamudi, 2022; Quinn, 2013). This work is focused on sickle cell anemia (Hb-SS), a condition caused by the inheritance of the Hb-S gene from both parents. The red blood cells are deformed due to changes in the Hb, and as a result, they become rigid, forming a sickle shape instead of the rounded normal red blood cells (RBCs) shape (Quinn, 2013). The normal Hb concentration range in the blood is 13.5-17 g/dl in males and 12-15 g/dl in females. The sickle cell patient has fewer red blood cells than the normal case due to RBCs' sickling; consequently, the patient is likely to have a reduced Hb level that causes an iron deficiency (Ilesanmi, 2010) World Health Organization (WHO) published a statistical distribution of Hb level for anemia and non-anemia case, as shown in Table 1. (World Health Organization, 2013)
Table 1 Haemoglobin levels to diagnose anaemia at sea level (g/dl) ±.
| Population | Non-anaemia | Mild anaemia | Moderate anaemia | Severe anaemia |
|---|---|---|---|---|
| 6-59 Months of Ages | 11 Or Higher | 10-10.9 | 7-9.9 | Lower Than 7 |
| 5-11 Years of Age | 11.5 Or Higher | 11-11.4 | 8-10.9 | Lower Than 8 |
| 12-14 Years of Age | 12 Or Higher | 11-11.9 | 8-10.9 | Lower Than 8 |
1.1 SCD complications
The SCD patients usually present in the emergency with deranged vital signs where the temperature, heart rate and respiratory rate are increased, and oxygen saturation and Hb levels are decreased. Sickle cell disease is associated with various complications, including Hypoxia, Vaso-occlusive crisis, Acute chest syndrome, Cardiac failure, and multiple organ involvement. Hypoxia is a common manifestation among children with SCD and is related to painful crises and acute chest syndrome (ACS) (Halphen et al., 2014; Setty et al., 2003). The oxygen diffuses from the alveolus to the pulmonary capillaries during the oxygenation process, where it binds with the erythrocytes' Hb or goes into the plasma. Desaturation of oxyhemoglobin causes an induction in the sickling of erythrocytes (Gladwin & Sachdev, 2012). Vaso-occlusive crisis or painful crisis is a common presentation sickle cell patient in different organs, an acute drop in hemoglobin level caused by blood trapped within the spleen. (Manwani & Frenette, 2013). It happens due to the blockage (occlusion) in blood vessels. The normal erythrocytes flow smoothly through the vessels; on the other hand, the sickle shape erythrocytes don't. The distorted erythrocytes adhere to the endothelial vessel wall and damage it. This crisis is characterized by a sudden pain in the body (skeletal or soft tissue) in the area distal to the occlusion because of not getting enough blood it needs. Other VOC signs presented are dehydration, fever, fatigue, breathing difficulty, tachycardia, increased blood pressure, Hb level reduction, and decreased oxygen saturation (SpO2) (Ballas, 2012). Cardiac complications are one of the most dangerous manifestations of SCD and a crucial cause of increased mortality. The chronic anemia of SCD is compensated by increasing the cardiac output to maintain oxygen delivery (Gladwin & Sachdev, 2012). As a result, the cardiac chambers dilate, and the heart may enlarge, causing high-output heart failure (Jain et al., 2017). An increase in heart rate is another symptom in SCD patients due to the vessels' occlusion by sickled red blood cells during the disease crises, which may accompany severe pain or other symptoms such as acute chest syndrome (ACS) (Tan et al., 2016). Fever is another manifestation of sickle cell disease (SCD) that happens during the Vaso-occlusive crisis (VOC) (Roseff, 2009).
1.2. Effects of vital parameters disturbances on SCD patients
In order to understand sickle cell disease (SCD) and the variations in the vital sign parameters and Hb levels, there is a need to review real-life cases. Patients of different ages and gender who were diagnosed with SCD and admitted to the hospital due to disease complications, as mentioned in Table 2. All the patients have increased temperature, heart rate, blood pressure and respiratory rate (BPM). At the same time, decreased oxygen saturation and hemoglobin level indicate complications of the body organ system.
Table 2 Real life SCD patients with deranged vital parameters.
| SCD patient | Age (years)/ Gender | Temperature (°C) | Heart rate (BPM) | Respiratory rate (BPM) | Blood pressure (mmHg) | Oxygen saturation (%) | Hemoglobin (g/dl) |
|---|---|---|---|---|---|---|---|
| 1 (Pedram et al., 2012) | 3.5/female | 39.5 | 110 | 32 | 90/60 | 4.5 g/dl | |
| 2 (DeBaun & Strunk, 2016) | 1/male | 40·6 | 140 | 38 | 100/82 | 100 | |
| 3 (DeBaun & Strunk, 2016) | 9/female | 38·1 | 190 | 60 | 108/68 | 94 | |
| 4 (Edwards et al., 2013) | 19/male | 76 | 96 | 7 | |||
| 5 (Moori et al., 2018) | 35/female | 37.7 | 110 | 20 | 130/80 | 98 | 10.8 |
In the case studies mentioned above, it is noticeable that different techniques were required to measure most of the deranged vital body parameters, such as heart rate, body temperature and hemoglobin level. For this, SCD patient is supposed to admit to the hospital to monitor their vital signs and Hb measurements. The main drawback of traditional monitoring methods is the vital signs and hemoglobin measurements that consume more time in the early detection of SCD complications. Therefore, this research proposes a wearable, non-invasive wristband technology to continuously measure vital parameters and Hb levels that significantly reflect SCD patients' conditions.
Hb estimation is a crucial parameter in determining the physiological well-being of the individuals, especially among the SCD patients, where the sickling of the RBCs hinders Hb absorption and subsequently results in low levels of Hb, which is anemia. The conventional methods employed for the Hb estimation are invasive, which involves the pricking and drawing of blood that might be a painful and uncomfortable process. The sample is then sent for laboratory analysis. This method has several drawbacks like delay in the resulting outcome and the chances of contamination as well, which might be crucial in the acute real-time scenario, where the quick estimation is highly needed, like in the case of acute crisis of SCD patients. A non-invasive method for the Hb estimation encounters all these problems associated with the conventional method and continuous real-time monitoring of the Hb levels in SCD patients, which might help prevent the complication related to the anemia.
A study was conducted to estimate the Hb concentration using the principle of a pulse oximeter, where three LEDs were utilized with the wavelengths of λ1= 670nm, λ2= 810nm, and λ3=1300nm. The two LEDs with the ranges from 600 to1000 nm emit light that is considered the region of the therapeutic window and is constituted predominately by the absorption of Hb derivatives. Whereas the 1300 nm LED, the wavelength is predominated by the absorption of water (Timm et al., 2010). The 1300 nm is considered to calculate the total hemoglobin concentration accurately because it is the near absorbance peaks value of water in the blood. Therefore 1300 nm is chosen for this work to precisely estimate the Hb contents in the blood.
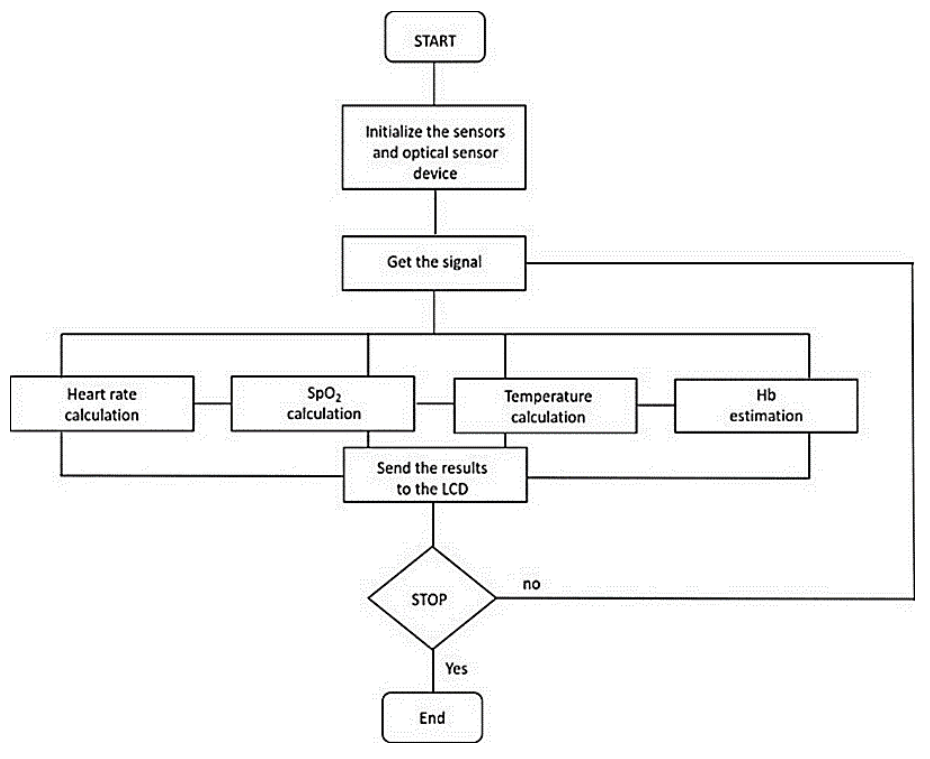
Finally, this work was achieved by assembling the optical sensors system with an Arduino microcontroller. The significance of the monitoring device is to increase the caretaker's awareness about their patient case and manage the situation by taking suitable measures, which lead to saving their lives. A prototype was built, which served the purpose of the wristband. The final product is a case that mimics the wristband and is worn around the patient's wrist.
2. Materials and methods
To conduct this study, 21 male and female participants were selected of different age ranges between 10 to 30-years-old as shown in Figure 1. All participants were explained about the intent and the importance of this study before taking their consent. It was clarified that they have the full right to deny and quit their participation during experimentation. Written informed consent has been acquired from each participant/caretaker of the children chosen for the study.

The inclusion criteria for the participants in this study included males and females aged from 5 to 30, documented SCD and anemia patients and the patients or the attendants/parents who provided consent. The exclusion criteria for this study were pregnant and breastfeeding females, patients with cerebrovascular accident, seizures, blood transfusion, systemic malignancy and hydroxyurea treatment for the last 3 months.
The participants were divided into three groups. The vital sign parameters and Hb were measured among the first group of 7 non-anemic participants with no significant history of anemia or any other underlying disease. The second group of 7 participants was the diagnosed cases of anemia, mostly due to iron deficiency. The third group of 7 participants was the diagnosed cases of sickle cell disease. Three consecutive vital signs and Hb measurements were taken from all 3 groups of patients to ensure accuracy and minimize the bias.
2.1. The optical sensor used for non-invasive monitoring: Reflective sensors for vital parameters
MAX30100 sensor is a simplified pulse oximeter design and a heart-rate integrated circuit for wearable medical devices (OpenSystems Media, n.d.). The main components of this sensor are the combination of two light-emitting diodes (LEDs), one in the Red-light spectrum with a wavelength of 650 nm and the other one is Infrared with a wavelength of 950 nm and photodetector. The sensor works on the principle of the pulse oximeter.
MLX90614 is an infrared sensor that uses heat radiation from the human body to determine the temperature (Ohira et al., 2011; Budzier & Gerlach, 2011). The MLX90614 sensor consists of sequentially connected thermo-couples. The sensor membrane is heated due to the absorption of IR radiation from the body and produces the thermopile output signal. After getting these outputs, the sensor can calculate the human body and ambient temperatures by digital signal processing, producing digital outputs related to the measured temperatures (Datasheet for MLX90614, n.d.).
2.2. Transmissive optical sensor for Hb level detection
The Hb concentration was estimated by calculating the transmittance of light in the finger by Beer Lambert's law (Timm et al., 2009). According to Beer's law, when the light passes through a medium, there is an exponential decrease in the intensity of transmitted light as the concentration of the substance in the medium increases. It also states that the Hb concentration in blood is directly proportional to the extent of light absorbance, while transmittance is inversely proportional to Hb concentration.
The non-invasive optical sensor system is employed to estimate the Hb levels of all the participants of the 3 groups, and an LED light source transmitted through blood at the fingertip is considered, as shown in Figure 2. Participants were made to sit for a few minutes at room temperature before the estimation with the optical setup. A probe is placed on the index figure and works as a function of transmittance and reflectance mode. When IR light passes through the index figure, a small amount of current is detected by a photodiode and converted into a voltage. Hb levels were determined as voltage measured by the sensor output (Devakumar et al., 2019). The Hb concentration in the blood determines the absorbed and transmitted light; the higher concentration of Hb transmits a lower amount of light. Therefore, the transferred light's strength determines the concentration of Hb levels, and the transferred light is received at the receiver as a voltage level.

2.3. Optical sensor design
The optical sensor comprises two main components: transmitter and receiver. The transmitter side consists of NIR LED driving circuit λ = 1300nm with DC forward voltage 1.3V and current limiting resistor R=100 in series with the LED, as shown in Figure 3 (a). The receiver side consists of a low pass filter, photodiode, and two operational amplifiers (LM358), as shown in Figure 3 (b). The low pass filter with a cut-off frequency 1.5KHz. FGA01 InGaAs photodiode with spectral range 800 nm to 1700 nm with reverse-biased voltage 3.3V. The near-infrared light from the LED passing through the index finger and received at the receiver side is in millivolts and considered very low signals. That's why signal amplification is required. The signal amplification is attained using two amplifiers (LM358) circuits in the inverting configuration with a gain of 10 and input voltage of 5V, as shown in Figure 3 (a). Finally, the output of the optical sensor system was connected to Arduino, and the results were displayed on LCD. The Hb estimation of all the participants was carried out following the same principle by using an optical sensor system, and results were mentioned, as shown in Figure 5.

Figure 3 Schematic diagram represents the optical-based wristband, which includes (a) optical sensor, (b) operational amplifier, (c) temperature sensor and (d) pulse oximetry and a heart-rate monitor.

2.4 The components of the wristband connected with the Arduino
In this work microcontroller used to program the components of the optical-based wristband is Uno Arduino. The prime reason for choosing this microcontroller is its multiple functional properties, and it's comparatively easy to use and program. The MAX30100 and MAX90614 sensors are connected to Arduino, as shown in Figure 3 (c and d) . The power pins of both the sensors are connected to 3.3 and 5V Arduino, respectively. The sensors' ground pins are connected to the ground (GND) pin of Arduino. The INT pin of the MAX30100 is connected to the D2 pin (INT0) of the Arduino. The A4 (SCL) and A5 (SDL) pins of the Arduino are used to connect the SDA and SCL pins of both sensors. A7 and ground (GND) pins of the Arduino are used to connect the output and ground of the optical sensor, as shown in Figure 3 (a) .
The LCD is used to display the temperature 0C, heart rate bpm, oxygen saturation level %, and voltage levels obtained from an optical sensor to interpret Hb estimations. Finally, MAX30100, MAX90614, and optical sensors take the input signal from the body for the temperature calculation, heart rate, oxygen saturation levels, Hb estimations and send it to the Arduino; the Arduino performs the calculation and process the data. The results from all the sensors connected to Arduino are displayed on LCD. The MAX30100, MAX90614 sensors were placed close to the radial artery on the wrist. At the same time, an optical sensor was placed on the participant's index finger after the connections were made with Arduino. The Hb estimation of all the participants was carried out following the same principle by using an optical sensor system, and results were mentioned, as shown in Figure 4.
2.5. The 3D case design of prototype device
The final stage of this work was to conceptualize the project idea into a 3-D printed prototype. The prototype depicts a wristband that is specially designed for monitoring clinical manifestations of sickle cell patients. The estimated dimensions of the prototype are 6x5x3 cm, and 3 V lithium cell battery is used, and it acts as backup power to the clock. The weight of the battery is lighter with improved safety and fast charge and discharge capability along with long cycle life and does not require maintenance. At the first stage of the prototype design, Microsoft 3D builder software was used as a prototype box with several openings for the sensors, LCD, and the wires for Arduino and sensors placed inside the prototype box, as shown in Figure 5 (A) . The wristband prototype is a case that is worn around the patient's wrist that has an upper cover and a lower base, as shown in Figure 5 (B and C) . The stages followed in the design are combining the codes of temperature, SpO2 and heart rate sensors, an optical sensor with an LCD. The final circuit was developed by soldering the sensors over the stripboard, as shown in Figure 5 (D) . The final design was built by incorporating all the components within the prototype box, wrapped with a band retained as a wristband, as shown in Figure 5 (E) . The final design of the prototype and results during the program's execution are shown in Figure 5 (F) . The hardware design privacy protected under EU data protection law.
3. Results and discussion
The Hb estimation in this work is done with the assistance of an optical sensor. The measurement of Hb is based on the principle of a substantial amount of absorption/transmission of light in the near-infrared region. The accuracy of non-invasive Hb profoundly relies upon the concentration of Hb in the blood plasma and the wavelength of the LED light source. When the 1300 nm LED source of light passes through the fingertip, it is observed that as the Hb concentration builds up in the blood plasma, the level of the light source through the fingertip absorption increases and, consequently, less light is transmitted and vice versa (Tan et al., 2016). The heart rate and oxygen saturation levels were measured by the Reflective optical sensor using the pulse oximetry principle, whereas the infrared sensor measured the temperature. The prototype accuracy is evaluated by comparing the vital signs from the patient's hospital record, which were evaluated using the digital thermometer and digital pulse oximeter probe for temperature, heart rate, oxygen saturation level, and Hb levels by using hemoglobin Assay Kit. The accuracy of the prototype has been found to have a significant margin of over 85 % for its measured parameters. The heart rate achieved ± 1±2 % of hemoglobin.
Figure 6 demonstrates the comparison between the Hb concentration and the relative output voltages that exhibited variation of voltages among all the 3 groups of participants due to different Hb concentrations in blood plasma. The Hb concentration and output voltages show an inverse relationship; as the Hb concentration decreases, the output voltages are increased in all the 3 groups, as shown in Figure 6. The group 1 participants were non-anemic patients and represented blue color in the graph, and their hemoglobin concentration ranges from 13.5 to 16.5 g/dl. Therefore, exhibit a low output voltage range between 1.18 to 0.7 volts, resulting in higher absorption and minimal transmission of light due to the high concentration of Hb in the blood plasma. The group 2 participants were anemic patients with mild to moderate anemia and are represented by red color in the graph, and their Hb concentrations range from 7.5 to 10.5 g/dl. Therefore, an increase in the output voltage with a decrease in the Hb levels resulted in minimal absorption and high transmission of light due to low Hb concentration in the blood plasma and are interpreted as high output voltages ranging between 1.88 to 2.25 volts. Group 3 were SCD patients with mild to severe anemia and are represented by grey color in the graph, and their Hb concentrations range from 6 to 9 g/dl with the output voltages ranging between 2.05 to 2.31 volts. The few participants in this group represent an additional increase in the output voltage with a further decline in the Hb levels. Therefore, it resulted in the least absorption and higher transmission of light due to the low Hb concentration in the blood plasma and is interpreted as a higher output voltage.

The typical vital signs and Hb levels found in the human body are used to compare the measured values of vital signs and Hb levels of all the participants. The normal human body temperature lies between 36 to 37 oC, heart rate is between 60 to 100 bpm, oxygen saturation is between 95 to 100 %, and Hb levels are between 12 to 17 g/dl.
These reference ranges are the same among all three groups of participants. Any deviation from normal reference ranges of human body vital signs and Hb levels indicates the diseased condition or abnormality in the participants.
3.1. For temperature
Figure 7 (A) demonstrates the comparison between the measured body temperature ranges of 21 non-anemic, anemic, and SCD patients. The participants of group1 and group 2 represent the non-anemic and anemic patients. Therefore, their body temperatures lie within the normal reference ranges, as illustrated in Table 2. The participants of group 3 represent the SCD patients, and there is a rise in body temperature of the three patients than the normal temperature ranges from 39 oC to 40 oC, respectively. The average temperatures from different groups of participants (non-anemic, anemic, and SCD patients) are compared in Figure 8 (A). The error bars indicate the standard deviation (SD) in Figure 8. It is clearly visible in Figure 8 (A) that SCD patients have elevated temperatures, whereas the other two groups (non-anemic and anemic) show almost similar average temperatures. All three different groups of participants (non-anemic, anemic, and SCD patients) statistically compare in Figure 8 (A) . The graph shows that SCD patients have a higher average temperature as compared to non-anemic and anemic groups.

Figure 7 Represents the comparison between body temperature (A), Heart rate (B) Oxygen saturation, and (C) and Hb measurement (D) of the Non- anaemic, Anaemic and SCD patients.
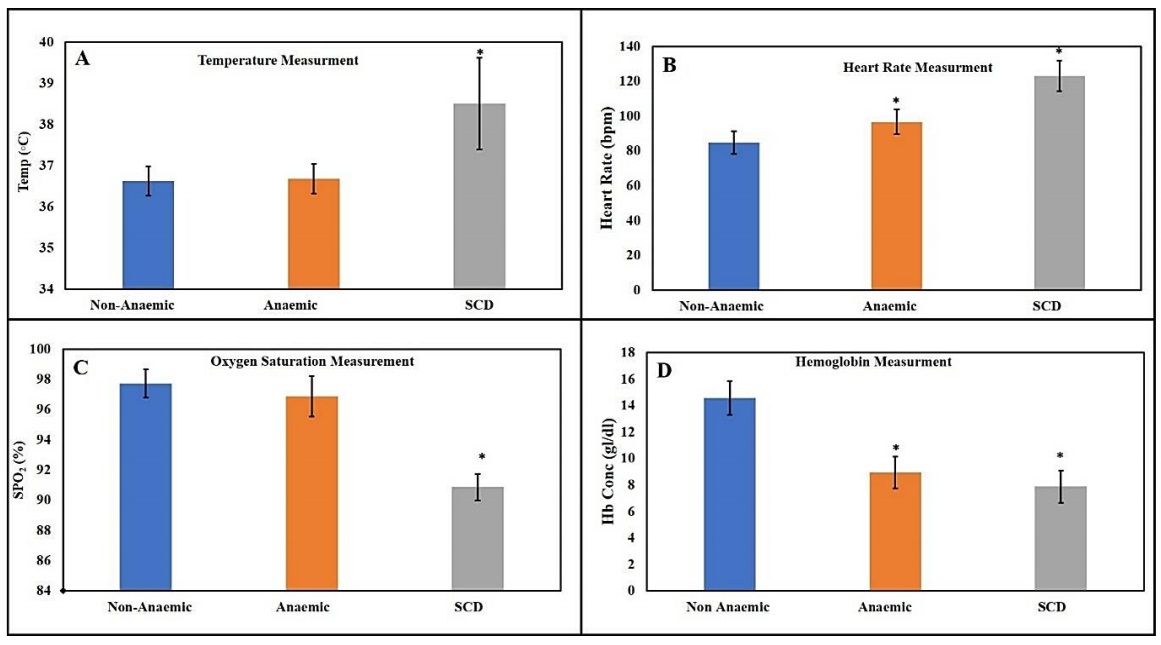
Figure 8 Represents the comparison among three different groups of participants (non- anemic, anemic and SCD patients) using four different physiological parameters that include: temperature (A), oxygen saturation (B), heart rate (C) and Hb measurement (D).
All three temperature measurements were compared with the one-way ANOVA post hoc Bonferroni test for further comparison analysis, as shown in Figure 8 (A) . The test confirms that no significant temperature difference exists between the non-anemic and anemic measurements (p>0.05). There is a significant temperature difference exist between non-anemic and SCD patients (p<0.001), and there is also a significant difference exist between anemic and SCD patients (p<0.001). Temperature is a concerning sign in SCD if it's elevated more than 38.5 centigrade as these patients have high sensitivity to the temperature (Brandow et al., 2012). Therefore, this study considers temperature one of the important parameters for pain diagnosis via temperature as these SCD patients feel extreme pain in both extremities of temperature (hot or cold) (Timm et al., 2009).
3.2. For heart rate
Figure 7 (B) demonstrates the comparison between the measured heart rate ranges of 21 non-anemic, anemic, and SCD patients. The comparison between the normal heart rate as a reference and the measured heart rate of all three groups is illustrated in Table 2. The participants of group1 and group 2 represent the non-anemic and anemic participants, and their heart rate lies within the normal ranges (60 to 100 bpm) except participants 5 and 6 of group 2 that show an increase in the heart rate than the normal reference ranges as illustrated in Table 2. The participants of Group 3 represent SCD patients, and their heart rate is significantly increased than the normal heart rate ranges (100 to 135 bpm), as illustrated in Table 2. The average heart rate from three different groups of participants (non-anemic, anemic, and SCD patients) is compared in Figure 7 (B). The graph shows that SCD patients have a higher average heart rate as compared to non-anemic and anemic groups.
All three temperature measurements were compared via one-way ANOVA post hoc Bonferroni test for further comparison analysis that reveals a significant difference in the heart rate between non-anemic and anemic groups (p<0.001), as shown in Figure 8 (B). Significant differences present in non-anemic and SCD patients (p<0.001), and significant differences exist between anemic and SCD patients (p<0.001). Heart rate is usually higher in anemic patients due to iron deficiency in the body; as evident from Figure 7 (B), SCD patients have a much higher average heart rate than non-anemic and anemic participants. They also have chronic anemia and more iron deficiency than mild anemic or non-anemic participants (Eichner, 2010). Thus, heart rate is an important parameter to consider in SCD management.
3.3. For oxygen saturation
The comparison between the measured oxygen saturation ranges of 21 non-anemic, anemic, and SCD participants is demonstrated in Figure 7 (C). The comparison between the normal oxygen saturation as a reference and measured oxygen saturation ranges of all three groups is illustrated in Table 2. The participants of group 1 and group 2 represent the non-anemic and anemic patients; their oxygen saturation lies within the normal reference ranges, as illustrated in Table 2. The participants of Group 3 represent SCD patients, and their oxygen saturation is less than the normal oxygen saturation ranges (95 to 92 %), as illustrated in Table 2. The average oxygen saturation in SCD patients is lower than in non-anemic and anemic groups, as shown in Figure 7 (C).
Further comparison analysis using a one-way ANOVA post hoc Bonferroni test highlights that there is no significant difference in the oxygen saturation exists between non-anemic and anemic groups (p<0.001), as shown in Figure 8 (C). But there is a significant difference in oxygen saturation present in non-anemic and SCD patients (p<0.001), and also a significant difference exists between anemic and SCD patients (p<0.001). Patients with SCD face hypoxia (lower oxygen saturation) than non- anemia and anemic individuals (World Health Organization, 2013). It is because 2,3 diphosphoglycerate (2,3-DPG) decreases Hb affinity for oxygen and causes lower oxygen saturation at any oxygen pressure (PaO2) (Pianosi et al., 1993).
3.4. For hemoglobin
Figure 7 (D) demonstrates the comparison between the measured Hb levels ranges of 21 non-anemic, anemic, and SCD patients. The participants of Group 1 represent the non-anemic patients; therefore, their Hb levels lie within the normal reference ranges (13 to 17 g/dl), as shown in Table 2. The participants of Group 2 represent anemic patients, and their Hb levels are less than the normal reference Hb levels (7.5 to 10.5 g/dl), which demonstrate mild to moderate anemia, as shown in Table 2. The participants of Group 3 represent SCD patients, and their Hb levels are also less than normal reference Hb levels (6 to 9.5 g/dl), which demonstrate moderate to severe anemia, as shown in Table 1. The graph in Figure 7 (D) shows a lower average hemoglobin level. It is slightly comparable to anemic group of participants, whereas non-anemic groups are under the normal level of hemoglobin (12-17 g/dl).
Further comparison analysis using a one-way ANOVA post hoc Bonferroni test reveals that there is a significant difference in the Hb level exist between non-anemic and anemic groups (p<0.001), as shown in Figure 8 (D). Similarly, there is a significant difference in Hb level present in non-anemic and SCD patients (p<0.001), and also, no significant difference exists between anemia and SCD patients (p<0.001). To avoid vaso-occlusion, blood transfusion is necessary to increase oxygen-carrying Hb, as in mild or chronic anemia, patients need on time transfusion indicated by the level of hemoglobin in the blood (Howard, 2016).
The participants of Group 1 were non-anemic and did not show any variations in the body's vital signs and the Hb levels; not demonstrate any variations in body temperature and oxygen saturation levels and were found within the normal therefore, all the measurements were within the normal ranges. Group 2 participants were anemic patients, and they also did reference ranges. However, as expected, they show decreased Hb levels (mild to moderate anemia), resulting in a significant increase in the heart rates of participants 5 and 6 with moderate anemia due to decreased oxygen availability and subsequently increase in heart rates. Group 3 participants were SCD patients and showed significant variations and abnormalities among all the vital sign parameters and Hb levels. The Hb estimation was also considerably low (moderate to severe anemia) among all the SCD participants, majorly because these patients sickled red blood cells. The body temperatures of participants 1, 5, and 6 were higher, showing some underlying organ infections or crisis at admission. The heart rates of all the SCD patients were much higher, while oxygen saturation levels were lower than the normal reference ranges. One-way ANOVA was performed to compare the average measurements from three different participants' groups for statistical analysis. This statistical tested among the population either any difference exists among three or more groups. These findings are evidence of low availability of oxygen that might predict the occurrence of blood vessel occlusive disorder and the resulting pressure on body organs such as the heart and lungs.
4. Conclusion
The proposed optical sensor-based wristband for the SCD patients’ health status monitoring successfully detects, monitors, and demonstrates the vital body sign. It includes body temperature, heart rates, oxygen saturation and estimated the Hb levels of the 21 participants that were healthy, anemic, and anemia SCD. The prototype provides an unhealthy status via beeps that alert users for a health checkup. The prototype won't require any operational expertise as it can be utilized conveniently by anyone and anywhere. The wristband prototype enables the continuous monitoring of the body's vital signs and Hb anywhere, and any significant variation can be monitored and detected continuously. It enables the patient and the caregiver to seek healthcare aid in case of any sudden emergencies and be helpful to rectify them immediately.
5. Limitations
Few limitations came across while designing the wristband prototype. Compact components are required to design the wristband. The size of the components should be minimal to fit in the wristband that has the reliability to perform the functions for the longest possible period. These limitations can be overcome if the Arduino is replaced with a SAML21 microcontroller with a smaller and higher performance.
6. Future research plan
As mentioned in the case studies, other vital sign parameters are also affected by SCD condition (respiratory rate and Blood pressure). The current wrist band algorithm will be updated with a more advanced algorithm to measure respiratory rate and BP from optical pulses. Based on the current design idea, the new approach of the wristband can be developed and improved by combining the wristband with the new technology, especially for children suffering from SCD. The improvement of the design can be reached by using wireless technology to notify the parents or the physicians about the child's condition to attain the fastest management of the crisis. This goal can be accessed using the GSM shield (integrated antenna), which allows the Arduino to connect with the internet and send /receive SMS messages. This integrated antenna makes it possible to send the vital signs readings every 10 minutes, for example, to the parent's phone as an SMS message, which helps follow-up their child's condition. If the parameters reach the abnormal limit, the device sends the readings every minute to attract parents' attention. The time settings can be controlled as needed by modifying the codes. The wristband can be made more functional for children by combining it with the Global Positioning System (GPS), especially in emergency cases. This property can be applied using the GY-NEO6MV2 GPS receiver, which can be connected to the Arduino to track the patient's location.

