


 nova página do texto(beta)
 Inglês (pdf)
 Artigo em XML
 Referências do artigo
 Enviar este artigo por email
 Citado por SciELO
  Similares em
SciELO
Similares em
SciELO 
 Permalink
1. Introduction
Every resource can be associated with a list of attributes with positive or negative relations with other elements, which under predefined criteria, can be regulated by the users, seeking the maximization of profits or minimization of negative effects accordingly with the defined criteria. In this sense, the problem of resource allocation seeks to associate any pair of elements, based on measurable quantities of specific attributes through the comparison between them, to accomplish the required conditions. The allocation of resources is not limited to material resources or machinery but also can be applied to different areas, such as planning or development of projects, by assigning resources such as time, skills, or personnel to accelerate the approach to certain objectives. In such cases, it is required to define indicators to set a scale from which to make a comparison.
In this regard, in the human resource management there’s an increasing number of companies that decentralize the search, selection, and allocation activities, contacting specialized institutions which work as intermediaries between companies and trained personnel, commonly indexed in a catalog which specifies their abilities, experience, skills and professional development interests for their allocation in different areas of a company or multiple companies. The main objective of these kind of schemes is to obtain knowledge and resources by cooperating with other companies that are more capable to perform specific tasks with increased efficiency, but they are also used to decrease the responsibility between the company and its personnel, among other risks (Vorajao et al., 2017). Within this system companies externalize their need to find qualified human resources with desired attributes, and other characteristics of the job profile, while human resources provide their labor profile by direct or indirect means to job boards, databases, or labor networks depending on the search algorithm (Abbas et al., 2021). Even though this kind of systems keep evolving, we think there’s been a lack of interest in the personnel itself, ignoring some of the reasons of job abandonment and reduced personnel efficiency. In this sense, although some proposals have been made to solve the classic and variants of the human resources assignment problem, few of them consider attributes such as distance or schedules as part of an integral assignment, focusing on the problem as a company efficiency-related task allocation problem, ignoring the sentient status of the personnel and its capacity to simply abandon the assignment.
We propose a solution through a simulation-optimization methodology which took into consideration attributes such as distance, schedules, and skills, in a real case problem from a public university social service program in Mexico City, serving as an intermediary institution, whose objective is to allocate students with certain skills and knowledge from the university to support micro, small and medium-sized enterprises (MSMEs) for 6 months by doing labors of diagnostics and assistance. In this case, distance and bad scheduling prompted complaints and desertion of the program by both parties due to the lack of any kind of standardized methodology for the allocation.
Whereas it would be commonly recommended to solve each of the assignment, location, and scheduling as different problems, this paper aims to propose a different approach to solve them, primarily from the data analysis and simulation perspective by using a new methodology. The proposed methodology is not limited to the human resource allocation problem, but it could also be applied to the general assignment and location problems. To the best of our knowledge, there hasn’t been another work that has used the concept of tessellation to solve multi-attribute personnel assignment problems, making this an original contribution.
1.1 Literature review
1.1.1 The assignment problem
The assignment problem or linear assignment problem is a two-dimensional combinatorial optimization problem. In its most general form, it describes the association of a set of n items
Representations of the assignment problem are not mutually exclusive and can be found as linear equations, matrices, networks, and other visual models.
The assignment problem as linear equations or linear programming model as presented in (1) can be structured as the transportation problem by representing the n set as origins, the m set as destinies, their relations as edges
Subject to:
This mathematical formulation (1) was presented by Frank Hitchcock in 1941 as part of his study of the transportation problem which stated the distribution of products from factories to cities, considering the cost of supply (Hitchcock, 1941). Later in 1953, Merrill Flood continued to study the Hitchcock Distribution Problem by using a matrix notation to analyze the mathematical justification of computation procedure for the same problem (Flood, 1953)
In its matrix scheme, the matrix arrangement represents the n set in rows and m set in columns with each cost of assignment detailed in their respective cross-section:
This form of the assignment problem was first presented as a combinatorial algorithm by Thomas Easterfield in 1946 in which he stated a set of steps from an original matrix (Eq. 2)to transform it into another to be capable of choosing a set of n items with no repetition in neither the same row nor column. (Easterfield, 1946).
Among the current methodologies that use this configuration, the Hungarian Method is one of the most popular. Although it was formally presented by Kuhn in 1955, he declared that the algorithm itself predates the birth of linear programming by more than 15 years and it was used by two Hungarian scientists: D. König and E. Egerváry (Kuhn, 1955). Kuhn used the Hungarian Method to solve the personnel-classification assignment problem described in 1953 by Votaw and Orden (1953) as a balanced perfect linear programming model equivalent to the transportation problem. The method itself maintains the criterion of balance between supply and demand to obtain an assignment where no repetitions of the n items are assigned to the same m element similarly as Flood presented it; starting from the use of the lowest values per line or column to assign temporarily the associated elements, progressively subtracting the rest of the relationships. Later in 1981, Dimitri Bertsekas modified the Hungarian method and applied it to randomly generated problems, making it capable of switching to the original methodology in case there were exceeding iterations of expected calculation to ensure a good solution in fewer iterations focusing on the comparison of times and complexity between the two (Bertsekas, 1981). More recently, in 2016, Amponsah, Otoo, and Quayson modified the Hungarian method, focusing on the reduction of computer processing times, by adding new restrictions through penalties. (Amponsah et al., 2016) and (Afroz & Hossen, 2017) presented another modification while evaluating it against other methods.
This relation between the assignment, transportation, and personnel-classification problems throughout history, also applies to other solution proposals such as the net or graph theory representations which are usually associated with problems such as transport, flow, and location problems. The most common representation of the assignment problem in graph theory are bipartite graphs (Edmonds, 1965), representing the n items on the one side and m elements on the other, with its associated cost presented as joining edges. In such representations it’s easier to observe the classification of assignments into balanced assignments or square matrices (n = m) and unbalanced assignments (n ≠ m) and according to Ramshaw and Tarjan (2012), the assignments could be further classified as perfect assignments and imperfect assignments. In particular, the classic definition of assignment problem requires the existence of a balanced perfect assignment, commonly explored under the search of one criterion given the complexity associated with the parallel examination of multiple and different information spaces. But in real case scenarios, the unbalanced and imperfect assignment problems are the most common, so to force the balance is common to select and cut some elements, although this might damage other relations inside a system. Other algorithms have tackled the imperfect assignments directly such as the forward/reverse auction algorithm presented by Bertsekas and Castañon (1993) as a practical evolution from the auction algorithm which was later theoretically analyzed by Ramshaw and Tarjan (2012).
Other solutions to real case scenarios have been presented as visually aided models. Visual models primarily use geometry to formulate equations or methodologies that support decision-making. They are commonly associated with transport or location problems. Some of the most commonly used are models based on Euclidean distances, like center of gravity, KNN (Mahdi Shavarani et al., 2017), coverage models (Hong et al., 2018), triangulation (Brownell & Kerr, 2012), and other heuristic methodologies (Soni et al., 2018). More complex representations of assignment problems may include the use of clustering methodologies (Kucukdeniz & Esnaf, 2018), and algorithms of the shortest or critical path (Celkevicius & Russo, 2018), although these kinds of solutions have been mainly classified as heuristic methodologies to solve different variants of the general assignment problem (Kundakcioglu & Alizamir, 2008).
Over the years an increasing number of real cases have been found requiring a broader study of what was initially considered isolated problems, such as the scheduling, routing, assignment, location, flow, and transport problems into an integrated set of solutions (Hervert-Escobar et al., 2016). This natural evolution of the problems also has increased their requirements to be solved under real circumstances, where methodologies such as the Hungarian Method or linear programming are less efficient under the set of solutions in the shortest time possible, such as natural disaster, personnel, medical or material assignment (Wang et al., 2021). It has also become necessary to generate models capable of receiving information in variable and repetitive flows, that may allow decisions to be made in the face of changes in dynamic environments (Schönberger & Kopfer, 2008). To solve this, there have been several articles that have analyzed the capacity and number of constraints of location and assignment problems, mainly with weighting unique criteria, such as cost, distance, or time (Boonmee et al., 2017), while other studies consider several elements of interest to establish a multi-criteria evaluation, which condenses multiple attributes into weights, facilitating the search for solutions (Kerr & Nanda, 2013), however, evaluations of this kind require a series of qualifiers for specific problems, which may vary between users, conditions, locations, etc., and it’s rare for responses to be assessed identically by different users, each with defining perspectives through their level of aptitude, knowledge, and skills (Besseris, 2009). Algorithms continue to evolve mainly on technology, creating a growing demand for the integral use of techniques developed in multiple areas to solve initially complex problems with a comprehensive solution (Yang & Chakraborty, 2020).
1.1.2. Human resources
In the management of personnel, human resources cannot be consumed or manufactured but can actively produce and react with their context. By doing so, each element is capable of processing situations in different ways, having a wide variety of personal objectives and attributes, making necessary to develop a mediator element between organizational and individual objectives, capable of analyzing the relationship between them in different fields. A recruitment agency, also known as a labor broker, takes contract responsibilities of recruiting employees for an organization for an agreed consideration. In such agencies, recruitment and selection are the first steps into choosing the ideal employee for the job, so ineffective recruitment will create a pool of poorly qualified candidates (Abbas et al., 2021).
In the literature there’s a difference between the personnel assignment problem and what is commonly referred to a selection or recruitment problem, being the main difference the recruitment status of the personnel and considering the personnel assignment more as a task allocation problem (Niknafs et al., 2013), although this may not be an appropriate division in real case scenarios, such as the case presented in this paper, in which the selection and recruitment is directly associated to task allocation.
In the selection and recruitment problem, the mediator can seek actively or passively through the market. In a passive search, the mediator may use some of the most common ways to find their recruits: from individuals that have previously submitted their application, employee referrals, contact with universities or schools, job fairs, labor offices, agreements with other companies, advertisements in newspapers and recent years, digital recruitment, electronic application systems, digital advertisement and social media (Abbas et al., 2021), while in an active search, the mediator might seek and evaluate the information of potential candidates in job databases to later contact with them and give them an offer, granting the recruit more affinity with the attributes and objectives of the company. Of both methods of recruitment, the passive approach is the most used, leaving the active search to more specialized companies due to its associated costs. Anyhow, the use of any source will create a cost associated with the search, evaluation, selection, recruitment, documentation, and accommodation, so it is highly advisable to have an actualized database of evaluated potential candidates to avoid their duplication (Chiavenato, 2007).
Once the search procedure and evaluation are terminated, a selection procedure starts, in which two or more potential candidates are compared via results of interviews, supervisor’s approvals, reference checks, and physical examinations (Abbas et al., 2021) to determine which candidate is the most appropriate. Under these conditions, the conformation of work teams is developed progressively and changes in their structures can easily be dealt by searching for a new element with similar characteristics.
Even though these are general conditions for the recruitment of new personnel in the classic labor model (Huemann et al., 2007), in recent years, project-based, outsourcing, technology, and consultancy companies have been on the rise, creating a new set of consequences originated by internal (Zika-Viktorsson et al., 2006) and external (Nikolau, 2021) allocation problems. These kinds of challenges have mainly been tackled by establishing hierarchical or selective structures (Momeni & Martinsuo, 2018). In dynamic assignment problems such as these, even simple rules can generate high complexity and finding the best solution in a dynamic set of rules is beyond the capacity of any area of human resources (Naveh et al., 2007).
1.1.3. Some approaches to human resource allocation
As stated previously in 1953 Votaw and Orden described the personnel-classification assignment problem as a balanced perfect linear programming model equivalent to the transportation problem which later was solved with the Hungarian method by Kuhn (1955), and following this line of investigation, several studies continued to improve different aspects of the Hungarian Method from the theoretical perspective, and it has even been stated that the Hungarian Method has been the most successful tool for solving the human resources assignment problem (Amponsah et al., 2016). Yet, various sets of investigations have tried through different kinds of methodologies to solve the variations of the personnel assignment problem. In a real case scenario, (Villagómez, 2015) evaluated the assignment of personnel based on the work schedules using a hybrid methodology that combined linear programming, historical forecast, and genetic algorithms to evaluate the required work shifts and personnel assignment based on the demand of telephone operators. (Naveh et al., 2007) presented an analysis of the operation of IBM’s personnel evaluation system, which uses descriptors, priorities, and constraint programming to solve the combinatorial problem while using a shortest route algorithm to reduce the distance between the employee residence and their workplace. In the allocation and scheduling of human resources for software development, (Al Khatib & Noppen, 2016) made a comparison between different approaches that mainly have used Genetic algorithms and Simulated Annealing. (Widianta et al., 2018) also made a comparison between easy-to-apply weight-based multi-criteria decision methods for employee placement such as the Analytic Hierarchy Process, Simple additive Weighting, TOPSIS, and PROMETHEE. (Leite et al., 2017) used Monte Carlo simulations to evaluate four different logical strategies for project-personnel assignments under the metrics of performance and success. (Yingbo, 2007) applied a machine learning algorithm in two enterprise workflow systems to create a classifier to suggest actors to activities. (Arias et al., 2018) presented different approaches to the human resource allocation problem that have been made from the perspective of the business process management and process mining.
Most of these approaches have considered the allocation of human resources as a company efficiency-related problem, in a similar fashion as the assignment problem considers the acquisition of resources, without considering the sentient status of a human resource. This may be one of the reasons why very few of them have considered the distance between the employee and the physical location of the company as an important attribute while preferring the task allocation approach or even the creation of clusters as part of the company’s overall performance optimization (Maw-Shin et al., 2014).
Even though the relation between human sentience and commute distance hasn’t been fully considered as part of the human resource allocation problem or even the selection-recruitment problems, it has been considered as part of the effects of commuting to work and teleworking. In a case study, (McLennan & Bennets, 2003) studied the stress generated by different types of transportation to assess the viability of mobile teleworking to improve the perceived effectiveness of workers. Following this trend, (Brutus et al., 2017) also studied the emotional perception and stress generated through a commute by three different transportation methods to assess the viability of cycling as another possible solution. Another trend (Tunyaplin et al., 1998) has considered teleworking as a possible solution to decrease the stress generated from a lack of interest in the long commutes of personnel, while also presenting the schedules flexibility, increased productivity, and environmental impacts (Pérez-Pérez et al., 2004) as other possible benefits, which has been somewhat proved as a success (Yanget al., 2021) despite the context.
Throughout history, the personnel assignment and its associated problems have been boarded from various and completely different approaches, while some have attempted to solve it from an exact approach, by reducing the problem to a much simpler version, others have tackled it from a heuristic perspective, under the consideration of them being NP-hard (Bruker et al., 2011; Kundakcioglu & Alizamir, 2008; Toroslu, 2003). To the best of our knowledge and upon the literature review, there hasn’t been another work that has used the concept of tessellation to solve multi-attribute personnel assignment problems in this configuration, being the closest, the IBM study (Naveh et al., 2007) and an approach to the personnel assignment problem from a multidimensional assignment problem (MAP) perspective (Pérez-Pérez, 2017).
2. Methodology
The social service program taken as case study, is developed in Mexico City, whose 1,495 km2 surface is divided into sixteen municipalities, each one with a variable number of districts. The main inputs of the program are concentrated in two different populations: students from ten careers with the requirements to join a social service program and are interested in supporting MSMEs, and the MSMEs with the administrative requirements of the program interested in receiving support from university students. Both groups suffer changes every six months due to the duration of the program, restarting the search, evaluation, selection, and allocation procedures due to a non-continuity policy. Correspondingly, a fluctuation in the arrival rate, with different characteristics is expected, further increasing the complexity of a stable allocation structure between the two groups. To increase the arrival rate and promote the stay of the students, the program offers an economic remuneration to cover their transport and alimentation costs.
Given an arrival rate of companies and students with different characteristics, some previous procedures must be met before the start of the allocation problem, defined by the politics of the institution. These procedures describe the process that the personnel and the companies enter the program. Due to the connection between the intermediary institution and a government entity, which seeks to promote the link between students and the work market, there are two classifications for companies, those who are pre-evaluated by the government entity and receive public funding, have direct pass to the allocation problem, while those who access the program by reaching the intermediary institution, require to be interviewed and investigated to define their needs and viability. If the maximum quota is reached, they could stay in hold until the next period. On the other hand, the institution directly receives the students that are willing to carry out their social service by giving consultancies to companies, interviewing them to obtain their data and information regarding their skills, abilities, and areas of interest.
Since the program is coordinated only by two people, they use a passive search, launching an announcement in the university press and social media one month before the beginning of the interviews, limiting the access to eight vacancies of each of the ten accepted careers. The process of interviews is limited to two weeks, where the students are asked about their data, professional or academic development, their preference of origin point of location (University or home address) and schedule availability. The MSMEs are asked about their general data, location, schedule availability and from 2 to 5 objectives they seek to resolve with the support of the students. During the process of interviews, the coordination must investigate and validate the information from both sources.
The schedule availability is classified into three categories: Morning shift, with availability from 08:00 to 13:00 hrs., the afternoon shift, from 13:00 to 18:00 hrs., and the mixed shift with complete availability.
Once the data is taken and evaluated, one week is scheduled to create the five-student teams and three-companies’ groups. This is due to the program politics, where teams must have a maximum of five students from different careers to aid MSMEs with similar requirements. In the case of missing students or MSMEs, the creation of teams with a minimum of three students and groups of two MSMEs is allowed. In case that the demand for careers cannot be satisfied by the selected offer, the repetition of careers into the same team is also allowed. Due to the program budget, the expected and maximum quantity of students and MSMEs to be accepted is 50 and 30 respectively.
As soon as both parts meet, they are given a month to create a work schedule to solve the company’s objectives. If there’s not an adequate coupling between the parties, a process of reformation of groups starts, and if there is not a reformation possibility, the entry of other interviewed or awaiting members is evaluated.
In a first stance, without the existence of any official procedure documents or standardized methodology, it was required to run a diagnostic and evaluation of the followed process of the program coordinator. Due to the inexistence of a standardized methodology, these simplified diagrams were created to explain the allocation process. The first developed diagram shown in Figure 1 illustrates the general process of the program, in which two main inputs (students and companies), go through the process of interviews and information verification, acquiring a list of attributes from each one, which are used later by the selection process to determine the participants of the program and those who shall stay in hold, to later create the student’s multidisciplinary teams and groups of MSMEs.

Since the search, interview and validation process is parallel for both the students and MSMEs, the requests are generated at the same time as the evaluation, which, without the existence of historic information, high rotation, and fluctuation of the requirements did not make possible the modulation of offer based on demand.
The main objective of the program coordinator is to completely satisfy the requirements of the MSMEs without damaging the academic development of the students. To achieve this goal, the activities of the students are limited to weekly reunions in the offices or location of their assigned MSMEs to ensure the creation of diagnostics based on directly observed activities.
In a period sample, it was found that the allocation generated a total unidirectional Euclidean distance between all students and MSMEs of 1,645.9 km, which are translated to an average of 48.41 km per student every week or 1,161.81 km per student at the end of the program. For the students, to visit each MSMEs under these conditions, difficulted the accomplishments of their objectives due to the time lost on public transportation services. The same sample only reached a career coincidence of 48.57% and a schedule coincidence of 68.57% considering the mixed shift could apply to any shift for both groups. After some interviews with some of the students, it was determined that these three relations between attributes were the main causes that generated absences and in consequence the desertion from the program. Creating the need of a methodology capable of balancing and evaluating the combinatory problem generated by the location, career, and schedule attributes from both populations. Due to the limitation of personnel and budget of the coordination, it was preferred not to use complex allocation models nor the use of commercial systems.
As shown in Figure 2, the process starts with the manual input of attributes to a list generated during the interviews, where only the career attribute is taken into consideration, dividing the students into ten different lists representative of the careers accepted by the program, taking one random element at a time to create the five-member team from different lists. While the lists of students are not emptied, the team generation procedure will continue. If the quota is not met, then an incomplete team is generated with the remain unassigned students. Meanwhile, the MSMEs group generation procedure is followed as shown in Figure 3, taking extracted data from the interviews to create a list of attributes, from which, the companies’ objectives are converted into career attributes to facilitate the relation comprehension between both sets and themselves. Once the transformation is over, career attributes are extracted from the list, an identifier is set to every MSME and reordered by grades of similarity, to later select the first three elements from the list and generate the groups of MSMEs. While the list of companies is not empty, the group generation procedure will continue to identify and reorder the list. If the quota is not met, then an incomplete group is generated with the remain unassigned MSMEs.


As shown in Figure 4, once the creation of both sets is completed, the allocation procedure begins, qualifying the similarities found between both teams and groups and categorizing them into three possible cases:
Non-coincidental relation: Initial state of all connections, staying in halt until all relations have been evaluated.
Preferential relation: Identified as the connection with the higher number of similarities of the evaluated team/group. It stays in halt until all relationships have been evaluated.
Permanent relation: Once the evaluation is terminated, it’s been identified as an identic element or the higher number of similarities between both sets.
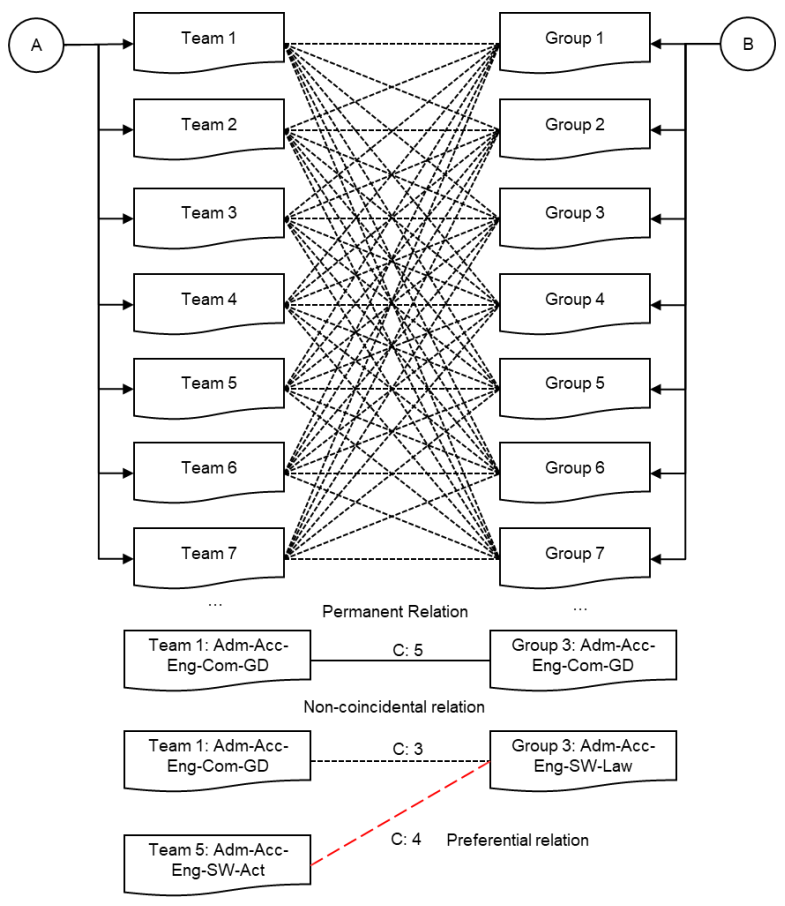
The categorization process is repeated iteratively until all connections are permanent. In case that some non-coincidental relations have low similarity grade, the teams are divided, and the members reassigned into new teams accordingly to the group’s requests, as shown in Figure 5.

These examples consider the perfect group presumptions, which means that every MSMEs that conforms a group has the same objective as the others. But due to the ten-career consideration there’s a worst-case scenario where a group may have up to ten different careers requests, creating a false high similarity grade. To avoid the confusion that such case might create, groups are ordered and marked, following an ordered categorization process, leaving them as the last assignment.
The first approach under these conditions, was the application of common allocation models and algorithms, but their need for a balanced problem and one variable condition could not satisfy the development of a structure capable of defining an allocation without increasing the original complexity of the problem. In such cases, its commonly recommended to use some methodologies applied to multi-criterion decision problem, allowing the qualification or simplification of multiple characteristics into a single digit, making the data processing and solution search easier due to the reduction of the combinatory complexity of the evaluated factors, but even so, their structure was commonly rigid, making the application into a set of dynamic data inadequate. The application of a computerized linear programming model considering the three attributes together or separated, to later define the allocation via similarity grades or heuristic methodologies was also discarded due to its computational and structural complexity as well as the perceived complexity from the users. The Hungarian method (Kuhn, 1955) was also considered as a possible solution to reduce the processing time and the complexity by weighting the variables and transforming them into cost while applying penalties for unreasonable assignments, but it was soon discarded as the weighting, and general application of the methodology required constant revisions and was classified as an impractical solution. Some other algorithms and methodologies from other areas were evaluated, such as weighted values, decomposition of zones strategies, cost equilibrium, gravity models, and the use of tools such as geographic information systems (GIS). Although it was possible to simplify the allocation by these means, none of the methods was able to consider the different attributes, mainly due to the characteristics of rotation, inflexibility to dynamic data, incompatibility and complexity associated with the data administration and repetition related with the time set and procedures of the problem. Even further the modification of the analyzed methods to adapt them resulted in greater complexity for the final user. Other methods were developed to create flexible structures with the objective of time reduction and simplification of the problem, mainly focused on graphic methodologies. A further explanation of these methodologies can be found in (Rios Esparza & Alonso Ventura, 2016). Some of these methodologies were evaluated under a proposed simple comparison made by the authors, to check whether the solutions met the proposed objectives, using four classifications (3: Adequate, 2: Attainable/acceptable, 1: Inadequate, and 0: Counterproductive) to qualify nine desired characteristics of the system:
Capacity. The method can process the required amount of data (number of companies and students).
Scheduling. The method can relate similar schedules from both groups and individuals.
Skill check. The method can relate similar skills requirements from companies to acquired skills from individuals.
Distance. The system can evaluate distance between two or more points.
Accessibility. The system can evaluate accessibility (transport capacity, routes, etc.) between two or more points by itself
Repeatability. The method can easily recalculate a new iteration.
Data input. The method is easy to prepare and understand from a user perspective.
Interface. The results shown by the method are easy to understand from the user perspective.
Time. The required time to program the system.
The first and the second methodologies shown in Table 1 are the commonly used linear programming and the Hungarian method, while from the third to the eighth are methodologies developed by the authors and ordered by development time.
Table 1 Linear programming, Hungarian method, and some graphic and data-based methods1 qualifications.
| I | II | III | IV | V | VI | VII | VIII | |
|---|---|---|---|---|---|---|---|---|
| 1 | 2 | 2 | 2 | 2 | 3 | 3 | 3 | 3 |
| 2 | 2 | 1 | 3 | 2 | 1 | 2 | 2 | 2 |
| 3 | 2 | 1 | 3 | 2 | 1 | 2 | 2 | 2 |
| 4 | 1 | 1 | 2 | 2 | 2 | 3 | 3 | 3 |
| 5 | 1 | 1 | 1 | 1 | 1 | 3 | 3 | 3 |
| 6 | 0 | 0 | 1 | 1 | 3 | 3 | 3 | 3 |
| 7 | 0 | 0 | 1 | 1 | 1 | 3 | 3 | 3 |
| 8 | 0 | 1 | 2 | 1 | 1 | 1 | 2 | 2 |
| 9 | 0 | 1 | 1 | 1 | 1 | 0 | 0 | 1 |
The evaluations and results shown in Table 1, allowed the creation of an even wider vision of the original problem, constructing each new methodology iteration with characteristics from previous iterations, ending with the hexagonal tessellation methodology.
2.1. Hexagonal Tessellation Methodology
As part of the multi-attribute improvement, a hexagonal tessellation was implemented to solve the distance and location problem. From the analysis of the previous methodologies, two sets were observed: the data-centered and the graph proposals. Under considerations of the management of repetitive use with different conditions, new database structures were added to facilitate the calculation of distance and accessibility, which allowed the management of other criteria under an associated simple coding system.
The basis of this proposed methodology is the construction of a database on top of physical space, in this case, represented by Mexico City. Since the location attribute is directly associated with the political division of the city, data from the 16 municipalities and 1,568 districts were extracted to analyze the possibility of using their characteristics as a pivot to generate automatized measurements of Euclidian distances between elements. However, during the analysis it was observed that different official databases contained different names to the same district, the areas were asymmetric and there wasn’t any kind of pattern that may facilitate the creation of such system. So, a new database with symmetric figures was created, to evenly divide the city. In this regard, only three regular geometric figures could cover a plane leaving no spaces between them: Triangles, squares, and hexagons, being the last one the most convenient way to cover the plane due to its similarity to a circumference, thus allowing the evaluation of an area of semiregular distances by each territorial division in cells.
Once the territorial division database associated with the tessellation was developed, the construction of networks with qualified relations by one variable was evaluated. Since unit positioning of elements was no longer required, a code associated with each element in the student and MSMEs specific attribute chain was generated, which, chained to the location attribute, directly associate its chain to their corresponding cell. Under a network vision, sub sizing the territory evenly causes multiple elements to be stored within larger elements, creating a sort of supernodes, greatly simplifying the distance and attribute evaluation needed for the allocation.
Since the formation of three attribute-based independent networks and two populations were distinguished during the assessment of the allocation problem, four levels of tessellation were created, two of them associated with the career and location attributes of MSMEs and the two remaining to student’s attributes, considering the schedule attribute as a connection access, that is, if it was determined that the schedule was coincident between any pair of elements, a relationship was generated based on the level attribute. While for career attribute a different procedure was launched accordingly to the type of assignment being made, like those shown for the assignment in the test methodology. Within the graph theory, the observed bipartite networks undergo a modification due to the reduction of the search space, facilitating the allocation. Graphically, this process is shown in Figure 6, where the convergence of locations in the center of each cell allows the simplification of the distance calculation, to then generate the networks associated with the chain-code and finally perform a matching evaluation between the different levels associated with the occupied cells and thereby define the mapping.

This concludes with a hexagonal tessellation allocation methodology (HTAM) by containing and unifying information in symmetrical geometric figures facilitating the management of information and being capable of supporting repetitive sets of allocation. The application of this data structure to the problem achieved the reduction of distance by 294.3 kilometers, the non-coincidence between staff profiles from 54 to 4, eliminated the deficient schedule assignments and reduced the time dedicated to the allocation problem from 5 days to 90 minutes. From this point, a simulation model was created to determine the capacity and resilience of the designed structure, by creating different scenarios with the modification of the selected criteria to define its usual behavior and its solution threshold. However, during the programming and test of the simulation, improvements were generated in different modules contained within the methodology, mainly on the allocation and the groups’ assignment procedures, including the creation of a module capable of defining preferences in the attribute evaluations.
The initial simulation was developed to mimic the general logic behind the coordination allocation methodology which later was transformed into the test methodology that made possible a comparison of results between a one attribute allocation method and the proposal of allocation based on hexagonal tessellation.
2.2. Test Methodology
The main objective of the test methodology is to be a comparison element capable of creating a series of repetitive evaluations over its one attribute evaluation structure. Its creation was made after the main project was terminated so subsequently some of its modules are influenced by the proposed hexagonal methodology.
The test methodology was programmed with the generation of potential populations. Due to the absence of historic information of the program, the student population was generated from statistical data of the number of entries to the careers in the university included in the program by using web content mining. From the detection of patterns, 2,421 lines of statistical data were extracted related to the last 17 years of admission to the various careers offered by the university and accepted by the program. By analyzing the extracted data and applying it to be considered as inputs, distributions for each career were created and fed to the program. Using the same tool, to represent the behavior and requirements of companies, samples of consultancies job requests in Mexico City were taken from multiple job boards, extracting 2,843 lines of data from 395 jobs announced by 216 different companies whose job descriptions were converted into the accepted careers. From the extracted data, it was detected that unlike the various attention schedules of the program, the most common request was the mixed shift, which reduced the search space. By applying the created diagrams from the original process, the test methodology was created to simulate the selection and allocation of personnel and represented in a series of new procedures. As shown in Figure 7, the system is fed by the associated distributions determined by the data extracted to create a student population limited to 1,000, to ensure that the selection has enough space to take a non-repetitive random sample, simulating the interviews process. The data is extracted in multiples of 5 to ensure the creation of teams. Such elements already include information on the three attributes considered by the problem, creating a list with the selected elements, giving each one an ID and a “free” label.

Due to the inexistence of any team, the team counter (t) is set to one and a first team is created in a list of teams (LT) by selecting a random element from LS to later deposit the extracted element into LT adding a team-member (t-m) label generated by the counters to its ID. Once the information is emptied, the member counter (m) is set to add another member. If the member counter is lower than six then the system will extract the IDs and career attribute from every member and stock the data in a temporal space, to later actualize the “free” label on LS with the member’s ID to an “occupied” label. After the label actualization, the system will identify the next “free” element in LS and determine if the career attribute is repeated trough the stocked member information. If there is a repetition, it will identify the next free element from LS until it finds a different career. Once located, it will extract its ID and attribute to set it into LT with a t-m label. As soon as the member counter reaches its maximum, it will add one unit to the team counter. While the team counter doesn’t reach its maximum (determined by the N extracted elements divided by the maximum member counter), it will restart the member counter, find a new non-occupied random student of LS, and restart the member assignment procedure. If the team counter reaches its maximum, it will detonate the last team procedure, which will restart the member counter, extract a non-occupied random student from LS, set it into LT with a t-m label, add one to the member counter, identify the next “free” label in LS and set it into LT with no confirmation of the career attribute.
The last team procedure will repeat until every element from LS is set to “occupied”. As seen with a comparison between Figure 2 and Figure 7, both the test and coordination methodology follow similar logical structures to the assignment problem of students, having the same flaw: they are heavily dependent on the order of which the students are sent into the lists by identifying the next divergent element in the same order.
Figure 8 shows the followed procedure for the generation of MSMEs groups. Similar to the team generator, the extracted database feed the system with the required attributes to create an MSMEs population (limited to 400), from which a non-repetitive selection is made and set into a list of MSMEs (LE) in multiples of 3 to ensure the condition of the maximum number of members. To accommodate a convergent assignment, the MSMEs are evaluated in an affinity matrix based on the career attribute, analyzing every pair of selected elements to later reorder the list by affinity grade (AO) for every MSMEs, giving each one an ID and a “free” label.

Due to the inexistence of any group, the group counter (g) is set to one and a first group is created in a list of groups (LG), by selecting the first element from LE to later deposit the extracted element into LG adding a group-member (g-i) label generated by the counters. After the first member is set, the member counter (i) adds another element. While the member counter is lower than 4, the system extracts the ID from the first member and actualize LE with occupied IDs. Then the system evaluates the highest affinity with the first member and identifies if it is occupied. If it is “free”, the ID is extracted and added as the next member. If it is occupied, the system will evaluate the next element in the affinity order of the first member. While the affinity order doesn’t reach the tenth element, it will extract and identify the label to determine if it can be emptied in LG or if the next element in the affinity order is evaluated. If there are no affinity grades left, the system will create an empty set and apply it to LG with the g-i label. Once the member counter reaches its maximum, the group counter will add another digit. While the group counter doesn’t reach its maximum (determined by the M extracted elements divided by the maximum member counter), the system will restart the member counter and extract a non-occupied random element from LE, set a g-i label and continue with the affinity check procedure. If the group counter reaches its maximum, it will detonate the last group procedure, which sets the member counter to one, extract the information of a non-occupied random element, empty the information in LG, seek the next member from the non-occupied elements from LE without launching the affinity check procedure and continue until all elements of LE are occupied. Due to the creation of empty sets, the last group procedure may create a team that exceeds the maximum members, in which case, an additional rectification procedure begins to accommodate the remaining members in the empty sets.
Once both groups and teams’ procedures are terminated, the allocation procedure begins as shown in Figure 9, evaluating the career attributes, and creating a new affinity matrix between every pair of teams and groups, reordering the list by affinity grade for each MSMEs group.

The perfect affinity evaluation determines if the number of requested careers from the MSMEs group is lower or equal to five and the associated highest affinity team have equal career attributes, in which case, it is determined as a permanent relation, extracting the IDs from both groups and teams, to later be emptied into the allocation list (A). If there are no perfect affinity relations left, then the system evaluates if all elements of LT and LG are occupied. If they are not, then it will identify the team with the highest affinity to the group using the affinity check procedure, extract and empty their IDs into A. On the contrary, it will terminate the procedure.
Based on the procedures from both the coordination and test methodologies it can be observed that they don’t consider the attributes from both sets until the allocation procedure due to the complexity of analyzing every individual relation, making the procedures highly dependable on the arrival rate.
3. Results
The simulation was applied to the original case and three different cases with ten repetitions, obeying the original structure of the problem.
Taking the attributes associated with the original data, the responses of the proposed methodologies were evaluated as shown in Table 2, of which, the methodology carried out by the coordination contained the worst values associated with the three attributes, which were improved by HTAM, decreasing the total distance by 294 km and consequently the average travel per member at the end of the program decreased from 1,161.8 km to 954.09 km for that period.
Table 2 Results from the original problem.
| Methodology | Distance (km) | Matching Schedules (%) | Matching Career (%) |
|---|---|---|---|
| Coordination | 1,645.90 | 68.57 | 48.57 |
| HTAM | 1,351.62 | 100 | 96.19 |
| Test | 1,300.13 | 78.10 | 94.29 |
| R. Test | 1,383.16 | 82.85 | 71.43 |
| HTAM v2 | 1,060.98 | 94.29 | 85.71 |
As the schedule attribute was established as connection access in HTAM, the totality of schedules matched. However, the test methodology, despite not considering the location attribute, reached a better result over distances compared to the HTAM with a lower matching of schedules and careers. Nevertheless, randomly reordering the elements in the students’ list (R. Test), increased the distance and lowered the matching career relation. In contrast, the HTAM system with improved modules and a preferential ratio over distance (HTAM v2), decreased the average distance per member at the end of the program to 748.93 km, while it reduced 6% and 10% of the other matching attributes compared to the original model.
Given the absence of historical data and the modification of the original system to adapt to the simulation, only the test methodology against HTAM with improved modules will be evaluated, both being fed by the same data series belonging to the evaluated scenario.
The first simulated case was carried out with ten random series of a ratio of 50 students and 30 companies, under the same conditions of team and group creation from the original problem. As Figure 10 shows, based on the results presented by HTAM, a minimum distance of 1.90 km was obtained in scenario 3 with an associated difference in the career attribute of -3.65%, which means, the test methodology exceeds HTAM in career matching in that scenario.

Within the same case, a maximum difference of 478.92 km appears in scenario 6 with a 14% difference of the career attribute between methodologies, favoring HTAM. The schedule attribute, given the source of the mixed shift preference data, got values close to 100% for both methodologies with a maximum difference between them of 1.5%
Given the existence of a difference related to the non-coincidental offer and demand relation in the career attributes, the data presented an associated error, limiting the maximum matches that any method could reach, making them susceptible to a disparity fit, presented in the career attribute graph. Given the characteristics of the data with the schedule attribute, a disparity fit on the schedule results wasn’t considered necessary.
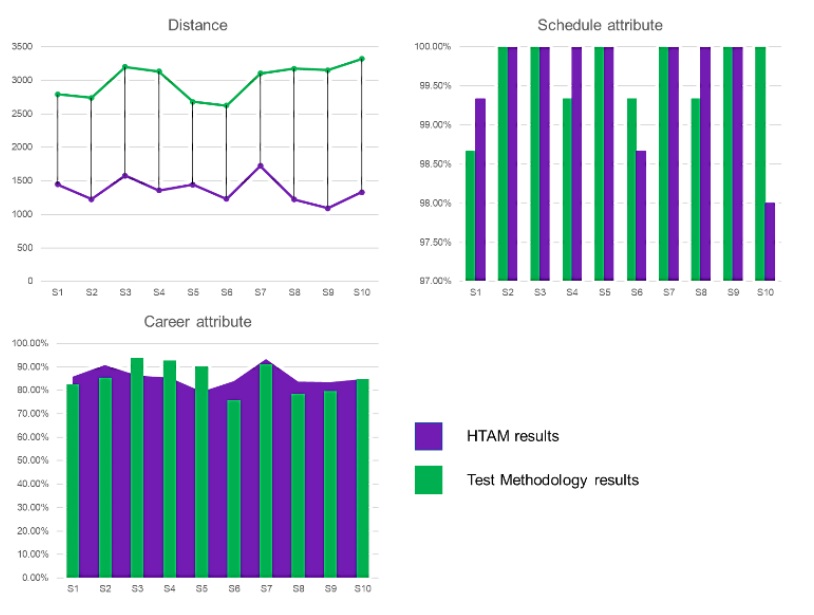
The second case showed in Figure 11 doubles the values associated with both populations to a ratio of 100 students and 60 companies, to determine whether the systems presented errors by processing larger amounts of data or if its design was limited to the original defined quantities. In this sense, both systems could process the volume of information, thereby increasing the differences in attributes between them. Within this sequence of scenarios, a minimum difference of 319.51 km was presented with 13.3% associated with the career attribute, and a maximum of 4,178.83 km with a difference of 19.07% in the career attribute. In all scenarios presented in this case, HTAM was better in terms of distances and career matching, although some scenarios presented the test methodology with a small superior margin in the schedule attribute.
Within this simulation sequence, scenario 1 showed a considerable difference between methodologies, but from a further analysis, it was determined that the scenario exploited the weakness of the test methodology, and in consequence of the coordination methodology, creating lists with attributes whose order significantly increased the associated distance and career-matching attribute.
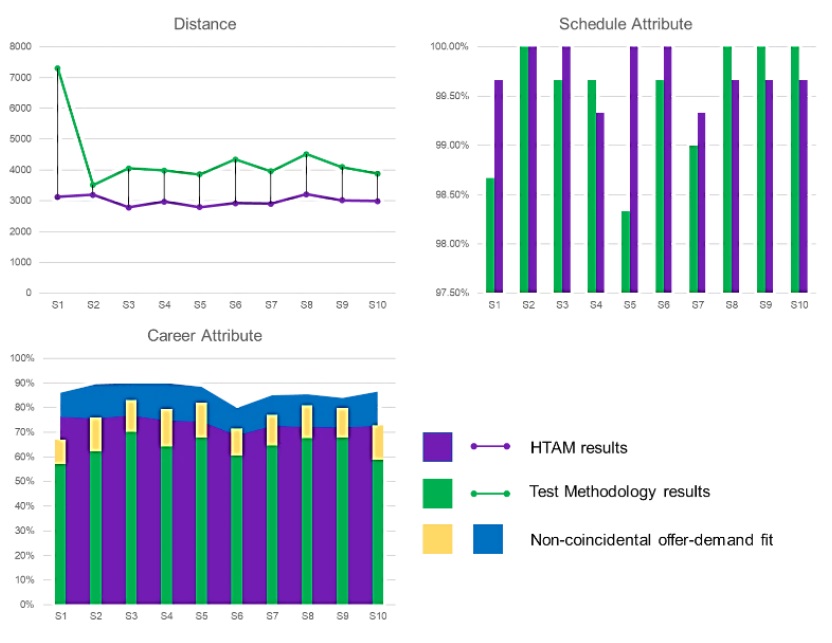
The third case, considered the existence of the disparity fit and to evaluate the searchability of the systems in unbalanced spaces as an open offer, generating 150 students and 30 companies, maintaining the five-member team structure with three companies’ consideration, thereby increasing the possibility of finding elements with matching attributes, as the allocation was not reduced to a closed one-to-one relationship.
As shown in Figure 12 , this set of simulations presented the largest average differences in distance, with a minimum of 1,236.13 km and a maximum of 2,061.26 km, with a difference in career matching of -10.78% and 3.88% correspondingly. From the analysis of this case, in conjunction with the results of the original problem, it can be seen the impact of the priority variation of a specific attribute to the different methodologies.
4. Conclusions
This paper solved a real assignment problem. We began by describing the assignment problem from a historic perspective to later go through some of its variations and solution methods. Later, we delved into the human resources selection, recruitment and assignment problem and presented some solution approaches made from different perspectives. Next, we explained the case study and how we developed our proposed methodology from the data analysis perspective while analyzing other commonly used methodologies.
The results demonstrate that the tessellation methodology applied to solve the distance problem within a computational system creates a flexible method, capable of identifying and managing different levels of information and addressing increased rotation generated by constant changes, without increasing the perceived complexity for the final user. Although in first stance is difficult to develop a computerized mapping due to the multiple search spaces associated with the information, a modular construction allows the creation of multiple procedures that can be applied to the general structure, making it easier to apply them to other problem formats with different algorithms or allocation politics within the same space by removing or improving modules at convenience. Given the development, it is established that it is not required a highly specialized or expensive infrastructure to generate a good allocation.
Although the case presented has specific characteristics and passes through different problems, we consider it can be applied in different domains and reveals some potential future research opportunities. In this sense, we also agree with other authors that while problems continue to evolve, the solutions should too, not only as a matter of a certain branch of investigation but as an analysis of reality and the challenges it presents.

