


 nueva página del texto (beta)
 Inglés (pdf)
 Artículo en XML
 Referencias del artículo
 Enviar artículo por email
 Citado por SciELO
  Similares en
SciELO
Similares en
SciELO 
 Permalink
1. Introduction
Dual-Phase (DP) steels are the first family of automotive sheet steels that involves phase transformation in their manufacture (Fonstein, 2017). These steels are low-alloy low-carbon steel with hard particles (martensite phase) immersed in a soft matrix (ferrite phase). This combination gives these steels high strength and strain rate, good formability, and ductility (Amirmaleki et al., 2016; Jiang et al., 1995; Patel et al., 2019). The interest in characterizing and predicting the mechanical behavior of this kind of steel has been increasing rapidly over the last two decades (Tasan et al., 2015). Numerical simulations have been selected as an economical and complete way to understand DP steels' behavior deeply.
Uses of numerical simulations to characterize the mechanical behavior of DP steels are focused on macromodeling, micromacro transitions, and micromodeling (Tasan et al., 2015). Recently, the use of micromodeling has shown the capability of predicting the mechanical behavior of whole steel using different Representative Element Volumes (RVEs) as a representation of the whole microstructure (Asim et al., 2019; Hou et al., 2019; Huang et al., 2016; Ramazani, Schwedt et al., 2013; Zhou et al., 2015). There are two types of RVEs: realistic, if it is based on micrograph images, computed tomography, and others that are converted to a numerical mesh (Zhou et al., 2015), or artificial if it is produced using statistical data that characterize grain size and morphology of each phase (Hou et al., 2019).
Artificial RVEs are advantageous compared to realistic RVEs because the grain distribution, phases volume fraction, and grain size can be easily modified (Hou et al., 2019). In artificial RVEs, there are a lot of mechanical testing methods implemented to evaluate the mechanical response like tension, compression, torsion, or fatigue. These tests are the most commonly used throughout recent research (Anbarlooie et al., 2019; Basantia et al., 2021; Chiyatan & Uthaisangsuk, 2020; Hou et al., 2019; Li et al., 2019; Moeini et al., 2018; Moeini, Ramazani, Myslicki et al., 2017; Qin et al., 2020; Qin et al., 2018). In those simulations, using the correct combination of boundary conditions and constitutive equations allows approximating the macroscale behavior of the whole material.
Nanoindentation and microindentation tests have been used as a methodology to measure the hardness and the elastic modulus, as well as elastic modulus degradation (Tasan et al., 2008), and studies are focused on the force effect in the indentation zone (Petrík et al., 2018). The indentation methodology is used to characterize the mechanical behavior of each phase in DP steel simulations by validating the nanoindentation curve to the numerical results (Tasan et al., 2008). Despite the advances in simulations models to evaluate the damage on DP steels, such as crystal plasticity, visco-plastic self-consistent model, molecular dynamics, and other advanced models, few studies focused on the effect of the proximity of the hard phases of DP steels to the microindentation test zone. Studies focused on the effect of hard particles immersed in a soft phase subjected to indentation tests are commonly carried out on polymers, ceramics, or foams (Chen et al., 2016; Shen & Guo, 2001; Tseng & Wang, 2004). DP steels' high strength and ductility properties make them attractive to evaluate the microindentation behavior when hard particles are immersed in the soft phase.
These indentation simulations use different approximations. One of these approximations uses an axisymmetric RVE that has a single hard particle immersed in a soft matrix cell (Cao et al., 2016; Durst et al., 2004; Gibson, 2014; Low et al., 2015; Yuan et al., 2014). The test carried out is the indentation of the hard particle or the indentation on the soft matrix with the hard particle existing close to the indenter. Using these tests, the researchers compare the behavior and understand the effect of the particle position. This kind of approximation ignores the existence of other particles, their distribution in a real material, and its effect on the work-hardened area below the indentation surface (Madhusudan et al., 2016).
Other approximations to the indentation of materials with hard particles distribution were tested using a distribution of particles with a structured arrangement (Apalak et al., 2009; Gibson, 2014; Karimzadeh et al., 2019; Shen & Guo, 2001), or homogenized domains (Chen et al., 2016; Shen & Guo, 2001) immersed in the soft phase. In those simulations, the measure or quantification of the hard particle amount is the volumetric fraction of the whole hard phase immersed in the RVE. However, the focus shown in these studies changed the hard phase volumetric fraction in the RVE by including more particles or making them bigger and observing how it affects the mechanical behavior (Apalak et al., 2009; Gibson, 2014; Shen & Guo, 2001; Shen et al., 2001). These approximations require the strictly structured arrangement of the matrix particles as the only factor that modifies the mechanical behavior, but it is not completely precise like real steel.
The metallic materials are different from human-made composites because the hard particles may not appear in strictly structured positions or arrangements, and the grains in steel appear in an aleatory way with different sizes and forms. Additionally, the distribution of grains immersed in a metallic material as a DP steel has been characterized in probabilistic distributions like log-normal distribution, and it is widely used for generating RVEs for these materials (Benedetti & Barbe, 2013). These probabilistic characteristics and phases of mechanical heterogeneity become interesting factors in evaluating the response load curve in a microindentation simulation, where the hard particles are notable, near, or distant from the indenter in a measuring factor that allows studying how the material is affected by the immersed hard particles distributed randomly in the RVE.
The paper investigates the mechanical indentation response curve of RVEs with hard martensite phase particles immersed in a soft ferrite phase matrix. These RVEs are subjected to microindentation simulations, and their effects on the load step curve were related to the proposed parameter, called the spherical radius shape variable. This parameter is proposed as an alternative to quantify the variation of the results caused by the existence of grains that are nearer or farther respect the indenter tip, and it differs from the volumetric fraction because the volumetric fraction cannot capture the closeness of particles at the indenter tip. Constitutive equations and curves were used for each phase to simulate the mechanical behavior of the selected artificial RVEs, then force and depth data, plastic deformation, and stress fields were selected as results. The RVE indentation load step results were related to the proposed spherical radius shape variable, while relative errors were calculated and graphically compared.
2. Materials and methods
The material used in this research was commercial steel DP600 with 3.4mm thickness. Metallographic preparation consisted of grinding and polishing up to 0.5 µm, followed by etching. Nital 3% reagent was used to reveal the microstructure of specimens, and the optical microscope Olympus LECO IA3 was used to take the micrographs. The method of Intercepts was used to quantify the average grain size of each phase. Each phase's segmentation and fraction area were obtained using the Imaging Procedure Processing Software, ImageJ (Schneider et al., 2012). Figure 1(a) presents a micrograph example of the DP steel microstructure, while Figure 1(b) shows the grain segmentation using ImageJ.
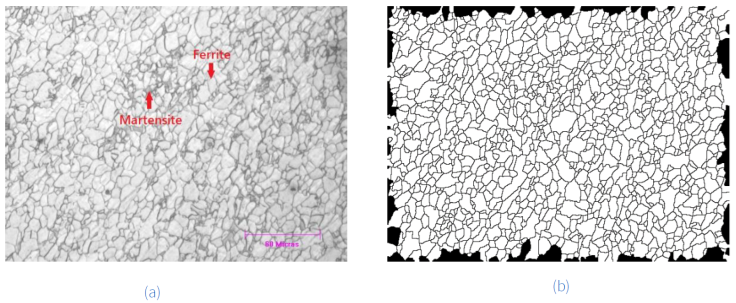
Figure 1 Optical micrographs of DP600: (a) original and (b) segmented on grain bounders using ImageJ.
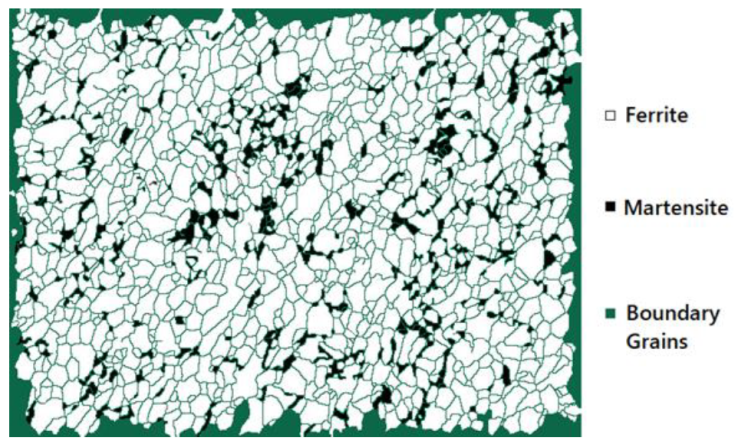
Figure 2 shows the assignment of black color to the hard phase grains, gray color to grain borders and partial grains in the border, and white color to the soft phase. These assignations were carried out by employing the GNU Image Manipulation Program, GIMP 2 (The GIMP Team, 2018). The individual grain areas and phases fraction were quantified using the color codes of each phase and applying the Threshold and Analyze Particles tools in ImageJ (Schneider et al., 2012).
Statistical data from the microstructure was acquired by measuring particle areas with ImageJ to make the RVEs (Schneider et al., 2012). These data were transformed into a log-norm probability distribution using Microsoft Excel. Later, it was entered in Dream.3D (Groeber & Jackson, 2014) to create an RVE, as shown in Figure 3(b). Two approximations of RVE were selected to minimize the computational costs: three-dimensional (3D) and axisymmetric. The 3D domain represents a quarter of one domain indented with Vickers indenter by using symmetry boundary conditions, while the axisymmetric domain represents a cylinder of material with a conical equivalent indenter. Both approximations use sizes of 50µm side. The microindentation schemas are presented in Figure 3(c). A new variable called “the spherical radius” is proposed to measure the indenter tip. This variable represents an equivalent distance where all hard particles in the RVE could be condensed. This representation is shown in Figure 3(d). The spherical radius shape variable calculation is shown later.
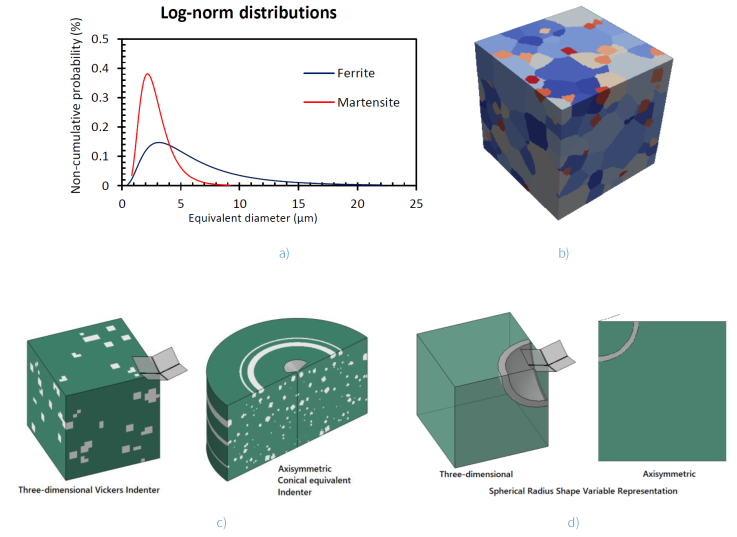
Figure 3 RVE generation: (a) Statistical distribution, (b) RVE generated by Dream-3D refined in the zone affected by the indenter penetration. (c) microindentation schema for three-dimensional and axisymmetric simulations. (d) spherical radius shape variable representation in the RVE.
Five RVEs were generated with the same volumetric fraction and log-norm probability distribution but random spatial grain distribution for each approximation. These domains were discretized using hexahedral eight-node elements C3D8R in the 3D case and four-node quad elements CAX4R in the axisymmetric case. Both cases were refined in the zone of contact with the indenter, as shown in Figure 4. The indenter was modeled as a rigid surface in both approximations: a quarter of Vickers for 3D approximation and a conical equivalent Vickers indenter in axisymmetric approximation. The hard particles have a randomly appearing behavior inside the domain without being controlled by the user and helped understand the effect of the particles distributed in the material more realistically.
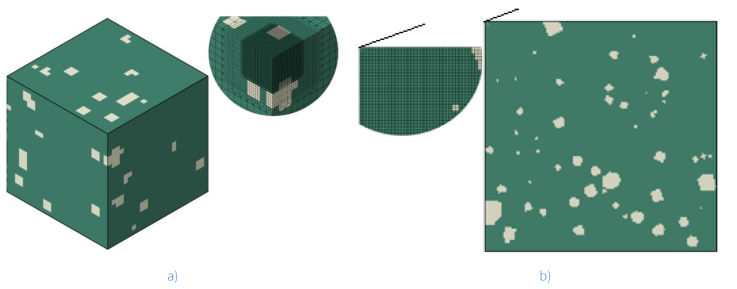
Figure 4 RVE and indenter used in the simulation: (a) meshed RVE with refined zone. (b) conical equivalent Vickers indenter with 0.35-micrometer radius.
The domains generated were exported to Abaqus/Standard and simulated using the von Mises yield function for the martensite phase and the Gurson-Tvergaard-Needleman (GTN) (Sirinakorn et al., 2014; Tvergaard, 1982) yield function for the ferrite phase (Equation 1). The GTN yield function includes the hydrostatic stress represented by p, deviatoric stress by q, and three dimensionless fit parameters q_1, q_2, q_3. The GTN yield function considers the growth and coalescence of microvoids when the material is tension loaded. However, if the material is compression loaded, this causes a densification by closing the existent voids and hardening the material (Chen et al., 2016). Table 1 presents the values for each of the GTN parameters. For the strain hardening behavior, the Rodriguez-Gutierrez (R-G) equation (Rodriguez & Gutiérrez, 2003) was implemented for each phase (Equation 2).
Table 1 Dimensionless Gurson-Tvergaard-Needleman GTN parameters from DP600.
| Parameter | Symbol | Value |
|---|---|---|
| Initial void fraction | f 0 | 0.0003 |
| Strain normal distribution | ε N | 0.1 |
| Void fraction normal distribution | f N | 0.018 |
| Stress normal distribution | S N | 0.2 |
| First Needleman parameter | q 1 | 1.2 |
| Second Needleman parameter | q 2 | 0.9 |
| Third Needleman parameter | q 3 | 1.44 |
Figure 5 shows the results of the equations for each phase using the parameter values presented in Table 2. For the R-G equation, α=0.33 is the constant dislocation interaction, M_T=3 is the Taylor’s factor, μ=80000 is the shear modulus, b=2.5×10^(-10) is the Burgers’ vector, κ_r is the respective phase recovery rate, L is the free dislocation medium path, Δσ is carbon precipitation hardening in the solution of each phase and σ_0 is the Peierls stress for each phase (Lai et al., 2016; Moeini, Ramazani, Sundararaghavan, & Koenke, 2017; Ormsuptave & Uthaisangsuk, 2017; Ramazani, Mukherjee, Quade et al., 2013; Ramazani, Mukherjee, Schwedt, et al., 2013; Ramazani, Schwedt, et al., 2013; Uthaisangsuk et al., 2011).
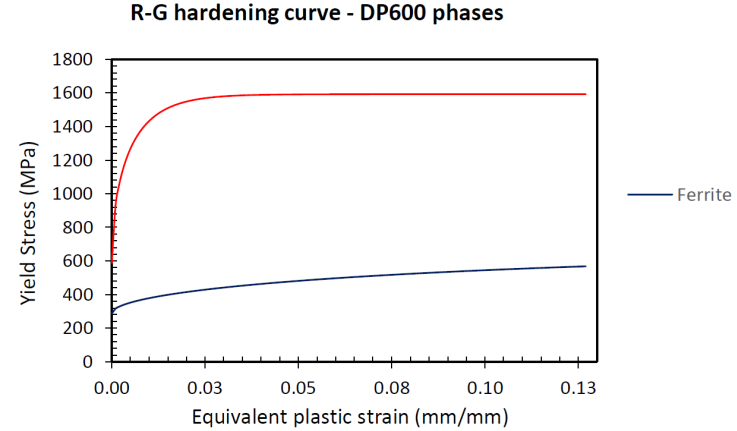
Table 2 Dimensionless Gurson-Tvergaard-Needleman GTN parameters from DP600.
| Parameter | Ferrite | Martensite |
|---|---|---|
| κ r (dimensionless) | 1.845018 | 41 |
| L (m) | 5.42x10⁻⁶ | 3.80x10⁻⁸ |
| Δ σ (MPa) | 35 | 235.46 |
| σ 0 (MPa) | 251.39 | 253.458 |
The solution method was selected as implicit with displacement control on the indenter and stopped at an indentation depth of 2µm. The load step was only simulated to evaluate the effect of the hard particles closer to the indenter in the load vs. the depth indentation curve. The plastic strain, von Mises stress, microvoid fraction fields, displacement, and reaction force were selected for all simulations.
The spherical radius shape variable was proposed to characterize the behavior of each
RVE separately. This parameter was calculated as the average value of all radii from
the indenter tip to each node identified with hard phase properties. This parameter
characterizes the closeness of hard particles to the indenter in the material. Equation 3 shows the formula used to
calculate the spherical radius, where
Table 3 and Table 4 present the results of the spherical radius for each of the five RVEs constructed for 3D and axisymmetric approximations, respectively.
Table 3 The spherical radius of the five 3D RVEs constructed in this research.
| RVE | S r (µm) |
|---|---|
| 3D 1 | 43.97 |
| 3D 2 | 17.19 |
| 3D 3 | 19.91 |
| 3D 4 | 13.53 |
| 3D 5 | 10.73 |
3. Results and discussion
Figure 6 and Figure 7 show the obtained indentation load-depth curves for 3D and axisymmetric simulations compared with the DP600 reference curve. The unload step was not simulated in this research. For this reason, the elastic modulus of the material was not calculated. The reference curve was taken from the experimental results reported by Song et al. (2012). 3D curves proved to have better precision than axisymmetric curves, concerning the experimental one. Figure 6 shows that the load at 2 µm in those simulations has similar behaviors and less variation than the experimental curve. The curve of RVE 3D 5 evidenced a similar behavior in the range 0 - 0,5 µm and presents a similar load to the reference curve at 2µm of indenter penetration. The axisymmetric cases can capture the tendency but lack precision, as observed in Figure 7.
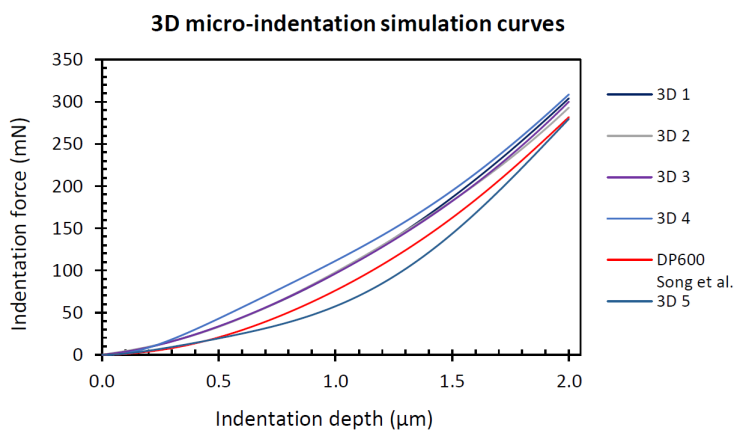
Figure 6 Indentation load versus depth curves for 3D RVEs indentations with respect to the experimental curve.
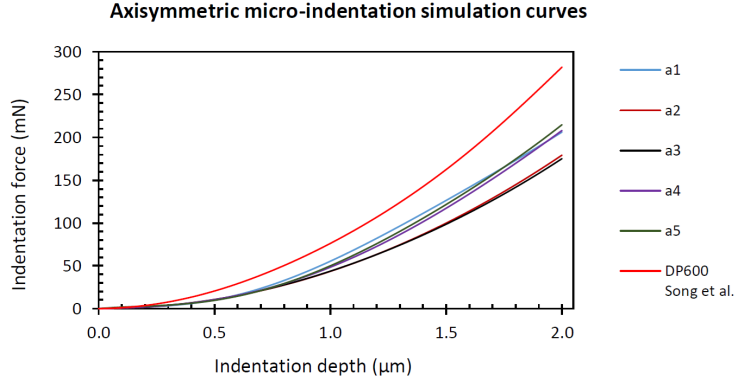
Figure 7 Indentation load versus depth curves for the axisymmetric RVEs indentation regarding the experimental curve obtained.
Figure 8 and Figure 9 present the obtained true stress vs. the true strain curve for microindentation on the three-dimensional and axisymmetric cases. These curves were obtained from the strain and stress fields of the first element in contact (corner element at the indenter tip), which indicates that these are nodal curves. The reference true stress-strain curve was taken from the experimental results reported by Santos et al. (2019) using a crosshead speed of 1mm/min. The axisymmetric approximation showed lower precision with respect to the reported experimental data, as it presented relative errors above 23%. In three-dimensional approximations, this RVE developed a better response curve and presented relative errors below 10%. Regarding the relative error, it is important to recall that the simulations had limitations that could affect the results due to simplification of boundary conditions, phenomenological ferrite and martensite yield function, and rigid indenter geometry.
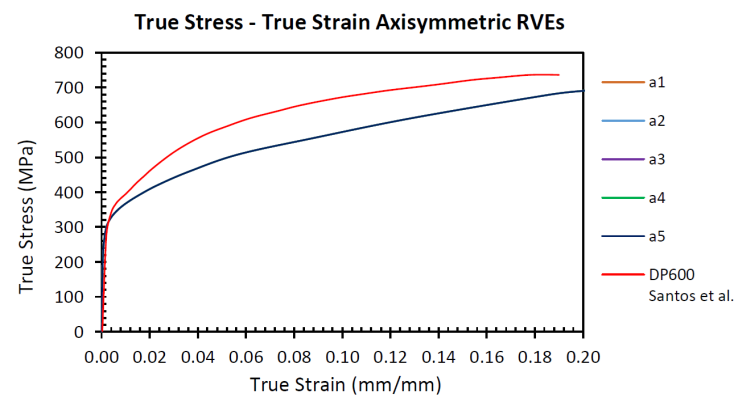
Figure 8 True stress vs. strain curve calculated in the corner contact element in axisymmetric simulations.
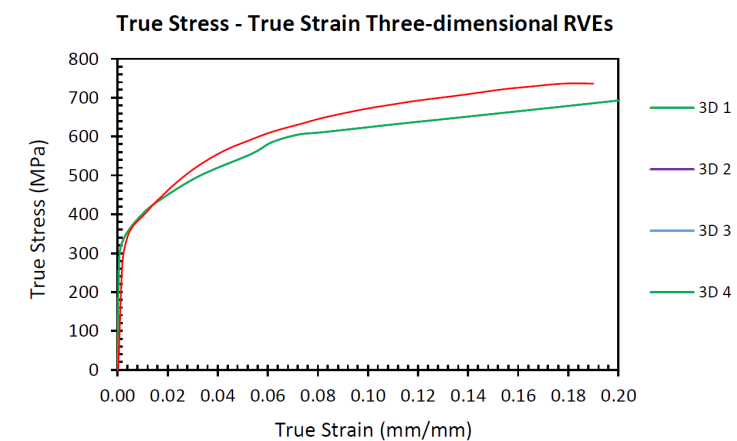
Figure 9 True stress vs. strain curve calculated in the corner contact element in Three-dimensional simulations.
Hardness Vickers (HV) values were determined for the three-dimensional RVEs because these cases have no geometric indenter simplification. The numerical hardness values were calculated from the projected area on the indenter load direction and its respective indentation load. The area was described by the nodes that are in contact with the indenter at this load point, as shown by Antunes et al. (2006) and restated by Simion et al. (2018) using the Vickers calculation diagonal as the extreme points of pile-up height in indentation simulation. The results of the hardness values calculated are shown in Figure 10.
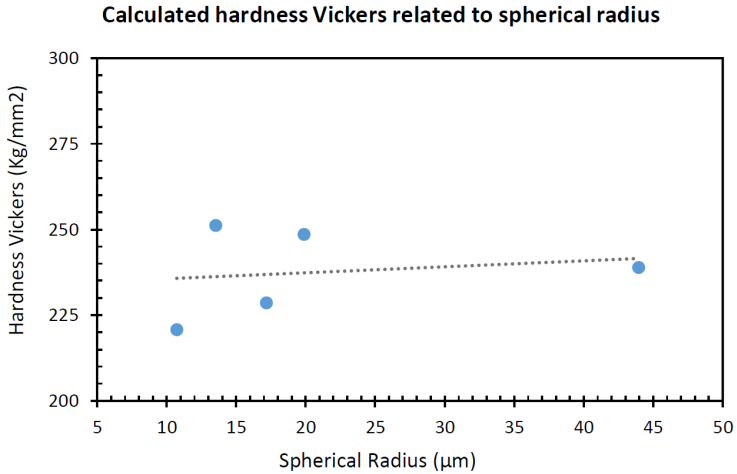
Figure 10 Calculated Hardness Vickers in the three-dimensional RVE using the projected area at the maximum load.
These results were compared with the reference 224HV value of DP600 reported by Ji et al. (2014). As shown in Figure 10, the calculated hardness values are consistent with the reference data but differ from the experimental value in approximately 27 HV or 12%. Despite the different spherical radius values in the RVEs, no correlation between the spherical radius and hardness value was observed.
All simulations presented an elastic-plastic behavior due to the observed tendency in the curves of Figures 6 and 7, as shown by Yuan et al. (2014). If a high volumetric fraction is present in the RVE, a lower indentation depth is achieved in the simulation (Apalak et al., 2009; Shen & Guo, 2001). For this reason, increasing the number of particles causes an effect of restricting the deformation of the material.
Figure 11 shows the stress and effective plastic strain fields, along with the distribution of the particles, from the top view for each 3D RVE. The existence of hard particles immersed causes a variation in the stress and effective plastic deformation fields, but those behaviors do not seem to be strictly dominated by the grains visible in the top view. In these images, the distribution of martensite hard particles in the domain causes an irregular distribution of plastic strain and von Mises stress fields.
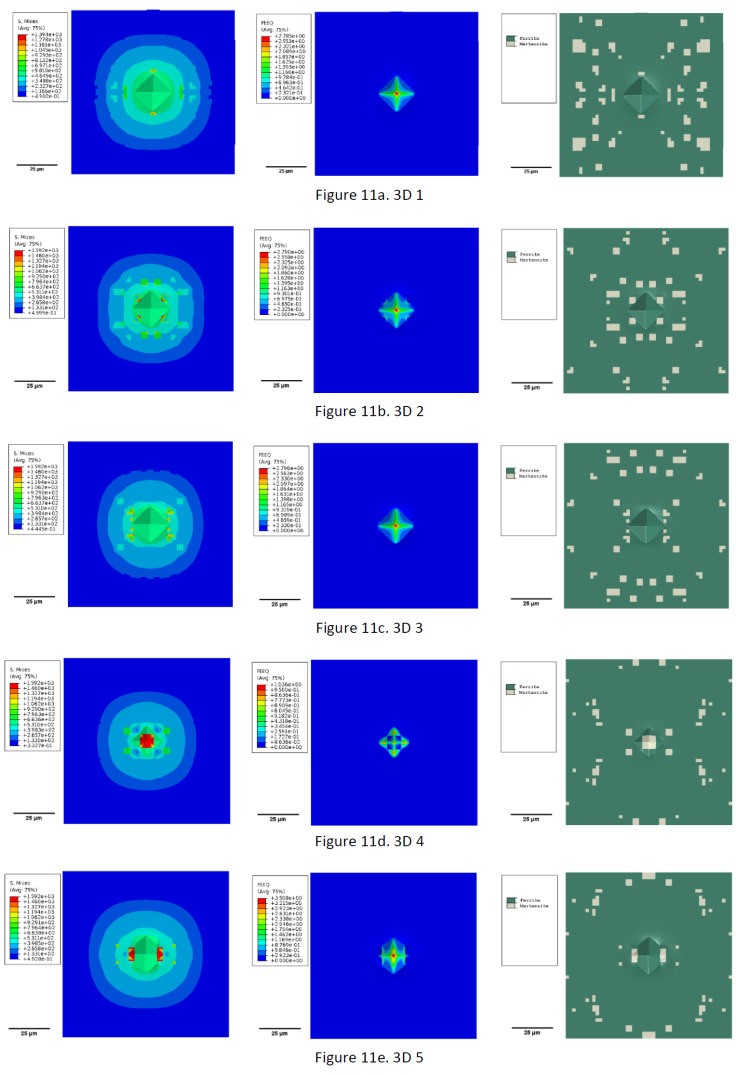
Figure 11 Von Mises stress and plastic equivalent strain field at the total indentation depth of all 3D RVEs in the top view.
In case 3D 5, Figure 11e shows high effective plastic strain values and that the strain field is constrained in a smaller zone than in the other cases. It seems that the hard particles immersed in the domain produce an effect that hinders the dissipation of the strain field. This characteristic cannot be observed superficially, as shown in Figures 11a to 11e.
The spherical radius appears to be a better quantification measure for these cases than a volumetric fraction because the latter does not consider the direct effect of the grains existing near the indenter. These hard phase grains affect the plastic deformation, and von Mises stress fields when the material is indented. Figure 11 shows that the visible distribution of grains in the top view could not explain the differences in the load-depth curves by itself.
Figure 12 shows the comparison of the stress fields of two RVEs at three indentation depths. Two representative cases were selected for the minimum and maximum spherical radius, case 3D 5 and 3D 1, respectively. The stress fields in these cases, at the same indentation depth, have significant differences. It is possible to observe that the grains below the surface have the effect of constraining the von Mises stress field and causing this asymmetry. Case 3D 1 does not present such an effect because the particles are not at the same proximity as case 3D 5, which is evident by its spherical radius.
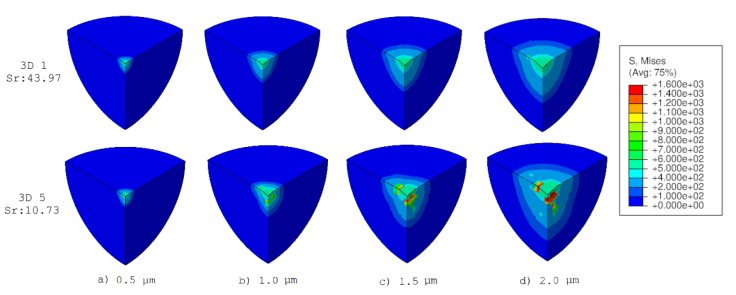
Figure 12 Comparison of the evolution of von Mises stress field of two 3D RVEs at three different indentation depths.
Figure 13 shows the stress and plastic equivalent strain for two axisymmetric cases. In these cases, the particles near the indenter tip affect the stress field and cause a deformation restriction. Its spherical radius shape variable differs from 3D cases. The axisymmetric response curves have more error than the reference curve than the 3D curves due to the lack of grains in one dimension and its effect on mechanical behavior.
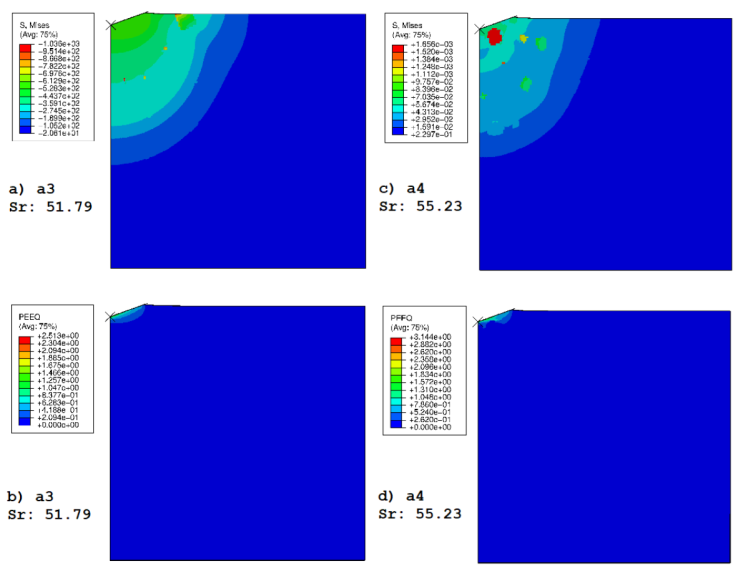
Figure 13 Von Mises stress and plastic strain fields plotted at total indentation depth for axisymmetric RVEs.
When the particles are close to the indenter tip, like the case 3D 5, the von Mises stress in the closer martensite grains is ten times higher than the other 3D cases. When the hard particles are close to the indenter, these present an effect like an artificial indenter pushing the matrix, and the load-depth curve, in this case, captures mixed properties like elastic deformation of martensite and plastic deformation of ferrite (Yuan et al., 2014).
Figure 14 and Figure 15 show the Void Volume Fraction field or VVF field of four representative cases. These images show the effect produced by the grains in the microvoid field. In all cases, it is possible to observe how the microvoids are compacted, showing the densification of the zone in these images. Also, the hard phase affects this field. Case 3D 5 captures three-dimensional irregularities of microvoid densification. The other 3D cases capture irregularities in a minor way. The axisymmetric cases cannot capture these three-dimensional microvoid irregularities, thus causing an underestimation of the results.
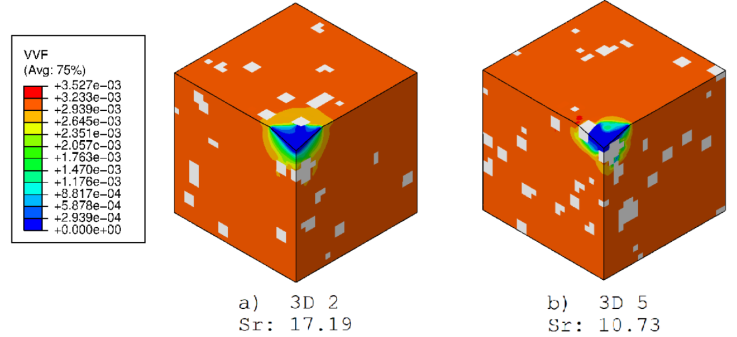
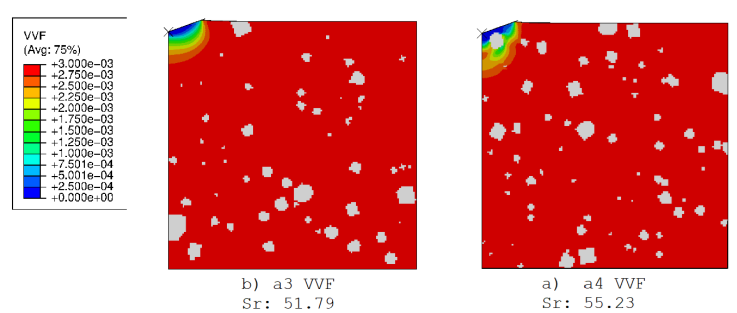
Figure 16 compares the average curves for both 3D and axisymmetric simulations with the reference DP600 curve reported by Song et al. (2012). The 3D simulations are a better approximation of the behavior and more exact than the axisymmetric simulations. It is important to remark that axisymmetric simulations have 2460 elements and were carried out in 5.42 minutes, while the 3D simulations have 104,959 elements and took 8323.7 minutes to simulate. 3D simulations have more computational cost than axisymmetric simulations but have significantly better accuracy. Theaxisymmetric simulations could acquire the tendency without spending a significant amount of time but sacrificing precision.
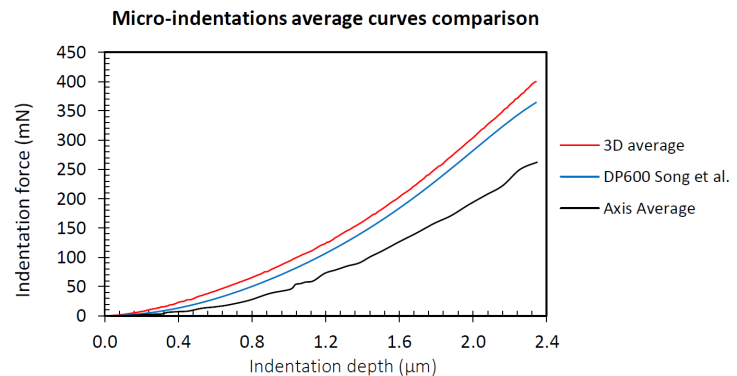
Figure 16 Average curves of force vs. depth for 3D cases and axisymmetric cases compared with the reference curve.
The average indentation force curves of 3D and axisymmetric cases were obtained by averaging the data of the curves at the same indentation depth.
The average relative error curve was obtained by calculating the relative error respect to the DP600 experimental data. Additionally, the load at 2 µm indentation depth was selected to calculate the punctual error to compare relative errors in the three-dimensional and axisymmetric cases. Graphs were made to relate the spherical radius to the relative errors calculated, as shown in Figures 17 and 18.
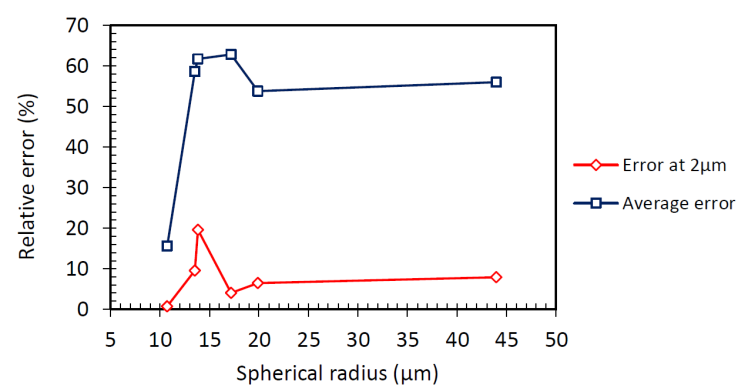
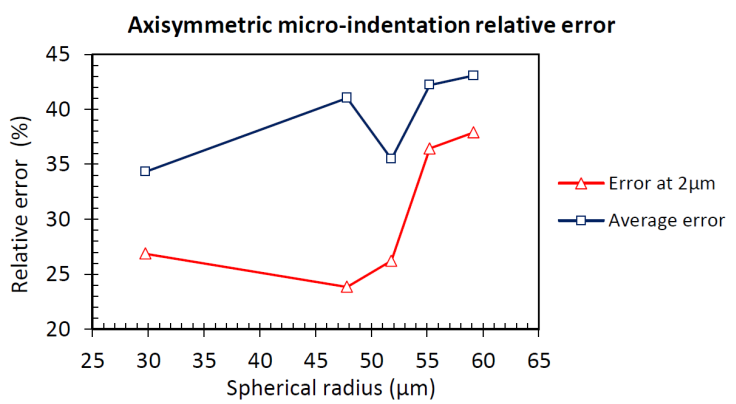
Case 3D 5 has the lowest spherical radius value and the minimum relative error. However, if the spherical radius value increases, the relative error does too. In 3D cases, when the spherical radius increases from 10 µm to 15 µm, an increase was observed in the relative error, but over 20 µm, the relative error seems to be stable. In the axisymmetric cases, it was found that the relative error was over 20% in all cases.
If the spherical radius increases, the relative error increases too. When the spherical radius is high, the hard phase is distancing from the indenter tip. More ferrite is present close to the indenter tip if the spherical radius is high. This amount of ferrite is variable because the position of the martensite grains changes for each RVE. This phases distribution causes different stress and strain fields to change in the indentation load-depth curves, thus restraining strain and stress fields in lower spherical radius values give better precision, as shown in the results. For the 3D cases, the minimum average and punctual load errors were present in the case with the minimum spherical radius, thus achieving relative errors below 20% compared to the reference. Case 3D 5 presents a different response curve caused by its low spherical radius value, thus affecting its strain and stress fields in an observable manner.
This research evaluates the random hard particle distribution in-artificial-RVEs-by-using-the-FEM-approach.
Phenomenological yield functions were used to characterize the yield behavior of the phases and a dislocation-based approximation to predict the strain hardening in both phases.
It is worth mentioning that there exist studies focused on properties of composites in which the authors evaluate the particle effect by using the volumetric fraction and changing the arrays or size of particles each at once. Using a spherical radius shape variable allows categorizing hard particles that affect the deformation of the material when it is indented, even if the material always has the same volumetric fraction with the aleatory appearing of particles.
4. Conclusions
It was possible to implement a spherical radius shape variable to quantify the proximity of the hard phase grains to the indenter tip in a microindentation simulation. This parameter describes a relationship between the closeness of the hard particles and the response in the stress and strain fields. The 3D microindentation simulations had a minor relative error than axisymmetric simulations on indentation and true stress-strain curves. The axisymmetric approximation has a more relative punctual error (above 25%) in the indentation curves than the three-dimensional approximation. In the three-dimensional simulation, the punctual error was obtained below 20%.
The time spent simulating is lower in axisymmetric cases at least 1250 times compared to 3D cases because the axisymmetric RVEs have fewer elements than 3D RVEs. For this reason, axisymmetric simulations are interesting to make an initial approximation to the problem and minimize computational costs.
The hard particles immersed and their position in the RVE modify the force response curve of an indentation at the microscale. The proximity of the hard particles affects the plastic strain field and its stress distribution, but indentation over a hard particle does not necessarily imply that the strain or stress field would be constrained. The indentation curves were influenced by the closeness of the hard particles changing stress and strain fields, producing changes in the response load. The hard phase near the indenter tip gives a better approximation because of the interaction between the soft and hard phases in the simulation. The one-node true stress-strain curve of the three-dimensional approximations had a good fit with the experimentally reported data, reaching relative errors below 10% and a similar response curve despite the model’s limitations.
The Hardness Vickers values were calculated using a projected area procedure from the maximum load step and the nodes in contact with the indenter on the simulation. The obtained values have relative errors of a maximum of 12%, which is an acceptable variation considering the limitations of the simulation and the symmetry condition of the RVE. The hardness values do not vary with the spherical radius showing any relationship between the spherical radius used and an expected hardness value.
The spherical radius shape variable was introduced to quantify the effect of the random distribution of grains. This parameter showed a better relationship between the stress and strain response than the volume fraction with equiaxial particles. The volume fraction approximation, in general, uses an equiaxial hard particle distribution in the domain. As observed, the effect of the close particles cannot be captured by the indentation simulation unless the volume fraction increases to minimize the distance between particles. The probabilistic size and morphology of grains in metallic materials are not consequent with an equidistant appearance and constant size of the grains.

