


 nueva página del texto (beta)
 Inglés (pdf)
 Artículo en XML
 Referencias del artículo
 Enviar artículo por email
 Citado por SciELO
  Similares en
SciELO
Similares en
SciELO 
 Permalink
1. Introduction
Cervical cancer is the second most frequent cancer in women in less developed regions (Momenimovahed & Salehiniya, 2017; Organización Mundial de la Salud [OMS], 2015; Torre et al., 2015), Latin America and the Caribbean, (Ferrá Torres et al., 2009) and in the world (Organización Panamericana de la Salud & Organización Mundial de la Salud [OPS/OMS], 2017; Parkin et al., 2001).
In 2017, the worldwide incidence rate for cervical cancer was 15.8 and the mortality rate was 6.8 for every 100 000 women (Institute for Health Metrics and Evaluation [IHME], 2017). For Latin America and the Caribbean, on that same year, incidence thereof was 21.9 and the corresponding mortality was 9.5 for every 100 000 women (IHME, 2017).
By 2017 in Mexico, an annual incidence rate of 18.4 was reported for every 100 000 women (IHME, 2017) together with a mortality rate of 11.2 for every 100 000 women 25 years old or older (National Institute for Women (Instituto Nacional de las Mujeres [INMUJERES], 2019).
To react to the morbidity and mortality due to cervical cancer, the Institute for Social Security and Services for State Workers (ISSSTE) established the Program for the Timely Prevention and Detection of Cervical Cancer, in proper alignment with sectorial public policies. The program is a public initiative constituted by three actions: vaccine against the human papilloma virus (HPV), cervical cytology (papanicolau) and an HPV detection test (Consejo Nacional de Evaluación de la Política de Desarrollo [CONEVAL] & Instituto de Seguridad y Servicios Sociales de los Trabajadores del Estado [ISSSTE], 2013). The Program uses an attention model focused on processes. To have a better follow-up and control of the cited program, Institute for Social Security and Service for State Workers - Federal Institution (ISSSTE) developed the Information System for Cervical Cancer Detection Program (SIDECAM).
This system was implemented to promote the registration, consult, analysis, control, and follow-up of laboratory tests done on patients (Equiver, 2014). SIDECAM also provides information required to evaluate the health (SIDECAM) conditions of the population using it and the performance of the program itself.
SIDECAM, has constantly evolved and been renewed throughout time to offer better follow up of the target population (Figure 1). Taking into consideration all the benefits and progress obtained because of its implementation, the aim of this article was to evaluate the performance of the Information System for Cervical Cancer Detection Program of ISSSTE in 2017, considering the organizational, technical, and behavioral dimensions of the PRISM methodology (Hotchkiss et al., 2010).
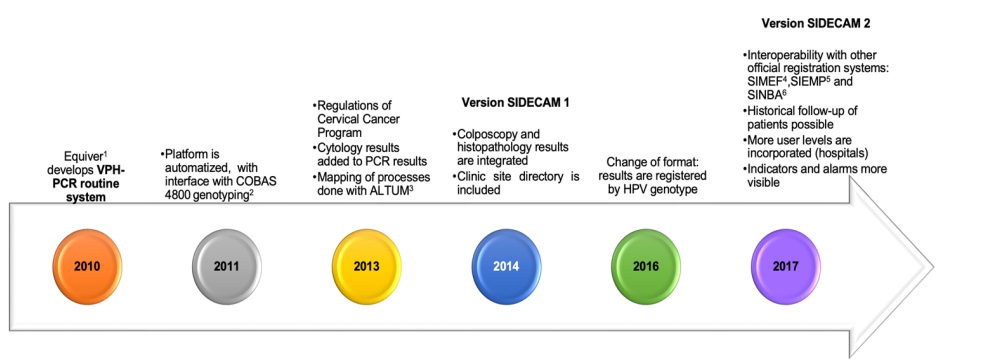
1. Equiver: a Mexican Company that provides medical equipment, supplies and laboratiry test for health care.
2. COBAS 4800: automated system that detects 14 high risk HPV genotypes: genotypes 16 and 18 separately and 12 other high-risk genotypes pooled.
3. ALTUM: a company that led the first stage of the cervical cancer plataform for ISSSTE.
4. SIMEF: Medical Financial System (spanish acronym: Sistema Médico Financiero).
5. SIEMP: Online System of Statistical Information in Preventive Medicine (Spanish acronym: Sistema en Línea de Información Estadística en Medicina Preventiva).
6. SINBA: National System Basic Information on Health (spanish acronym: Sistema Nacional de Información Básica en Materia de Salud).
Source: Prepared whith data the interviews.
Figure 1 Timeline of the Cervical Cancer Health Information System.
2. Methods
We performed a retrospective study with primary data and mixed analysis techniques, using tools from the Performance of Routine Information System Management framework (PRISM). This framework was developed for global use in assessing the reliability and timeliness of a Routine Health Information System (RHIS) in making evidence-based decisions, and in identifying gaps, so they can be addressed, and the system can be improved, and used to see how health indicators are performing, according to the Measure Evaluation (Aqil et al., 2009b; Health Metrics Network [HMN] & World Health Organization [WHO], 2008).
2.1. Data
We collected the information in a Lot Quality Assurance Sampling (LQAS) to measure performance (MEASURE Evaluation, 2017) of 13 facilities belonging to the 35 districts of ISSSTE. Eleven operative facilities were included (family medicine units [UMF], laboratories and hospitals), together with two management facilities (one state district and one central office). Thirty-eight key actors, who were users of any of the versions of the software, were taken as informants (nurses, doctors, gynecologists, colposcopists, cytologists and laboratory employees). We analyzed two versions of the software: 1) HPV-PCR and 2). SIDECAM 1 and we considered SIDECAM version 2.0 but it had not been implemented yet. We delivered 20 self-applied questionnaires and performed two semi structured interviews to the medical direction staff of ISSSTE. These employees were responsible for the operation of the information system and belonged to the company Equiver, main external user thereof, to delve deeper into the design, conception and implementation of the Health Information System for Cervical Cancer, the study settings, the experiences, and the historical references.
Procedures for contacting respondents, conducting interviews and surveys, processing data, and publishing related information were approved and monitored by the medical direction through the Subsecretary of Prevention and Health Protection from ISSSTE, who asked the oral consent of the participants. We used all information provided by informants for purposes pertaining to the present study only and published it in an anonymized manner. All privacy requirements were fulfilled, together with the principles of the Helsinki Declaration (World Medical Association [WMA], 2013).
2.2. Measures
The study was conducted through the usage of PRISM tools (MEASURE Evaluation, 2019b). This methodology makes it possible for the assessment of the performance displayed by the Health Information Systems (HIS) through two components: the quality and the use of the collected information. Besides, it also takes into consideration key factors to guarantee its operation, such as: technical aspects (equipment, infrastructure, formats, software, etc.), organizational factors (dean’s office, planning, training, and finances, among others), and behavioral aspects in terms of human resources (level of knowledge, leadership, motivation, and others) (Aqil et al., 2009b; HMN & WHO, 2008). This tool contemplates two levels: health facilities and higher-level offices (jurisdictional facilities and district) (Aqil et al., 2009a). For the analysis of information, indicators were generated according to PRISM framework, wherein response variables were quality and use of information.
2.3. Analysis
We calculated and reported in percentages and frequencies the system’s performance indicators (MEASURE Evaluation, 2019a), proposed in the PRISM methodology, for each of the versions of the software (HPV-PCR and SIDECAM 1) to compare them (Appendix A). We collected data in printed formats for each questionnaire and identified them with a reference folio. Later, they were digitalized through a typing mask developed in the program Epi InfoTM 7 (Centers of Disease and Control Prevention [CDC], 2017) and analyzed through the program Stata 14.0 (StataCorp LLC, 2015) to build charts revealing indicators and figures.
Open questions from Organizational and Behavioral Assessment Tool (OBAT) tool were graded, and all variables were turned into numerical categories. This coding is presented in the OBAT Tool Handbook (Aqil et al., 2005). All information related to the competences observed and detected was obtained globally, as they do not vary when versions were differentiated in the software.
3. Results
3.1. Sample characteristics of respondents
Of the 38 users surveyed, 79.0% were adult women, with an average age of 42.7 years old (SD ± 10.3 years), 23.6% had master’s degree, 26.3% had a specialization, 21.1% had a bachelor’s degree, 15.8% had high school education and the rest had a technical degree.
The average time of seniority in their position was 11.4 years (SD ± 9.5 years). According with their position, 21.1% corresponded to nursing staff, 15.8% administrative personnel, 10.5% general medical practitioners, 7.9% pathologists and cytotechnicians, whereas four positions (gynecologists, lab technicians, chemical analysis and lab staff) occupied 5.3% respectively. The rest was constituted by different positions.
3.2. Performance of the information system
The assessment of the performance of the cervical cancer HIS in Mexico displayed a global performance of 73.7% at the beginning of 2017. In general, the performance of the Information System was better in facilities which used the SIDECAM 1 software (75.7%) compared to the HPV-PCR (71.6%). A comparative analysis of the performance of the two software shows that the improvement was detected mainly in the quality of information (64.6% vs 72.5%), while the use of information was quite similar (78.6% vs 78.9%) (Figure 2).
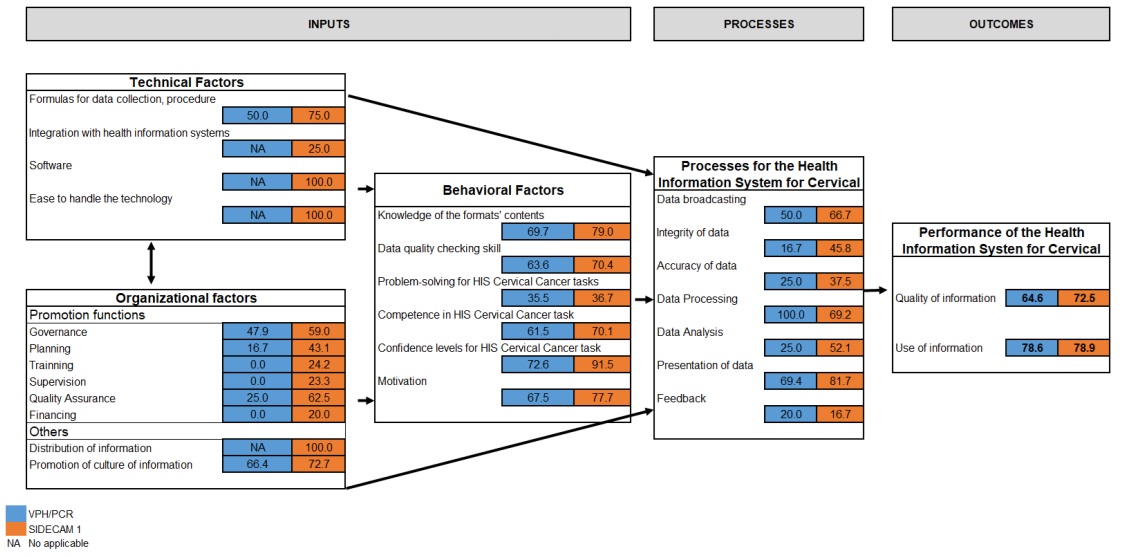
Figure 2 Indicators of the performance of the Information System for the Detection of Cervical Cancer. Mexico 2017.
Indicators measuring the quality of information were: integrity of information (33.3% vs 68.7%), measured based on the number of monthly reports made in two comparison dates at the facilities which must report this information to the system; the opportunity (50.0% for SIDECAM 1) of the facilities upon delivery of the reports in the deadline when information is expected to be submitted; and accuracy (98.5% vs 98.9%) according to the information reported in the paper documents, in relation to those visible in the software (Figure 3).
| System | Integrity | Opportunity | Accuracy | Quality |
|---|---|---|---|---|
| VPH-PCR | 33.3 | NA | 95.8 | 64.6 |
| SIDECAM 1 | 68.7 | 50.0 | 98.9 | 72.5 |
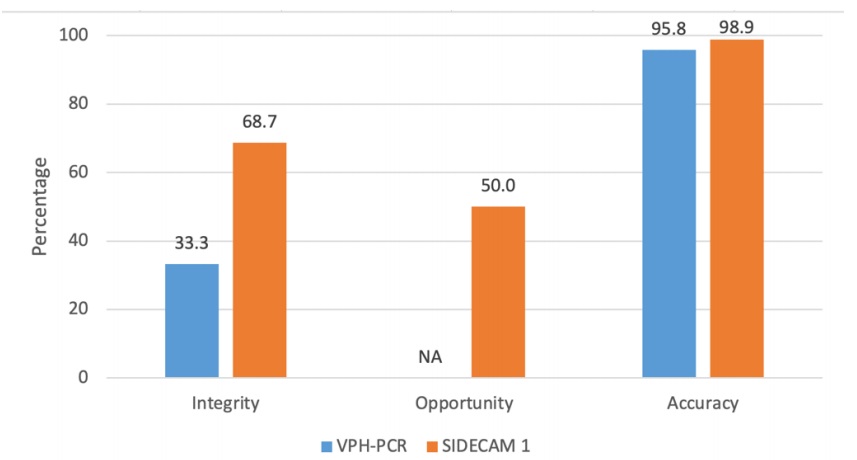
Figure 3 Indicators of the quality of information of the Information System for Cervical Cancer. Mexico 2017.
We analyzed the use of information based on reports made in relation to those that must be prepared, wherein both versions had 100.0%; the presentation of indicators (69.4% vs 88.5%), the sorts of decisions made based on the analysis (54.2% vs 80.2%) and activities related to the promotion of the use of information (26.7% vs 45.8%). All these indicators displayed a major improvement; whereas the decision making based in HPV-PCR information and that of SIDECAM stayed at 100.0%. At the same time, the percentage of problems derived from actions with the use of information (100% vs 75%) and the gatherings that took place and generated discussion of the use of information, decreased (100.0% vs 62.0%) (Figure 4).
| Performance Indicators | VHP-PCR | SIDECAM 1 |
|---|---|---|
| Reports | 100.0 | 100.0 |
| Presentation | 69.4 | 88.5 |
| Analisys | 54.2 | 80.2 |
| Discussion | 100.0 | 75.0 |
| Decision Making | 100.0 | 100.0 |
| Actions | 100.0 | 62.5 |
| Promotion Activities | 26.7 | 45.8 |
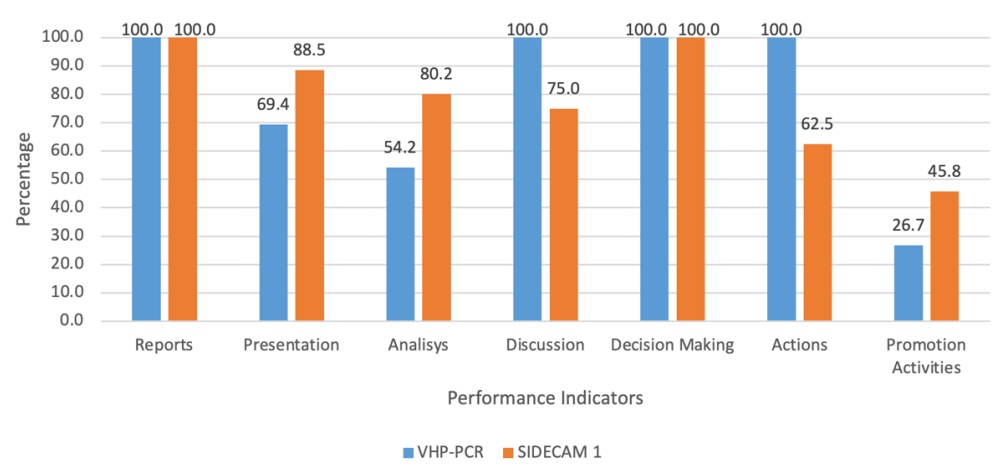
Figure 4 Indicators on the use of information of the Information System for Cervical Cancer. Mexico 2017.
Among the technical factors, we found that 50.0% vs 75.0% of the users considered that the handbook for the procedures of the software was easy to use, and the formulas to collect data were easy to complete; for SIDECAM 1, 25.0% thought the software integrated information which may be found in other information systems, 100.0% thought the software’s was adequate and easy to use, an 100.0% believed the information technology used in the software was easy to handle.
In terms of internet connection for accessing to the information, 34.0% believes that it partially existed, 35.4% that it existed totally and the rest that it did not exist.
Regarding technological resources, in average each facility has seven material resources (computer, backup unit, printer, modem, no break, generator and/or telephone); 100.0 % had electrical power and access to internet, out of which 61.1% mentioned that this last service was interrupted at least once a month. In relation to the organizational factors of the program, governance was found in 53.5%, that is, the fact that they ostensibly displayed the mission of the program, a management structure, an updated organization chart and a list of distribution of monthly or quarterly reports taken from the software was verified. Planning was 29.9%, that is, it was verified that the reports on the analysis of the situation done on the software within the last three years were visible, that they had a five-year plan for the SIDECAM and that they had goals for the cervical cancer program. There was quality assurance regarding the information in 43.7%, that is, they had guides and tools for the improvement of the program’s performance. They mentioned that they held training sessions in 24.2%, through handbooks, constant training related to the program or the software, and scheduled training, and 23.3% were supervised, in a scheduled way, with evaluations for different items and reports prepared thereof. In terms of the budget, only 20.0% had the knowledge; that is, they had a record of expenses, mechanisms to generate funds, monthly or quarterly financial reports and a financial chapter to support the cervical cancer program activities.
Regarding user facilities, 33.3% of them for each version received more than one supervision visit. Among them, 55.0% considered that the supervision visits were of good quality, namely, they were constituted by a checklist to verify the quality of information, the main topics addressed in the performance of the site during the visit, the support granted for decision making process based on the information of the cervical cancer software and the sending of feedback reports regarding the most recent supervision visits.
Of those interviewed in the health units, 59.1% reported that there is a procedure handbook to gather information, and 23.8% of the facilities had in the office a map for the area of influence or a map of the endangered population.
The information culture was found in 73.3% in the SIDECAM 1; that is, they are aware of the importance of the quality of information (71.4%); they use the information contained in the Cervical Cancer software for monitoring (73.9%); carry out the decision making based on evidence (67.7%); search for, obtain and secure feedback (70.9%); feel committed and responsible in their jobs (77.6%); feel empowered and committed to be held accountable for their performance (76.7%).
For all personal behavior factors, the culture of information was taken into consideration; this was found in the SIDECAM 1 by 73.3% of the participants. This means they know the importance of information quality (71.4%); they use the information contained in the cervical cancer software for monitoring (73.9%); they carry out the decision making processed on evidence (67.7%); they search for, obtain and secure feedback (70.9%); they feel committed and responsible at their jobs (77.6%); and they feel empowered and committed to be held accountable for their performance (76.7%) (Figure 5).
| System | Quality of data | Use of Information | Decision making | Feedback | Responsability | Empowering | Promoción de la cultura de la información |
|---|---|---|---|---|---|---|---|
| VPH-PCR | 68.1 | 62.1 | 67.7 | 61.7 | 69.2 | 69.3 | 66.4 |
| SIDECAM 1 | 71.4 | 73.9 | 65.7 | 70.9 | 77.6 | 76.7 | 72.7 |
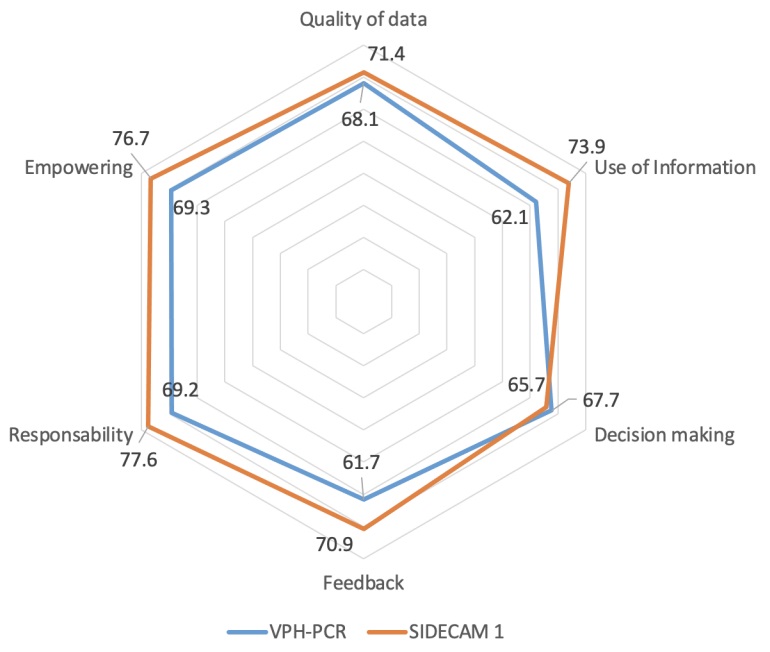
Figure 5 Indicators of the promotion of information culture regarding the Information Service for Cervical Cancer. Mexico 2017.
In relation to the competencies of the staff for using the health system, they self-reported a performance of 82.1%, whereas the observed (evaluated) competencies were 67.0%. In Figure 6, the specific competencies are shown. With the HPV-PCR software they scored 67.5% and those using SIDECAM 1 reached 77.7% (Figure 6).
| Competences perceived | Competences observed | |
|---|---|---|
| Verify quality of data | 85.7 | 67.0 |
| Estimate indicators | 84.7 | 64.0 |
| Chart | 82.0 | 79.8 |
| Interpret | 78.1 | 63.4 |
| Use of information | 80.8 | 56.3 |
| 82.1 | 67.0 |
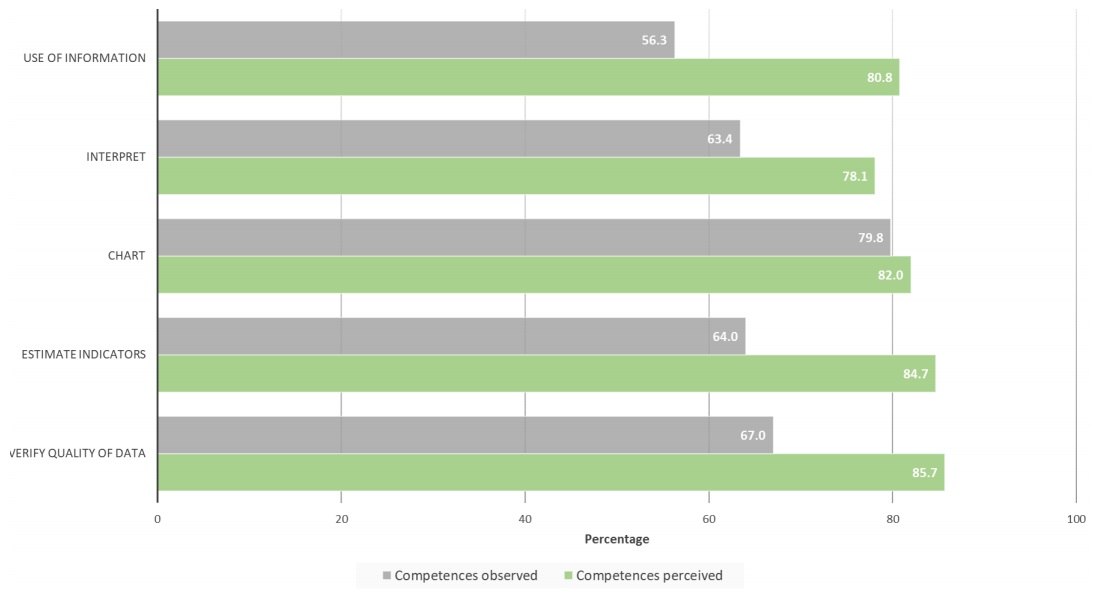
Figure 6 Indicator of competences observed vs perceived by personnel of the Information System for Cervical Cancer. Mexico 2017.
In terms of cervical cancer HIS processes, it was observed that 58.4% of the users received instructions to deliver the report on the established deadline, and they were aware of the consequences of not doing so. And regarding the integrity of information, 31.3% commented that they were instructed to fill out the report completely, aside from the fact that they knew what would happen if they did not. Thirty-one percent mentioned that they have been asked to check the accuracy of the information at least once a month and were aware of the consequences if they failed to do so. It was stated by 84.6%, that they knew the procedure manual to gather information. In relation to the data analysis, 38.6% indicated that through the data base it is possible to estimate indicators and compare information on the software. Furthermore, 75.6% mentioned they did the presentation of updated indicators through charts, tables, or maps. Finally, 18.3% mentioned they received feedback about their performance from their superiors.
Management or administrative meetings were conducted for the cervical cancer program, according to the needs of each health facility; 33.3% were conducted monthly, whereas 66.7% were conducted quarterly, semiannually, or annually.
Regarding users’ general perception of the cervical cancer HIS, 68.3% considered that the HPV-PCR software was adequate for the program, whereas SIDECAM 1 was deemed adequate by 89.5%. The results of the present study also suggest that, even though the performance of the system has improved with the later version, SIDECAM 1 is regarded as adequate in almost 90% of cases and several improvements are being implemented for the system’s software SIDECAM 2.
Among the improvements reported by the SIDECAM 1 Cervical Cancer program staff, in terms of HPV-PCR, they mentioned that the interface is friendlier and swifter, it offers greater ease to find results, it entails validation by the cytotechnologist, it simplifies the sample taking, and others.
4. Discussion
The purpose of the present study was to evaluate the performance of the Information System for the Cervical Cancer Program of ISSSTE, considering the following dimensions: organizational, technical and behavior of personnel involved, through PRISM methodology. SIDECAM information system provides good quality, good coverage and timely clinical information for the Cervical Cancer Screening and Detection Program. This information system allows the program to provide good follow-up and control of its beneficiary population. However, there is an opportunity to improve the system performance and the program in general, with increased health staff training and the inclusion of indicators for health outcomes, which would allow the evaluation of the program’s performance in terms of quality of care.
This is the first evaluation made on a specific information system for cervical cancer, and therefore, no other studies could be found that were focused on the topic. However, there is an antecedent about an assessment made in 2005 to users at the institutions of the Ministry of Health (MH) and the Mexican Social Security Institute (IMSS). This evaluation was based on the Health Metrics Network framework (HMN) and included by first time the OBAT tool in its Spanish version (National Institute of Public Health [NIPH] & Secretariat of Health [SH], 2006; Plaza et al., 2012). In this sense, a comparison to the results of HIS assessments carried out in other countries is presented below.
Evaluation of cervical cancer HIS at ISSSTE in Mexico through the PRISM methodology displayed a result in the global performance of 73.7%. This result is similar to the one obtained by Rwanda in 2012, with 71.5% in its national information system (Belay & Lippeveld, 2013). During this year, evaluations were also made on HIS of four countries in Africa (Liberia, Côte d’Ivoire, Gabon, and Ethiopia); nonetheless, the performance of all of these was lower than 50% (Belay & Lippeveld, 2013).
Upon reviewing the performance for each of the versions of the software, an improvement was observed in SIDECAM compared to the version HPV-PCR (75.7% versus 71.6%). This behavior was also registered in the assessment made on HIS at Côte d’Ivoire in 2008, where a performance of 44.0% was found, and one of 48.0% was reported for 2012 (Belay & Lippeveld, 2013).
Itemized results of cervical cancer HIS performance in its components, regarding quality and use of information showed that the quality of information had a lower percentage, in comparison to its use, with 68.6% and 78.8% respectively; a difference of 14.9% between them. It is essential to point out that the opportunity indicator could not be measured in the HPV-PCR version, as the sample did not include family medicine units that used this version; therefore, the global quality component is reported exhibiting a lower performance. This sets the tune for aspects to be considered: on the one hand it has been observed that the system’s users are indeed using the information. Nonetheless, there are areas where promotion is still lacking, mainly among users of more basic levels of clinical attention, because quite often it is the medium and upper levels of command the ones that end up using the registration software (Hotchkiss, Aqil, et al., 2010; NIPH & SH, 2006; Plaza et al., 2012). Upon comparing these results to those obtained in the African countries mentioned before, it may be seen that quality was better in terms of the use of information; that is to say, the gap is inverted. In spite of the fact that information is generated, which could be relevant, pertinent and timely for decision making, this information is not always used (Belay & Lippeveld, 2013; Plaza et al., 2012). This means that there is a culture of poor data use, where people do not see the value of using information for this (Afe et al., 2017; Nicol et al., 2013). The total result of the promotion of information culture indicator for SIDECAM 1 was 72.7, somewhat similar to what was reported in the evaluation of PRISM in Palestine (73.9) (Mimi, 2015).
On the other hand, there are aspects which must be reinforced in the processes, aside from taking into consideration the factors that could have an influence in the performance of cervical cancer HIS, for the information generated to fulfill all the necessary quality indicators (integrity, opportunity, and accuracy) at any level where it may be required (OPS, 2010; Ly et al., 2016). Among the most relevant elements that are associated with this component, there are the organizational factors such as training, and among the human resources factors are motivation and supervision (OPS, 2010; Ly et al., 2016). These two aspects are relevant as they make it possible to foster a sense of belonging and commitment of all users as part of the HIS. Besides, they help handle data analysis and problem solution, thus bearing a positive influence in the whole process (Afe et al., 2017; Aqil et al., 2009b; 2010; Glèlè Ahanahanzo et al., 2014; Hotchkiss; Ministerio de Salud de Perú, 2008). Results of cervical cancer HIS in terms of motivation, displayed a high percentage, 72.6%, with a better performance of users of the SIDECAM software. The result was comparable to the evaluation made in 2005 in Mexico (NIPH & SH, 2006) that showed 70.7% (MH: 68.8% and IMSS: 73.5%) of motivation and other works in 2010 of HIS in Lima, Peru (76.7%) (Vargas et al., 2010), Ecuador (82.4%) (OPS, 2010) and South Africa in 2012 (Nicol et al., 2013) showed an average of 73.3%.
The analysis of the gap between the components (quality vs the use of information) captured by version of the software, was greater for the HPV software, with 14% (quality 64.6% vs 78.6% in use) compared to SIDECAM with 6.4% (quality 72.5% vs 78.9% in use), which accounts for a decrease in 54.3% (Afe et al., 2017). Results in 2012 gathered in African countries in this respect were contrasting: Rwanda, which got a better result, had a difference of 3.0% between quality and use of information, followed by Ethiopia with 5% but with a global performance of 37.5% (quality 40% vs 35% in use). At the same time, we have Liberia, Côte d'Ivoire and Gabon, with a total performance of 44.6%; the difference between the two components was 19.0%, 20.0% and 20.5% respectively (Belay & Lippeveld, 2013).
Regarding the results obtained in the global evaluation of organizational factors, it was noted that the dimensions that displayed a lower percentage were financing (10.0%), supervision (11.7%) and training (12.1%), which in turn were lower for the HPV software. Data of these indicators in other countries showed a similar behavior. Results of the evaluation in 2007 at higher levels of the Ministry of Public Health and Social Welfare (MSPyBS) and the Social Security Institute (IPS) in Paraguay, indicated that HIS management had differences between these institutions, MSPyBS had a financing average of 1.2%, training 8.1% and supervision with 14.6; while that outcomes in IPS were 75.0%, 66.7% and 0.0% respectively (Torres, 2007). In Ecuador, the financing had 26.2%, supervision 33.0% and training 40.7% (OPS, 2010). The information detected for HIS in Lima, Peru in 2010, revealed 20.0% in financing, whereas the study done on the rest of the country in 2008 was 34.0%; that is to say, the resources exist but they are insufficient (Ministerio de Salud de Perú, 2008; Vargas et al., 2010). The feedback as an essential part of supervision and continuing training has an important role to improve the quality and use of data in all levels (Chebueret & Odhiambo-Otieno, 2016; Hotchkiss, Aqil, et al., 2010; Whittaker et al., 2015).
In the global results for behavior factors pertaining human resources, the smaller percentage in performance was observed for the solution of problems related to cervical cancer HIS, with 36.1%, and a minimum difference of 1.2% between the two versions. In the competence of problem solution by users of the software, low percentages were revealed (HPV-PCR: 35.5% and SIDECAM: 36.7), nonetheless, a lower one has been found (18.4%) in the evaluation done to SINAIS in the state of Guanajuato, Mexico in 2010 (Aqil et al, 2010). At the same time, evaluations conducted in other countries in 2010 for this same dimension displayed higher percentages, with 69.1% in Lima, Peru (2010), 81.0% in Uganda or South Africa with an average of 21.0% (Hotchkiss, Aqil, et al., 2010; Nicol et al., 2013; Vargas et al., 2010).
In terms of the verification of the quality of data, a difference of 18.7% was observed between the competencies perceived versus the observed ones, similar to that reported in the SINAIS evaluation (18.4%) (Aqil, 2008; Aqil et al, 2010). Data of South Africa in 2012 showed a difference of 42.3% between these and estimated that 64.0% of interviewed users had limited skills in calculation, statistical and data quality checking which reflects the need to strength this skill (Chebueret & Odhiambo-Otieno, 2016; Nicol et al., 2013).
5. Conclusions
In general, the perception of health workers regarding the information system for cervical cancer revealed that they considered the HPV-PCR software was adequate for the program, but this perception improved with the implementation of SIDECAM 1, with an assessment of its adequacy of 89.5%. The results of this study suggest that, even though the performance is adequate, a series of recommendations may be proposed to improve SIDECAM 2 system's software. Even though the development of the information system was centered on the clinical decision-making process in its beginning, its growth and improvement potential lie in the ability to use information for the clinical decision making process. The association of SIDECAM in its new version to other institutional or health sector information systems, paves the way for the possibility to conduct health outcome measurements, to do performance evaluations in terms of the program and, consequently, to implement quality improvements on the clinical service given to the user population.

