


 nueva página del texto (beta)
 Inglés (pdf)
 Artículo en XML
 Referencias del artículo
 Enviar artículo por email
 Citado por SciELO
  Similares en
SciELO
Similares en
SciELO 
 Permalink
1. Introduction
Plastics have been one of the most highly valued materials because of their extraordinary versatility and low cost (Frech, 2002). Among the total plastic usage, "packaging" occupies the top position with 41%, of which about 20% is used in the food industry. Since most of the packaging materials are made up of non-degradable synthetic plastics, packaging waste also occupies the top position in landfills (Coles et al., 2000; Fomin & Guzeev, 2001; Pilla, 2009; Marsh & Bugusu, 2007; Tharanathan, 2003). Some of the properties that good packaging materials possess are permeability, sealing, resistance to chemicals, transparency, mechanical properties, machinability, etc. Synthetic plastics that currently dominate the packaging sector possess most of the specifications except for sustainability which bioplastics offer.
The use of bioplastics not only provides a sustainable alternative for packaging but also biodegradability and composability. Furthermore, the bio-based packaging materials also fulfil the number of important criteria such as containment and protection of food, maintaining its sensor quality and safety (Sothornvit & Krotcha, 2000; Roberston, 2012; Sajilata et al., 2007; Zhu et al., 2001). Among the different bio-based polymers used in the industry, starch-based polymers are specific because of their easy achievement directly by plasticizing a renewable resource, the native starch.
Figure 1 reveals the structural organization of starch which involves (a) amylose, (b) amylopectin, (c) crystalline packing of amylopectin, (d) ramifications in an amylopectin chain, (e) packing of chains in a starch, (f) starch granule structure, and (g) amylopectin double helix structure. It is generally extracted from corn, wheat, potato, cassava, tapioca, and rice. From the packaging industry point of view, starch-based plastics represent great potential because of their biodegradability, combustibility, natural abundance, and renewability.

The most common applications of starch polymer for the packaging industry such as soluble films, films for bags and sacks, and loose fills. Despite its many advantageous features, the poor mechanical and water vapor barrier properties limit its application in the packaging industry (Angellier et al., 2008; Hodgin, 2003; Onwulata & Cherry, 2006; Shen et al., 2009).
A promising method to overcome the shortcomings of starch is to introduce fibrous or lamellar particles of filler. By doing so, the effect of strengthening can be reached not only because of the considerably higher values of strength and rigidity of the filler but also because of the particle geometry (aspect ratio). During the past few years, an interest in starch-based composites containing natural fillers has increased and this is due to the exceptional potential of bio-fillers to increase various properties such as heat resistance, mechanical strength, electrical conductivity, and gas permeability (Petersson & Oksman, 2006; Saheb & Jog, 1999).
Polymer composites strengthened by natural fillers can act as a substitute for traditional materials like fiber board, chipboard, and plywood. Natural filler reinforced green composite is an interesting area of research and most of the polymer-based industries are now focusing to develop their products by reinforcing with bio-fillers. The agriculturally-derived natural fillers include soy or wood flour, corn hull, chopped fibers such as sisal, coir, hemp, jute, and shell particles like a walnut shell, almond shell, pine nut shell, and cassava peel (Ali et al., 2017; Ali et al., 2018; Basu et al., 2017; Bodirlau et al., 2013; Li et al., 2016; Shi et al., 2013).
Among these cellulosic fillers, the nutshells have significant potential as promising reinforcement in polymer composites. Shells from edible nuts have the advantage of being concentrated at the nut processing mill. Walnut (Juglans regia L.) and almond (Prunus armeniaca L.) are the most popular tree nuts and their production is over 3.7 million and 1.2 million tons during the 2017 season. According to the FAOSTAT report (FAOSTAT, 2017), China is the biggest producer of walnut with 1.06 million tons followed by Iran, USA, and Turkey. However, USA leads the world production of almond with 81% of the total, followed by Australia and Spain.
Both shells are of lignocellulosic which represents 50% and 67% of the dry weight of almond fruit and walnut kernel. The shells are differed in chemical composition: walnut shells have 25.60% cellulose content, 52.30% lignin, 22.10% hemicellulose, and 3.6% ash content while almond shells have 29.57% cellulose, 47.97% lignin, 17.01% hemicellulose, and 3.6% ash content. These by-products are generally incinerated or discarded without control which results in the formation of a large amount of waste and pollution (Esfahan, 2010; Ledbetter, 2008; Potter et al., 2002; Queirós et al., 2020; Urrestarazu et al., 2005).
To overcome this, many researchers have undertaken research into its potential uses. McCaffrey et al. (2018) reported the significant potential of almond shells as a bio-reinforcing agent for recycled polypropylene-polyethylene (PP-PE) blends. Ramos et al. (2020) found that the addition of almond shell powder (ASP) in the polyester matrix results in the increase of elastic modulus of bio-composites. Singh (2015) studied the mechanical behavior of walnut shell reinforced epoxy composites and observed that the addition of walnut particles increased the modulus and hardness of the biocomposites. Li et al. (2018) studied the chemical characteristics of almond shells which indicate that almond shells have considerable potential to be used in composites and absorption materials. Pirayesh et al. (2013) reported that the walnut/almond shells can be considered as filler for the manufacturing of wood-based particleboards. The addition of walnut/almond particles significantly improves water resistance and thickness swelling properties.
Sarsari et al. (2016) evaluated the physical and mechanical characteristics of the walnut shell (WS) filled thermoplastic starch composites. They found that the incorporation of WS greatly improved the tensile strength, bending strength, and modulus of composites. Sabarinathan et al. (2016) considered the sugarcane leaves and almond shell particles as reinforcement in epoxy polymer matrix. Shah et al. (2018) reported that the incorporation of alkali-treated walnut shells in blended Epoxy/diaminodiphenylmethane (DDM) matrix increases the thermal stability, crystallinity, and storage modulus of composites. Picard et al. (2020) reported that the addition of peanut hulls in poly (tri-methylene terephthalate) results in the enhancement of its tensile and flexural moduli with sustainability.
The performance of composite strengthened by natural fillers depends upon the filler type, size, content, morphology, dispersion, and interfacial adhesion with matrix resin (Essabir et al., 2013; Fu et al., 2008). However, no research work is available till date which accounts the optimization of parameters for the enhancement of composite film performance. Several optimization techniques such as RSM, Taguchi method, full factorial, fractional factorial, ANN, fuzzy logic, and GA are available which have significant potential to optimize the performance parameters (Mohamed et al., 2015). Moreover, these techniques have great potential to develop those models which can predict and established the relationship between different inputs and response variables.
In this proposed study, the performance of starch-based composite films is improved by the optimization of three significant parameters (filler type, filler size, and filler content) using RSM technique. To the best of our knowledge, the RSM optimization technique has not been used till date for the modeling and performance optimization of starch-based composite films. A five-level central composite design (CCD) was used to make the relationship between performance parameters and desired responses [tensile strength, Young’s modulus, elongation at break, impact strength, water vapor transmission rate (WVTR), rate of degradation (ROD), transparency, and solubility of films].
2. Methodology
2.1. Preparation of biocomposite films
The high-amylose starch (amylose content 75%) consists of polysaccharide granules obtained from the rice Oryza sativa L. It was in the form of white powder and contains generally a mixture of two polysaccharides, amylopectin (α-amylose) and amylose (β-amylose). The nut shells (walnut and almond) were procured from the M/s Sakshi Dies and Chemicals, Delhi (India). The almond and walnut shells were washed in distilled water and then dried at 40 ± 5oC for two days using a hot air oven (SV Scientific Laboratory, India). After drying, both shells were grinded into small particles (10-30 µm) in a vertical planetary ball mill machine (YKM-8L, China) and then added (0-10 wt.%) into the starch mixed polyethylene glycol (PEG, molecular weight: 1200 g mol-1) solution. The gelatinized suspension (100% gelatinized temperature: 85oC) was vigorously shaken for 30 mins and then immediately poured into a polystyrene dish. Films were then dried at 60oC in an oven to obtain a constant weight. A total of 26 samples were formed by varying the filler type, filler size, and content. The composition of developed samples is reported in Table 1.
2.2. Performance parameters of biocomposite films
From the above-mentioned literature, it was observed that the performance of a composite film depends upon various parameters. Three parameters filler type, size, and content were selected with their range and levels are reported in Table 2. The different combinations of factors levels (coded and actual) are shown in Table 3. Each numeric parameter (filler size and content) was set to 5 levels while the categoric was to 2 levels. The low and high value range of the numeric parameters was set in terms of alpha. Central composite design was used to optimize the performance characteristics of starch-based biocomposite films.
Table 2 Central composite design for three performance parameters.
| S. no. | Parameter Type | Name | Notation | Unit | -alpha | Low (-1) | Center point (0) | High (+1) | +alpha |
|---|---|---|---|---|---|---|---|---|---|
| 1 | Numeric | Filler content | A | % | 0 | 1.46 | 5 | 8.53 | 10 |
| 2 | Numeric | Filler size | B | µm | 10 | 12.92 | 20 | 27.07 | 30 |
| 3 | Categoric | Filler type | C | - | - | Walnut shell | - | Almond shell | - |
Table 3 Coded and actual values of factors.
| Exp. trials | A | B | C | Filler content, A (%) | Filler size, B (µm) | Filler type, C |
|---|---|---|---|---|---|---|
| 1 | +1.414 | 0 | -1 | 10 | 20 | Walnut shell |
| 2 | +1 | -1 | -1 | 8.53 | 12.92 | Walnut shell |
| 3 | +1.414 | 0 | +1 | 10 | 20 | Almond shell |
| 4 | +1 | +1 | -1 | 8.53 | 27.07 | Walnut shell |
| 5 | 0 | -1.414 | -1 | 5 | 10 | Walnut shell |
| 6 | 0 | 0 | -1 | 5 | 20 | Walnut shell |
| 7 | +1 | -1 | +1 | 8.53 | 12.92 | Almond shell |
| 8 | 0 | 0 | -1 | 5 | 20 | Walnut shell |
| 9 | 0 | 0 | -1 | 5 | 20 | Walnut shell |
| 10 | 0 | 0 | -1 | 5 | 20 | Walnut shell |
| 11 | +1 | +1 | +1 | 8.53 | 27.07 | Almond shell |
| 12 | 0 | 0 | -1 | 5 | 20 | Walnut shell |
| 13 | 0 | +1.414 | -1 | 5 | 30 | Walnut shell |
| 14 | 0 | 0 | +1 | 5 | 20 | Almond shell |
| 15 | 0 | 0 | +1 | 5 | 20 | Almond shell |
| 16 | 0 | -1.414 | +1 | 5 | 10 | Almond shell |
| 17 | 0 | 0 | +1 | 5 | 20 | Almond shell |
| 18 | 0 | 0 | +1 | 5 | 20 | Almond shell |
| 19 | 0 | 0 | +1 | 5 | 20 | Almond shell |
| 20 | 0 | +1.414 | +1 | 5 | 30 | Almond shell |
| 21 | -1 | -1 | -1 | 1.46 | 12.93 | Walnut shell |
| 22 | -1 | +1 | -1 | 1.46 | 27.07 | Walnut shell |
| 23 | -1 | -1 | -1 | 1.46 | 12.93 | Walnut shell |
| 24 | -1.414 | 0 | -1 | 0 | 20 | Walnut shell |
| 25 | -1 | +1 | +1 | 1.46 | 27.07 | Almond shell |
| 26 | -1.414 | 0 | +1 | 0 | 20 | Almond shell |
2.3. Experimental design matrix
A statistical and mathematical technique called response surface methodology (RSM) was used for modeling and analysis of specific problem factors. It exhibits significant potential to analyze the effect of multivariable on the desired responses by employing linear or polynomial functions to achieve optimization. In RSM, the central composite design was specifically considered to develop an experimental design matrix and analyzed the linear, 2 factor interaction (2FI), quadratic, and cubic models of three performance parameters. In this work, the second-order quadratic model (Eq.1) was used to show the correlation between various input parameters and the desired responses. Table 4 illustrates the various model terms and their power to evaluate the design model. Most of the terms have significant power to influence the response factor. Moreover, the variance inflation factor (VIF) of model terms is equal to 1 which shows that the terms are fairly estimated due to poor multicollinearity. A total number of 26 experiments with 5 duplicates at the center were performed to measure the sum of square [Total sum of square (SST) = sum of square due to regression (SSR) + sum of square due to error (SSE)] using DOE 12.0. The observed and predicted response values of all the experiments have been described in Table 5.
[y = predicted response value, bo = regression equation constant, bi = linear coefficient, bii = square coefficient of each parameter, bij = first order interaction coefficient]
Table 4 Model terms and their significance.
| Term | Standard Error | VIF | Ri2 | Power (%) |
|---|---|---|---|---|
| A | 0.25 | 1 | 0 | 96.4 |
| B | 0.25 | 1 | 0 | 96.4 |
| C | 0.19 | 1 | 0 | 99.8 |
| AB | 0.35 | 1 | 0 | 76.0 |
| AC | 0.25 | 1 | 0 | 96.4 |
| BC | 0.25 | 1 | 0 | 96.4 |
| A2 | 0.26 | 1.017 | 0.017 | 99.9 |
| B2 | 0.26 | 1.017 | 0.017 | 99.9 |
Table 5. CCD matrix for performance parameters of biocomposite films
| Exp.no. | Filler content (%) | Filler size (µm) | Filler Type | Tensile strength(MPa) | Young’s modulus (MPa) | Elongation at break (%) | Impact strength (J/mm) | WVTR (g m-2 24h-1) |
ROD (weight loss%/day) |
Transparency (%transmittance/mm) |
Solubility (%) | ||||||||
|---|---|---|---|---|---|---|---|---|---|---|---|---|---|---|---|---|---|---|---|
| Actual | Predicted | Actual | Predicted | Actual | Predicted | Actual | Predicted | Actual | Predicted | Actual | Predicted | Actual | Predicted | Actual | Predicted | ||||
| 1 | 10 | 20 | Walnut shell | 43.72 | 39.99 | 351.68 | 348.14 | 6.37 | 6.32 | 30.46 | 29.45 | 1087.62 | 1081.23 | 39.09 | 41.51 | 57.32 | 56.62 | 25.42 | 23.80 |
| 2 | 8.54 | 12.93 | Walnut shell | 35.66 | 38.01 | 345.26 | 346.71 | 8.36 | 7.23 | 34.89 | 36.96 | 1017.69 | 1022.69 | 32.67 | 30.65 | 60.46 | 60.70 | 23.78 | 23.76 |
| 3 | 10 | 20 | Almond | 50.02 | 46.80 | 330.49 | 327.93 | 10.24 | 12.60 | 27.66 | 25.09 | 1167.89 | 1164.76 | 44.51 | 48.49 | 59.07 | 58.10 | 19.67 | 20.76 |
| 4 | 8.54 | 27.07 | Walnut shell | 30.15 | 33.63 | 326.42 | 330.84 | 9.42 | 9.28 | 30.62 | 33.05 | 1036.75 | 1043.98 | 36.48 | 33.52 | 60.02 | 57.84 | 25.68 | 26.61 |
| 5 | 5 | 10 | Walnut shell | 26.62 | 28.86 | 325.85 | 322.57 | 11.59 | 12.75 | 43.59 | 41.96 | 990.96 | 979.12 | 18.37 | 19.42 | 68.48 | 67.69 | 27.39 | 27.63 |
| 6 | 5 | 20 | Walnut shell | 26.85 | 25.76 | 322.71 | 318.50 | 14.07 | 14.20 | 40.06 | 39.46 | 1010.58 | 1008.78 | 20.94 | 20.32 | 65.29 | 65.67 | 29.79 | 29.65 |
| 7 | 8.54 | 12.93 | Almond | 43.04 | 44.82 | 322.21 | 325.36 | 14.56 | 13.0 | 31.06 | 32.69 | 1104.30 | 1105.91 | 40.69 | 36.97 | 61.78 | 62.18 | 20.03 | 20.72 |
| 8 | 5 | 20 | Walnut shell | 25.39 | 25.76 | 320.36 | 318.50 | 14.75 | 14.20 | 38.67 | 39.46 | 1008.07 | 1008.78 | 19.48 | 20.32 | 64.71 | 65.67 | 30.03 | 29.65 |
| 9 | 5 | 20 | Walnut shell | 25.99 | 25.76 | 317.52 | 318.50 | 13.35 | 14.20 | 40.06 | 39.46 | 1012.84 | 1008.78 | 19.78 | 20.32 | 64.29 | 65.67 | 29.68 | 29.65 |
| 10 | 5 | 20 | Walnut shell | 24.88 | 25.76 | 317.32 | 318.50 | 14.07 | 14.20 | 39.81 | 39.46 | 1010.69 | 1008.78 | 20.73 | 20.32 | 63.96 | 65.67 | 30.13 | 29.65 |
| 11 | 8.54 | 27.07 | Almond | 39.68 | 40.44 | 313.37 | 316.09 | 15.84 | 15.11 | 28.46 | 28.79 | 1117.32 | 1128.11 | 42.3 | 40.38 | 60.03 | 59.32 | 23.17 | 23.57 |
| 12 | 5 | 20 | Walnut shell | 22.64 | 25.76 | 312.54 | 318.50 | 13.44 | 14.20 | 41.59 | 39.46 | 1009.06 | 1008.78 | 19.09 | 20.32 | 64.66 | 65.67 | 29.96 | 29.65 |
| 13 | 5 | 30 | Walnut shell | 23.59 | 22.66 | 310.53 | 307.01 | 16.34 | 15.66 | 37.18 | 36 | 1031.86 | 1019.75 | 23.14 | 24.11 | 61.95 | 63.65 | 32.75 | 31.66 |
| 14 | 5 | 20 | Almond | 35.11 | 32.57 | 310 | 305.64 | 19.22 | 18.91 | 33.36 | 35.43 | 1090.06 | 1092.83 | 27.38 | 25.96 | 67.02 | 67.15 | 27.08 | 26.60 |
| 15 | 5 | 20 | Almond | 36.67 | 32.57 | 308.92 | 305.64 | 18.78 | 18.91 | 34.79 | 35.43 | 1089.61 | 1092.83 | 27.83 | 25.96 | 66.86 | 67.15 | 26.97 | 26.60 |
| 16 | 5 | 10 | Almond | 39.41 | 35.67 | 305.25 | 305.04 | 17.64 | 17.46 | 39.35 | 37.92 | 1061.68 | 1062.53 | 22.44 | 24.67 | 69.16 | 69.17 | 24.50 | 24.59 |
| 17 | 5 | 20 | Almond | 32.38 | 32.57 | 304.22 | 305.64 | 18.96 | 18.91 | 33.98 | 35.43 | 1090.42 | 1092.83 | 26.62 | 25.96 | 67.89 | 67.15 | 26.74 | 26.60 |
| 18 | 5 | 20 | Almond | 30.02 | 32.57 | 304.11 | 305.64 | 18.89 | 18.91 | 35.74 | 35.43 | 1095.75 | 1092.83 | 24.04 | 25.96 | 67.04 | 67.15 | 27.13 | 26.60 |
| 19 | 5 | 20 | Almond | 32.02 | 32.57 | 302.99 | 305.64 | 19.06 | 18.91 | 36.37 | 35.43 | 1090.94 | 1092.83 | 25.51 | 25.96 | 68.11 | 67.15 | 26.66 | 26.60 |
| 20 | 5 | 30 | Almond | 27.32 | 29.47 | 302.38 | 298.82 | 20.88 | 20.37 | 32.52 | 31.98 | 1118.24 | 1103.83 | 29.04 | 30.13 | 62.73 | 65.13 | 29.24 | 28.62 |
| 21 | 1.46 | 12.93 | Walnut shell | 18.81 | 17.89 | 287.44 | 291.90 | 20.39 | 20.93 | 31.28 | 31.87 | 1021.32 | 1062.46 | 27.6 | 27.15 | 73.41 | 73.50 | 32.89 | 34.25 |
| 22 | 1.46 | 27.07 | Walnut shell | 16.52 | 13.51 | 283.94 | 285.77 | 22.04 | 22.98 | 27.76 | 27.36 | 1057.64 | 1097.78 | 30.33 | 30.93 | 71.88 | 70.64 | 34.67 | 37.10 |
| 23 | 1.46 | 12.93 | Almond | 21.54 | 24.71 | 281.97 | 280.94 | 24.75 | 24.52 | 26.64 | 28.07 | 1167.46 | 1146.43 | 31.59 | 31.57 | 74.06 | 74.98 | 30.38 | 31.21 |
| 24 | 0 | 20 | Walnut | 14.08 | 11.54 | 281.35 | 277.51 | 27.68 | 25.69 | 19.79 | 21.83 | 1202.63 | 1147.41 | 38.41 | 37.21 | 77.25 | 74.72 | 39.52 | 38.63 |
| 25 | 1.46 | 27.07 | Almond | 19.02 | 20.32 | 277.26 | 281.41 | 25.89 | 26.58 | 22.09 | 23.57 | 1191.28 | 1182.65 | 36.08 | 35.28 | 73.23 | 72.12 | 32.09 | 34.06 |
| 26 | 0 | 20 | Almond | 17.22 | 18.35 | 272.63 | 272 | 28.37 | 28.83 | 21.38 | 18.14 | 1205.36 | 1231.98 | 41.36 | 41.50 | 75.96 | 76.20 | 38.47 | 35.59 |
2.4. Characterization of the films
2.4.1. Mechanical testing
Tensile and impact properties of the biocomposite films were determined as per ASTM D5938-96 and D256 standards using Instron tensile (Table top Tinius Olsen H50KS, India) and impact testing (Dynatup 9250 impact tester, India) apparatus respectively. Before testing, the samples were conditioned at room temperature (25±3OC) for 24 h. Tensile strength, Young's modulus of elasticity, and elongation at break was measured at a crosshead speed of 3 mm/min. In the case of impact test, the energy at peak load was used to calculate the impact strength of the specimens. The impact energy (J) was calculated from the dial gauge which is fitted on the machine. Five specimens were tested for each sample and their average values were reported.
2.4.2. Water vapor transmission rate (WVTR)
In food and pharmaceutical industries where moisture control is critical, WVTR test is performed to determine the permeability for vapor barriers. WVTR of composite films was measured in accordance with ASTM E 96/E 96M-14 standard using a digital thermos hygrometer (HM2021, India). Each sample was stored at 25oC in a desiccator to maintain a 75% relative humidity. The water-vapor permeability was determined from the weight gained on the permeation cell. For each sample, four specimens were tested and their average values were reported.
2.4.3. Rate of degradation (ROD)
The biodegradability of composite films was determined in the natural soil burial condition for 7 days. After burial, the specimens were dug out each day, washed in distilled water, and dried in an oven at 60±5oC for 24 h before undergoing weight loss. The weight loss was measured using a highly calibrated weighing machine (0.001 g accuracy, DTU (Delhi), India). Five measurements were conducted and their mean value was reported.
2.4.4. Transparency measurement
The transparency of starch-based films was measured using a UV spectrophotometer (UV5 Mettler Toledo, India). The sample was placed in 10 mm2 quartz glass cuvette for measurement. Optical transmittance and absorption values were recorded in the wavelength range of 200-400 nm. The data was presented in terms of % transmittance per mm.
2.4.5. Solubility in water
Film solubility was determined in terms of total dissolved matter (%TDM) in distilled water. Initially, the samples were dried in an oven at 60oC until the constant weight was obtained. After drying, the samples were immersed in 500 ml distilled water for 24 h at room temperature (27±4OC). The insoluble film matter was then dried at 60oC until a constant final weight. The %TDM was calculated using the following equation:
3. Results and discussion
In the present work, focused is on increasing the strength, degradability, and resistance of water vapor transmission of biocomposite films by optimizing the performance parameters using RSM technique. Table 5 represents the design matrix which was built using central composite design under a different set of performance parameters combining the experimental response results and predicted values of different response variables. Experimental response values were analyzed by developing mathematical models using Design Expert 12.0 software. In present work, quadratic and linear models were analyzed and selected according to two different tests-the sequential model sum of squares and lack of fit. Table 6 revealed that the quadratic model has maximum values of R2, adjusted R2, and predicted R2 with very fine concord with each other for Young’s modulus, elongation at break, impact strength, WVTR, ROD, and solubility. However, the linear model has maximum values of all these correlation coefficients for tensile strength and transparency. The predicted R2 is a reasonable agreement with adjusted R2 for the quadratic model in comparison to other ones. Moreover, the quadratic model exhibits smaller p-value with adequate precision proved that it gives an admirable classification among performance parameters and has a sufficient tendency to measures the signal to noise ratio.
Table 6 Summary of the models.
| Response | Model | Sequential p value | Lack of fit value | R2 | R2adj | R2pred | PRESS | Precision | Remarks |
|---|---|---|---|---|---|---|---|---|---|
| Tensile strength (MPa) | Linear | <0.0001 | 0.2668 | 0.9338 | 0.9248 | 0.9039 | 205.57 | Sufficient | Suggested |
| 2FI | 0.2706 | 0.2902 | 0.9459 | 0.9288 | 0.8841 | 247.83 | Insufficient | ||
| Quadratic | 0.5349 | 0.2502 | 0.9497 | 0.9261 | 0.8619 | 295.32 | Insufficient | ||
| Cubic | 0.4349 | 0.1950 | 0.9650 | 0.9271 | 0.6955 | 651.19 | Insufficient | Aliased | |
| Young’s modulus (MPa) | Linear | <0.0001 | 0.0691 | 0.9402 | 0.9320 | 0.9134 | 858.31 | Insufficient | |
| 2FI | 0.0468 | 0.1389 | 0.9602 | 0.9477 | 0.9107 | 885.01 | Insufficient | ||
| Quadratic | 0.0215 | 0.1712 | 0.9607 | 0.9509 | 0.9255 | 738.36 | Sufficient | Suggested | |
| Cubic | 0.9141 | 0.1205 | 0.9774 | 0.9528 | 0.7812 | 2168.37 | Insufficient | Aliased | |
| Elongation at break (%) | Linear | <0.0001 | 0.0004 | 0.9567 | 0.9509 | 0.9349 | 54.01 | Insufficient | |
| 2FI | 0.3699 | 0.0004 | 0.9632 | 0.9516 | 0.9155 | 70.17 | Insufficient | ||
| Quadratic | 0.0159 | 0.0025 | 0.9766 | 0.9707 | 0.9391 | 50.56 | Sufficient | Suggested | |
| Cubic | 0.0009 | 0.0584 | 0.9953 | 0.9902 | 0.9489 | 42.44 | Insufficient | Aliased | |
| Impact strength (J/mm) | Linear | 0.0616 | <0.0001 | 0.2788 | 0.1805 | -0.0512 | 1065.16 | Insufficient | |
| 2FI | 0.9997 | <0.0001 | 0.2792 | 0.0516 | -0.5243 | 1544.57 | Insufficient | ||
| Quadratic | <0.0001 | 0.0617 | 0.9394 | 0.9279 | 0.8909 | 110.52 | Sufficient | Suggested | |
| Cubic | 0.4667 | 0.0142 | 0.9579 | 0.9122 | 0.4741 | 532.91 | Insufficient | Aliased | |
| WVTR (g m-2 24 h-1) | Linear | <0.0006 | <0.0001 | 0.5416 | 0.4791 | 0.3128 | 73740.32 | Insufficient | |
| 2FI | 0.9979 | <0.0001 | 0.5426 | 0.3981 | 0.0337 | 1.037E+05 | Insufficient | ||
| Quadratic | 0.0001 | <0.0001 | 0.9179 | 0.9022 | 0.8436 | 16784.83 | Sufficient | Suggested | |
| Cubic | 0.8796 | <0.0001 | 0.9314 | 0.8572 | -0.0919 | 1.172E+05 | Insufficient | Alliased | |
| ROD (weight loss%/day) | Linear | 0.1849 | <0.0001 | 0.1932 | 0.0832 | -0.1691 | 1947.92 | Insufficient | |
| 2FI | 0.9959 | <0.0001 | 0.1958 | -0.0582 | -0.6819 | 2802.20 | Insufficient | ||
| Quadratic | <0.0001 | 0.0308 | 0.9479 | 0.9379 | 0.9079 | 153.48 | Sufficient | Suggested | |
| Cubic | 0.1822 | 0.0233 | 0.9743 | 0.9465 | 0.6923 | 512.68 | Insufficient | Alliased | |
| Transparency (%transmittance/mm) | Linear | <0.0001 | 0.0029 | 0.9528 | 0.9464 | 0.9305 | 51.18 | Sufficient | Suggested |
| 2FI | 0.9238 | 0.0016 | 0.9540 | 0.9395 | 0.8954 | 77.04 | Insufficient | ||
| Quadratic | 0.0597 | 0.0031 | 0.9670 | 0.9514 | 0.9005 | 73.30 | Insufficient | ||
| Cubic | 0.0005 | 0.1955 | 0.9938 | 0.9871 | 0.9463 | 39.55 | Insufficient | Aliased | |
| Solubility (%) | Linear | <0.0001 | <0.0001 | 0.9330 | 0.9239 | 0.8953 | 59.76 | Insufficient | |
| 2FI | 0.5272 | <0.0001 | 0.9403 | 0.9214 | 0.8501 | 85.58 | Insufficient | ||
| Quadratic | 0.0342 | <0.0001 | 0.9483 | 0.9385 | 0.9022 | 55.83 | Sufficient | Suggested | |
| Cubic | 0.3751 | <0.0001 | 0.9731 | 0.9439 | 0.5766 | 241.72 | Insufficient | Aliased |
3.1. Effect of performance parameters on tensile properties
Effect of different performance parameters on tensile properties of starch-based films is revealed in Figure 2-4. In both cases (walnut and almond shell), the tensile strength and modulus of composite films was increased with the increase of filler content and decrease of filler size. However, the % elongation at break was reduced with the addition of shell particles. This shows that both shells have significant power to strengthen the starch matrix. The maximum tensile strength (43.04 MPa) and modulus (345.26 MPa) was obtained at 8.54 wt.% filler content with 12.93 µm particle size as shown in Figures 2-3. A homogeneous dispersion of shell particles in matrix was resulted with the decrement of filler size. Furthermore, the fine particles possess better wettability & uniform dispersion than the coarse one. The dispersion of rigid particles in the matrix constrains the movement of polymeric chains that results in improved stiffness of the films. It was observed that the almond filler reinforced films possess higher strength and % elongation at break than the walnut filled ones and this is due to the presence of higher cellulose content in almond shell. The hydrogen-bonded network of cellulose with starch in the composite results in an effective load transmission from the matrix to filler. The tensile strength of starch film was increased by 205.68% with the reinforcement of 8.54 wt.% almond shell particles. The walnut strengthened films have higher modulus as compared to almond-based films and it was attributed to the presence of higher lignin content in walnut shell.


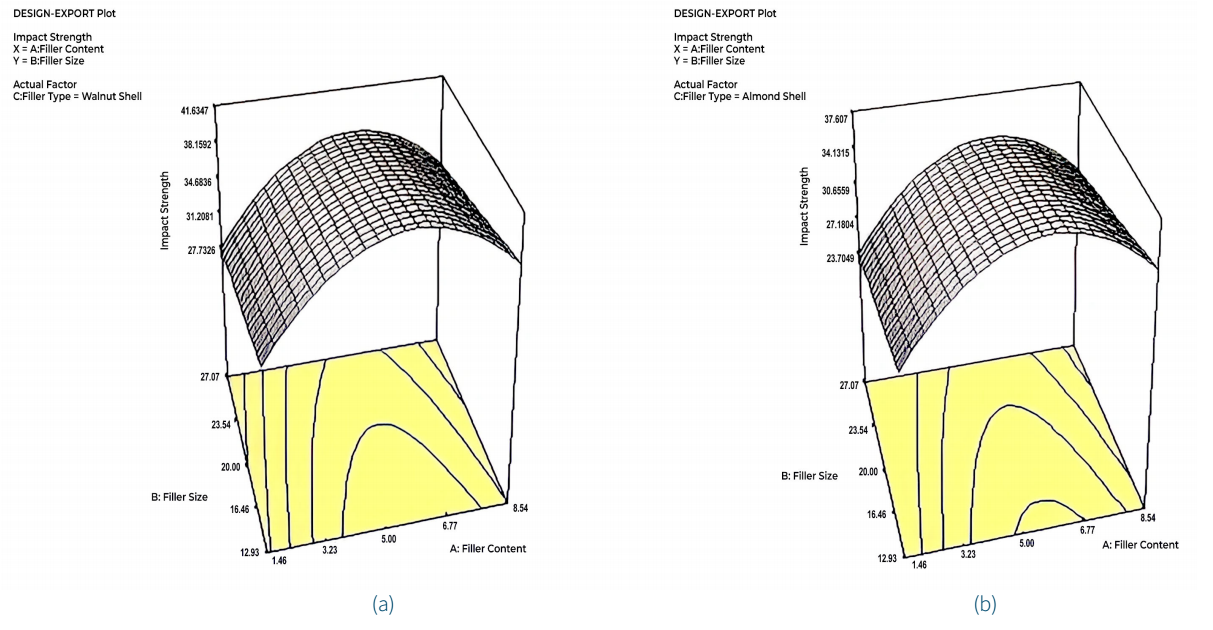
3.2. Effect of performance parameters on impact strength
Figure 5 illustrates the effect of three critical parameters (filler type, size, and content) on the impact strength of composite films. The impact strength was increased with the increase of filler content up to 5 wt.% and decrease of filler size. The maximum impact strength (41.39 J/mm) was obtained at 5 wt.% filler content with 12.93 µm particle size. The decrease in impact strength at higher concentration of shells and higher particle size is due to the accumulation of fillers in the starch matrix which results in poor stress transfer efficiency from matrix to fillers. It was observed that the walnut strengthened films possess higher impact strength than the almond-based films.
3.3. Effect of performance parameters on water vapor transmission rate (WVTR)
Figure 6 shows the effect of different performance parameters on WVTR of composite films. The WVTR of starch films was reduced by the incorporation of shell particles. This was due to the crystalline structure and higher mass density of both shells. The film barrier properties were improved with the decrease of filler size, but with the increase of filler content up to 5 wt.%. Beyond addition of fillers, the agglomeration takes place which results in little increase of WVTR. However, these values were too much lower than the virgin starch film. The walnut shell reinforced films possess better resistance to penetration of water molecules than the almond films. It was attributed to the presence of higher hydrophobic lignin compound (30.1%) in a walnut shell. The minimum WVTR (988.43 g m-2 24 h-1) was obtained at 5 wt.% walnut filler content with 12.93 µm particle size.

3.4. Effect of performance parameters on rate of degradation (ROD)
Figure 7 revealed the effect of different performance parameters on ROD of starch-based composite films. The biodegradability of starch films was reduced by the incorporation of walnut and almond shell fillers. However, the composite films reinforced with large size particles (≥20 µm) and higher filler content (≥8.54 wt.%) exhibit faster decomposition in the natural soil environment than the pure starch films. It was attributed to the presence of higher cellulose content which may result in easy entrapment of water molecules, depolymerization, and chain scission effects. ROD of composite films was increased with the increase of shell particle size and it was due to the formation of void spaces and improper wetting of coarse particles. The almond shell strengthened films possess higher rate of degradation than the walnut filler-based films. The maximum ROD (42.30 weight loss%/day) was obtained at 8.54 wt.% almond filler content with 27 µm particle size.

3.5. Effect of performance parameters on transparency
UV portion of retail lighting could play an important role to affect the quality of packaged food because of its high energy. Typical UV damage to foods is often due to the auto-oxidation of fats, which is directly induced by energy input from light. Therefore, an ideal food packaging film should absorb UV light as much as possible in order to guarantee maximum protection of packaged food. In this context, the transparency of developed films was analyzed in the wavelength range of 200-400 nm. Figure 8 shows the effect of the addition of shell particles, in different sizes and ratios, on transparency of starch-based films. It was observed that the transparency of the films was decreased considerably with the increase of filler size and filler volume content. This could be due to agglomeration tendency of filler that prevented UV light transmittance. The transparency of almond filler reinforced films is higher than the walnut shell filled films. After the addition of shell particles, the transparent film solution was changed into a yellowish color and it was due to the pale yellow color of the shell particles.

3.6. Effect of performance parameters on solubility
Figure 9 shows the effect of different performance parameters on water solubility of starch films. It was noticed that the percent film solubility in water was decreased with the decrease of filler size and increase of filler content. Lower solubility of shell reinforced films can be attributed to better interfacial compatibility between filler particles and starch matrix. The almond filler reinforced films possess lower solubility than the walnut filled ones and this is due to the presence of higher cellulose content in almond shell. The hydrogen-bonded network of cellulose with starch in the composite results in the increase cohesiveness of starch matrix.

3.7. ANOVA models
This work is primarily focused on improving the performance of starch-based composite films by the optimization of three critical parameters - filler type, size, and content. The range of each parameter was selected as per the literature review and reported in Table 2. The design matrix (Table 5) was developed using RSM based central composite design (CCD) in design expert 12.0 software. Responses in terms of tensile strength, Young’s modulus, impact strength, WVTR, ROD, transparency, and solubility of films were determined by performing experiments according to Table 5. For each response, the various mathematical models (Linear, 2FI, Quadratic, and Cubic) were generated and after evaluation it observed that the quadratic model is best fit for Young’s modulus, elongation at break, impact strength, WVTR, ROD, and solubility but linear is for tensile strength and transparency. The coded equation for each response is mentioned below:
These equations can be used to predict the responses and for identifying the relative impact of each parameter. The coefficient of the term in the developed equation represents the expected change in response per unit change in parameter value when all other parameters remain constant. The significance of each model term in equations (3) - (10) was checked using F and P tests. If p value of the model term is less than 0.05 then it means the term is significant. The model F (103.49) and p (<0.0001) values for tensile strength, F (97.77) and p (<0.0001) values for Young’s modulus, F (166.68) and p (<0.0001) values for elongation at break, F (81.38) and p (<0.0001) values for impact strength, F (58.68) and p (<0.0001) values for WVTR, F (95.44) and p (<0.0001) values for ROD, F (148.18) and p (<0.0001) values for transparency, F (96.33) and p (<0.0001) values for solubility indicates that the models were significant.
In this work, the numerical optimization method was used to generate optimal conditions of each parameter for enhancing the film performance. Table 7 shows the optimization criteria and importance level for each desired response. Since the film was developed for food packaging applications, it is greatly expected that the film exhibits high resistance to moisture transmission with better strength and degradability. Therefore, the tensile strength & WVTR of biocomposite films get the highest importance level followed by other responses. According to the predefined goal and importance level, the optimum value of each parameter is shown in Figure 10. To validate the RSM model, a minimum of four samples were developed at the above obtained optimum value of performance parameters. The obtained results (Table 8) were found close to the above predicted values. Thus, from experimental results confirm that the model is reliable and highly significant for this problem.
Table 7 Optimization criteria and importance level.
| Response | Lower value | Upper Value | Goal | Importance level |
|---|---|---|---|---|
| Tensile strength (MPa) | 14.08 | 50.02 | Maximize | ***** |
| WVTR (g m-2 24 h-1) | 990.06 | 1205.36 | Minimize | ***** |
| ROD (weight loss %/day) | 18.37 | 44.51 | Maximize | **** |
| Solubility (%) | 19.67 | 39.52 | Maximize | **** |
| Young’s modulus (MPa) | 272.63 | 351.68 | Maximize | **** |
| Elongation at break (%) | 6.37 | 28.37 | Maximize | *** |
| Impact strength (J/mm) | 20.06 | 39.05 | Maximize | *** |
| Transparency (% transmittance/mm) | 57.32 | 77.25 | Minimize | *** |

Table 8 Experimental results at optimum values of performance parameters.
| Response | Test 1 | Test 2 | Test 3 | Test 4 | Mean |
|---|---|---|---|---|---|
| Tensile strength (MPa) | 32.68 | 33.01 | 32.89 | 33.23 | 32.95 |
| WVTR (g m-2 24 h-1) | 1038.67 | 1040.36 | 1039.26 | 1041.04 | 1039.83 |
| ROD (weight loss %/day) | 30.41 | 31.66 | 31.43 | 30.96 | 31.12 |
| Solubility (%) | 26.89 | 27.31 | 27.09 | 27.99 | 27.32 |
| Young’s modulus (MPa) | 335.18 | 332.08 | 333.89 | 335.03 | 334.05 |
| Elongation at break (%) | 9.87 | 9.92 | 9.88 | 9.85 | 9.88 |
| Impact strength (J/mm) | 33.97 | 34.37 | 33.79 | 34.06 | 34.05 |
| Transparency (% transmittance/mm) | 57.75 | 58.86 | 56.99 | 58.45 | 58.01 |
4. Conclusions
RSM optimization tool is used to improve the performance of starch-based composite films. The various mathematical models were generated and compared for the best fit on experimental results. The quadratic model was found to be suitable and showed reasonable agreement in correlation coefficients (R2, adj. R2, pred. R2) for Young’s modulus, elongation at break, impact strength, WVTR, ROD, and solubility but the linear model is for tensile strength and transparency response. The experimental results and coded mathematical equations concluded that the filler type, size, and content are significant parameters that can positively affect the performance of starch films. Most of the desirable properties [tensile strength, Young’s modulus, impact strength, water vapor transmission rate (WVTR), and opacity] of starch-based composite films were improved with the increase of filler content. The numerical optimization method was used to find out the optimum values of input and response parameters which are reported as filler content: 8.11 wt.%, filler size: 27.07 µm, filler type: walnut shell, tensile strength: 32.43 MPa, Young’s modulus: 333.338 MPa, elongation at break: 9.90 %, impact strength: 34.12 J/mm, WVTR: 1040.40 g m-2 24 h-1, ROD: 31.6918 weight loss%/day, transparency 58.60 %transmittance/mm, and solubility 27.06%. RSM based central composite design can be used intelligently for designing the experiments and optimization of product and process parameters.

