


 nova página do texto(beta)
 Inglês (pdf)
 Artigo em XML
 Referências do artigo
 Enviar este artigo por email
 Citado por SciELO
  Similares em
SciELO
Similares em
SciELO 
 Permalink
1. Introduction
Corrosion is a relevant economic and performance topic for several industries. Data from the International Measures of Prevention, Application, and Economics of Corrosion Technologies (IMPACT) study in 2016 indicates a global cost of corrosion of US$2.5 trillion (Koch et al., 2016). Such losses represented 3.4% of the global gross domestic product (GDP) in 2013. One of the most useful corrosion resistance metallic materials is Al and Al-based alloys. Annually, 45 million tonnes of semi-fabricated Al-based products are produced with 14 million tonnes of recycled aluminum (Das & Yin, 2007). The use of aluminum and its alloys has a high impact in industries as automobile, aeronautic, pressure containers, military, beverage cans, and construction, among others (Das & Yin, 2007). Like many other metallic materials, Al-based alloys are prone to corrosion in NaCl-containing environments. Therefore, developing Al-based materials with reduced corrosion susceptibility may play an essential role in decreasing the economic losses and increasing the efficiency of industrial components.
Several reports of corrosion studies in Al-based alloys have been developed. Considering that the corrosion resistance of Al-alloys is lower than in pure Al, while mechanical properties are better in the first ones, several works have reported the efficiency of superficial organic or inorganic corrosion inhibitors applied to Al-alloys (Hamadi et al., 2018; Nardeli et al., 2019; Umoren et al., 2019; Xhanari & Finšgar, 2019). Another route for corrosion control is to change the chemical composition of Al-based alloys (Berlanga-Labari et al., 2020; Knight et al., 2010; Osório et al., 2011; Öztürk et al., 2018; Zor et al., 2010). The first option requires extra-processing steps after the manufacturing stage, reducing the cost-benefit of the product, while the second option (chemical composition) may affect the mechanical and physical performance of the final alloy. The third route to control corrosion is through microstructural changes during the manufacturing stage. Structural defects such as grain boundaries have been widely reported as strongly related to corrosion susceptibility due to alterations in superficial reactivity (Ralston & Birbilis, 2010). Nonetheless, the relationship between grain refinement and corrosion is unclear for Al and Al-based alloys. For instance, some reports support an inverse relationship between corrosion resistance and grain size in Al-6063 alloy after Friction Stir Processing (Mahmoud, 2008), for Al-1050 alloy and pure Al after equal channel angular pressing (ECAP) (Chung et al., 2004; Song et al., 2009), or in Al-1050 alloy after continuous close die forging (CCDF) (Rodríguez et al., 2020). An improvement in pitting resistance associated with grain refinement was reported (Chung et al., 2004; Rodríguez et al., 2020; Song et al., 2009). However, a proportional relationship between corrosion resistance and grain size was reported for as-cast 99.9% Al (Osório et al., 2005). Besides, for the Al-5083 alloy obtained by hot isostatic pressing (HIP) and extrusion, less intergranular corrosion resistance and less fraction area of pitting in the nanocrystalline sample than in the coarse structure were observed (Sikora et al., 2004). Another report in Al-5083 alloy produced by HIP and extrusion (Kus et al., 2006) indicated similar electrochemical behavior on coarse-grain and nanocrystalline microstructures. In general terms, there is not a consensus about the effect of grain size on the corrosion behavior of Al-alloys (Miyamoto, 2016). Nevertheless, all previous references indicate a strong corrosion dependence on alloy processing. To the best of our knowledge, the effect of repetitive corrugation and straightening (RCS) (a severe plastic deformation process for flat products) on corrosion of Al-based alloys has not been studied. Besides, the electrochemical behavior of samples without the same grain size clusters has not been explicitly reported. Based on the above, this work aims to study the corrosion performance of an Al-7075 alloy (AA7075) processed by RCS. The results were explained in terms of crystallographic orientation and microstructural features.
2. Materials and methods
2.1. RCS processing
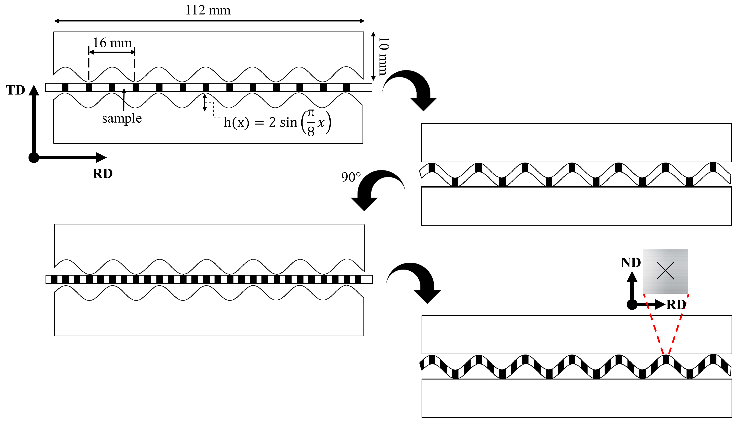
Commercially available AA7075-T4 with chemical composition: Al-5.3Zn-2.2Mg-1.8Cu-0.3Fe-0.28Cr-0.06Ti-0.01Ni in wt.%, was used as reference material. Initial plates of 12.5 mm in thickness underwent a four-stage heat treatment to facilitate the rolling process. The four stages were: 1) heating up to 420 °C and then holding the temperature for 2 h, 2) air-cooling until room temperature, 3) heating up to 230 °C and then keeping the temperature for 2 h, and finally, 4) air-cooling down to room temperature. Later, the plates were cold-rolled down to a thickness of 1 mm. A heat treatment at 450 °C for 2 hours and slow cooling within the furnace was applied to obtain an initial homogeneous texture on the 1mm sheets. Samples with a 120 mm × 120 mm × 1 mm geometry were processed by RCS at room temperature. An Instron 8802 hydraulic press with a nominal capacity of 200 kN was used for this purpose. Polytetrafluoroethylene sheets with 0.39 mm in thickness were used to reduce the friction coefficient between the sample and die walls. The geometry of the two D2 steel RCS dies based on sinusoidal profiles for the corrugation stages can be observed in Fig. 1. The straightening steps of the RCS process were carried out between two flat dies. As indicated in Fig. 1, the processed sheets were rotated 90° around the transversal axis to alternate the most deformed zone between each corrugation stage. Every set of corrugation - straightening - 90° rotation - corrugation - straightening is defined as one RCS pass. The effective strain for each RCS pass equals 0.8 in the most deformed zones (Elizalde et al., 2020). Samples were identified as 0R, 1R, 2R, 3R, and 4R, corresponding to the number of RCS passes.
2.2. Microstructural evaluation
The microstructure of the as-received and RCS processed samples was examined after standard metallographic preparation. To obtain a mirror finishing appearance, polishing down to 0.1 µm diamond solution in particle size was carried out. Morphological, microstructural, and energy dispersive X-rays spectroscopy (EDS) observations were accomplished by means of a scanning electron microscope (SEM-Jeol 7600F). The XRD measurements were performed using a D2 Phaser Bruker diffractometer, with Cu-Kα radiation, 30 KV, and 10 mA as voltage and current conditions. The measurements were collected in a 2θ range from 20° to 120° with step intervals of 0.02° each 10 s. For texture analysis, pole figures of (111), (200) and (220) planes were obtained using a scanning range of α(0°-90°) and β(0°-360°). A Rigaku Ultima IV diffractometer, with Cu-Kα radiation, crossbeam optics, 40 kV and 44 mA, with a step size of 0.02° and a scanning speed of 0.07°min−1 was used. The experimental pole figures and orientation distribution functions (ODF) were calculated with the 3D Explore 2.5 software and MTEX 5.6 (MATLAB toolbox R2020b) with 15° as deviation angle. For corroborating a good match between the experimental ODFs and the identified texture components, the ideal location of such components on the Euler space was simulated by MTEX. For electron backscattering diffraction (EBSD) analysis, samples were prepared using conventional metallographic preparation, followed by vibratory polishing with a VibroMet 2 machine, using a colloidal silica solution with a particle size of 0. 3 µm. Ultrasonic cleaning was used for removing surface impurities. The EBSD analysis was carried out in a Jeol JSM-7001F scanning electron microscope with a Bruker Quantax EBSD detector (15 KV). The morphology of the precipitates was observed using a JEOL ARM200F transmission electron microscope (TEM).
2.3. Electrochemical evaluation
The electrochemical behavior of processed samples was investigated by using electrochemical impedance spectroscopy (EIS). Samples were subjected to standard metallographic procedures. All the electrochemical tests were conducted three times for reproducibility criteria. The solution was 3.5 wt.% NaCl solution during 552 hrs. The EIS measurements were carried out on Autolab PGSTAT 302N using the three-electrode system. A saturated calomel electrode was used as the reference electrode, a platinum tip served as the auxiliary electrode, and the third electrode was the AA7075. A sinusoidal perturbation of 10 mV amplitude and a frequency sweep from 106 to 10-1 Hz was applied. The Kramers-Kronig algorithm was used on the measurements to validate the causality, linearity, and stability of the EIS data. The charge transfer resistance (Rt) and the corrosion rate in mils per year (mpy) were calculated from the EIS test using an equivalent circuit with the commercial ZView software.
The corrosion products morphological study was carried out by using a scanning electron microscope, Jeol model JMC 6000. The corrosion products XRD measurements were obtained using a Rigaku Ultima IV diffractometer, with Cu-Kα radiation, crossbeam optics, 40 KV and 44 mA (voltage and current, respectively).
3. Results and discussion
3.1. Microstructural evaluation
In order to characterize phase composition, morphology and size of precipitates of the AA7075, XRD, SEM-EDS, and TEM techniques were employed. Fig. 2 shows the microstructures and phases of the 0R, 1R, and 4R conditions. XRD measurements of Fig. 2a show the presence of three main phases in the current AA7075. Those phases were the Al-matrix, Al2CuMg, and MgZn2 metastable (η'). Nevertheless, a fourth component (η) was additionally observed by SEM. The globular morphology of Al2CuMg particles is shown in Fig 2b, while the η and η'precipitates (rods and globular particles, respectively) are shown in Fig. 2c. The low content of η could be the reason why this phase was not noticeable by XRD. As a general trend, the phase morphology and size remained similar along with the four RCS passes.
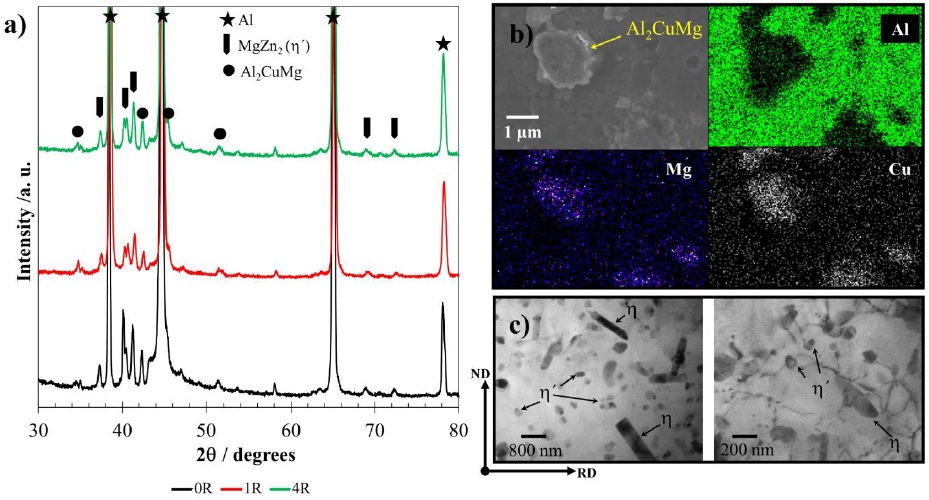
Figure 2 a) Identification of main phases in AA7075 by XRD for 0R, 1R and 4R samples. b) SEM-EDS mapping of Al2CuMg and c) Morphology of ( and (' precipitates by TEM.
The EBSD images correspond to samples 0R, 1R, and 4R and are displayed in Fig. 3. The grain refinement was noticed from the first RCS pass, i.e., the grain size was reduced from a micrometric size, in the initial condition, to ultra-fine sizes (down to 1 (m) for the most deformed zones of the 4R sample. From the inverse pole figure analysis shown in Fig. 3a, it is apparent that most grains are oriented towards the [011] and [001] directions irrespective of the number of RCS passes. However, new orientations appear when increasing the RCS passes.
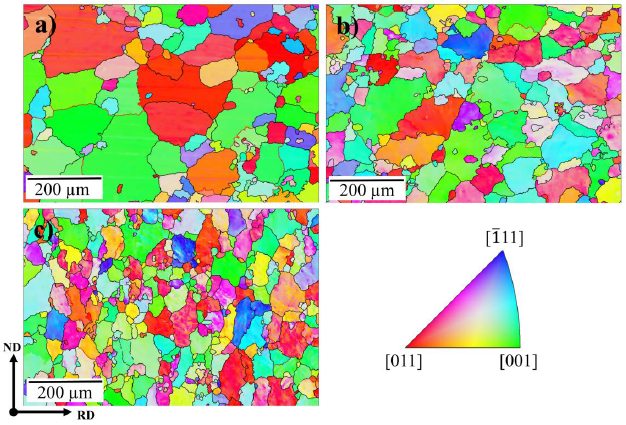
Figure 4 displays the uncorrelated (Fig. 4a, d, g) and correlated (Fig. 4b, e, h) misorientation histograms, as well as the boundaries grain fraction, according to their misorientation (Fig. 4c, f, i). Both uncorrelated and correlated histograms are relatively similar for the 0R sample. Such similarity supports the absence of deformation within the grains on the initial condition sample (Obbard et al., 2006). After the first RCS pass (1R), the correlated and uncorrelated histograms started to differ, indicating the occurrence of polygonization processes (Obbard et al., 2011). The difference between both histograms increases in the 4R sample with further deformation, suggesting a high substructure formation. The uncorrelated histogram profile of the 4R sample is consistent with the Mackenzie misorientation distribution for nearly random textured face-centered cubic materials (Mackenzie, 1958). The Mackenzie distribution in the fourth RCS deformation pass is also congruent with Fig. 3c, where the grains do not show a preferred orientation. On the other hand, by comparing the nature of the grain boundaries for 0R, 1R and 4R samples (Fig. 4c, f, i), the increment of low-angle grain boundaries (LAGB) as a function of the applied deformation is evident. A 9.8% grains fraction corresponds to LAGB’s for the 0R sample, whereas a LAGB of 31.9% was observed for sample 4R. These results indicate the increasing subgrain structure formation at higher deformation passes (Huang et al., 2001).
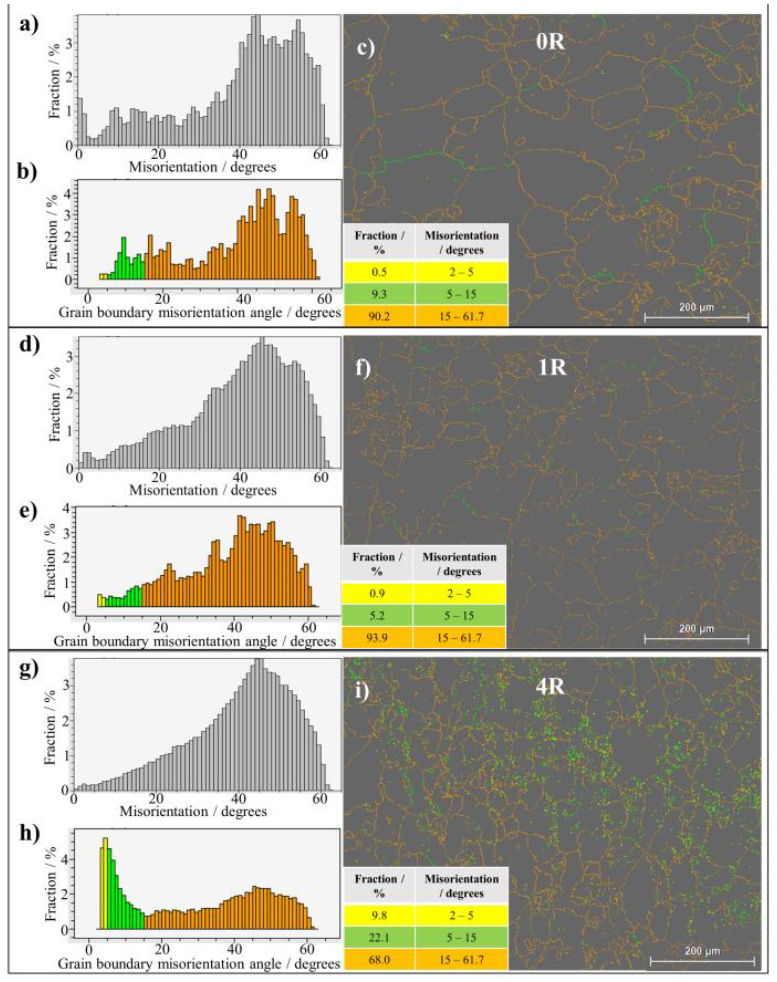
Figure 4 EBSD a,d,g) uncorrelated and b,e,h) correlated misorientation histograms, as well as c,f,i) micrographs with grain boundaries colored following the data shown in the embedded table for the studied samples.
To further understand the RCS process effect on the microstructure, Fig. 5 shows the evolution of the peak broadening of the XRD peaks corresponding to planes (422) and (420). By observing the increment of the full width at half maximum (FWHM) from the first RCS pass and considering the sensibility of the XRD technique for detecting nanostructure formation, it is clear that this process also promotes the formation of nanograins. It is well known that peak broadening depends on various factors as dislocation density, microstresses, gran- and subgrain- boundaries, crystalline smallness, etc. (Ungár, 2004; Williamson & Hall, 1953). The relatively constant values of FWHM for 1R and 4R samples might be related to the combined effect of the increment of dislocations during cold deformation and its partial annihilation after the fourth RCS pass (Kumar & Raghu, 2015).
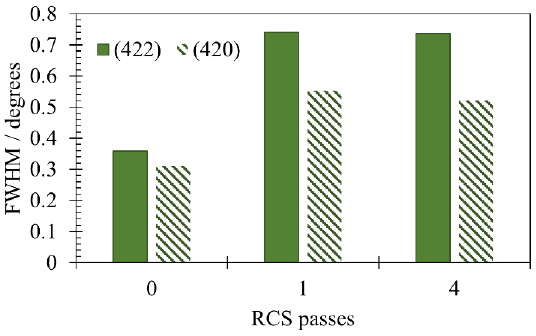
Figure 5 Full-width at half maximum (FWHM) as a function of the RCS passes for the XRD (422) and (420) Al-planes.
Figure 6 shows the orientation distribution functions (ODF) and the simulated suggested texture components. From the initial condition, the texture components were different from the rolling textures (El-Danaf, 2012), which can be associated with the recrystallization process that occurred during the heat treatment. This can be confirmed by the presence of Cube orientation, which is known to be related to recrystallized grains in materials with high stacking fault energy (SFE) like Al (Hutchinson, 2012; Kestens & Pirgazi, 2016). Four other texture components were also identified in all samples. Their intensity decreased when increasing the deformation values.
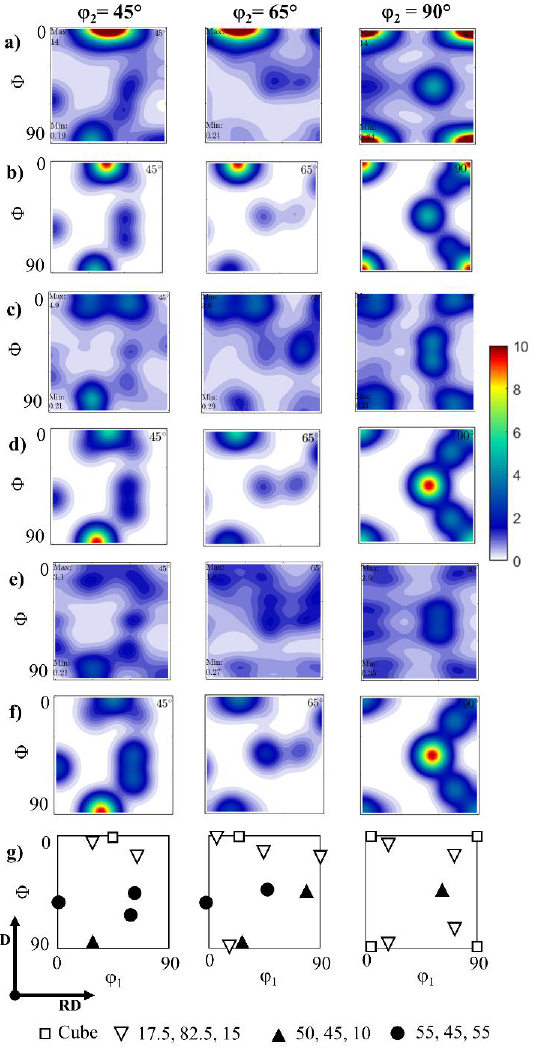
Figure 6 a,c,e) Experimental and b,d,f) simulated Orientation Distribution Functions (ODFs) of a,b) 0R, c,d) 1R, e,f) 4R samples, and g) key positions of texture components.
These results can be observed in Table 1, which includes the volume percentage of the main texture components found for 0R, 1R and 4R samples; the rest of the grains have no discernible preferred orientation. The ideal Miller orientation notations of the main texture components were identified as {011} <111> (TC1), {130} <311> (TC2) and {435} <175> (TC3) as shown in Table 1. All ODFs (Fig. 6a, c, e) showed a good match with those simulated (Fig. 6b, d, f). As mentioned above TC1, TC2 and TC3 do not correspond to common rolling texture components. This observation could be related to the following two factors: i) the rotation applied for each RCS pass and ii) the formation of nano-metric grains. The first factor promotes a change in the slip system (Huang et al., 2001), which plays an important role in the resulting texture (Gurao et al., 2011; Selvan et al., 2020; Souza & Monlevade, 2021), whilst the second factor increases the number of grain boundaries, becoming relevant for the grain boundary deformation mechanisms (Gu et al., 2014). These two factors resulted in a continuous disruption of subgrain structures between the deformation passes, as previously observed in Fig. 4.
Table 1 Texture components percentage of the 0R, 1R, and 4R samples
| Identification |
Bunge notation φ1 , Φ, φ2 |
Miller Indices |
Fraction / % | ||
|---|---|---|---|---|---|
| {hkl}<uvw> | 0R | 1R | 4R | ||
| Cube | 0, 0, 0 | {001}<100> | 13.7 | 5.3 | 2.8 |
| TC1 | 50, 45, 10 | {011}<111> | 14.0 | 18.9 | 14.5 |
| TC2 | 17.5, 82.5, 15 | {130}<311> | 13.9 | 14.4 | 10.6 |
| TC3 | 55, 45, 55 | {435}<175> | 9.7 | 7.9 | 10.8 |
The lower intensity of some texture components (Fig. 6) when the deformation increased was consistent with the uncorrelated misorientation histogram for the 4R sample, being congruent with the observed in Fig. 4g. This suggests a microstructure with predominant randomly oriented grains, consistent with the reduction of preferred orientation when the slip system changed (Gurao et al., 2011). It was also noticed that, while the cube texture intensity decreased, the other three texture components remained almost constant. The decrement of cube texture intensity when increasing the applied deformation agrees well with several reports related to rolled Al-based alloys (Martins et al., 2012; Jayaganthan et al., 2010; Liu et al., 2004). This phenomenon could be related to the formation of defects from the first RCS process, which influences the generation of new texture components (Engler, 2001).
3.2. Electrochemical assessment
The EIS measurements were obtained for analyzing the effect of the RCS technique in the electrochemical behavior of the processed samples. The Nyquist graph for the 0R condition (Fig. 7a) shows a capacitive-resistive semicircle from 106 Hz to ( 10-1 Hz; however, a single-inductive loop was observed from 10-1 Hz to 10-2 Hz at specific immersion times. As previously reported (Huang et al., 2016), this inductive-like behavior was related to the formation of a passive film on the aluminum surface. The reduction of the arc-radius inductive loop could be explained in terms of lower corrosion resistance as a function of time, as observed during the 384 hours of testing. However, after 552 h, the restoration of the passive layer with higher corrosion resistance (≈ 104 ohm-cm2) was observed at the Bode impedance diagram at 10-2 Hz. The electrochemical behavior of 1R and 4R conditions exhibited similar features to the 0R condition, except for the formation of incipient diffusion-like behavior observed at lower frequencies after 384 h of testing. The 1R condition showed better electrochemical stability than the 4R sample, being observed on the Bode diagrams for impedance values (Fig. 7d, f). The enlarged plots in Fig. 7a, c, e showed the drop of the corrosion resistance versus time, indicating the formation of non-stable corrosion products on the surface (C. Wang et al., 2019). Since the inductive loop suffered changes in its morphology during the test, the 0R condition exhibited electrochemical instability on the aluminum oxide. This behavior confirmed the continuous dissolution of the underlying metal (Song et al., 2009). However, the EIS results of the 1R condition remained almost constant during the immersion test for all frequencies. Moreover, all the EIS measurements revealed higher impedance values (at high frequencies) from 0 h testing (see enlarged plots). In the 4R condition, changes in both the semicircles diameters and the morphology of the EIS spectra at lower frequencies suggested continuous surface modifications during the test. Considering all the EIS results, it was observed a positive effect of the RCS processing on the electrochemical stability of the AA7075 after one deformation pass. The charge transfer resistance (Rt) using the electric equivalent circuit (EEC) was calculated to corroborate the effect of the RCS on the corrosion resistance of the samples (Huang et al., 2016). This EEC is enclosed on the Bode plots of Fig. 7, where Rs is the solution resistance, Rt is the charge transfer resistance, and CPE is the constant phase element considering that the RCS samples are not entirely flat and their surface shows a rugosity profile. For this reason, it was not used a single capacitance parameter. The WS represents the diffusion-like behavior mainly for 1R and 4R. The inductive loop behavior was not fitted because this phenomenon is not required for the Rt calculation. All the EIS measurements were validated with the Kramers-Kronig (KK) algorithm. At 552 h of testing, the KK validation determined the values listed in Table 2. These values indicated that the statistical error was extremely low, which means that all the EIS data were correlated among the impedance, the real, and the imaginary parts. Thus, the EIS measurements comply with the assumptions of the algorithm. On the other hand, the average Rt value for the entire testing (552 h) was also reported in Table 2. It was observed that the 1R sample exhibits the highestcharge transfer resistance to corrosion, which corroborated the positive effect of the RCS.
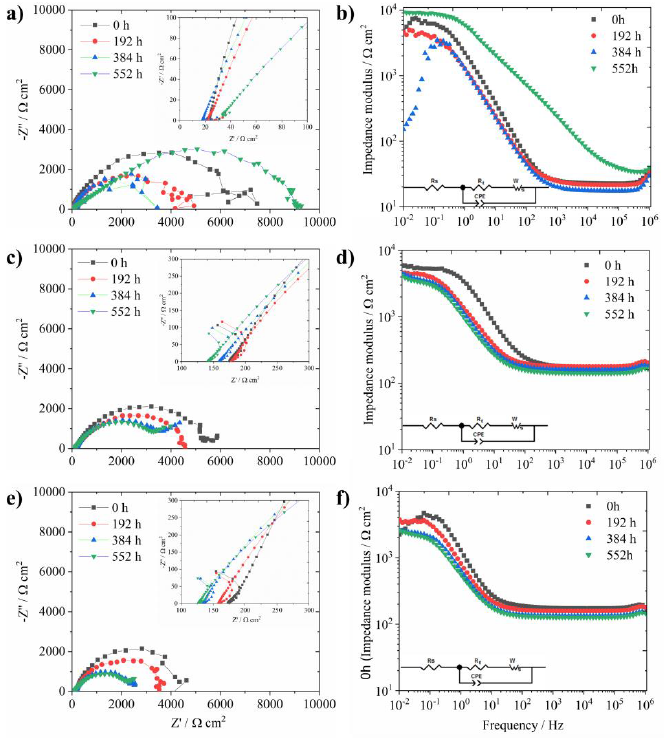
Table 2 Kramers-Kronig validation of the 0R, 1R, and 4R samples and average Rt data.
| Sample | Statistical error X2 (Z) - Bode552h |
Statistical error X2 (Z’) - Real Impedance552h |
Statistical error X2 (Z”) - Imaginary Impedance 552h |
Rt (average)0-552h Ohm-cm2 |
Ecorr (average)0-552h |
|---|---|---|---|---|---|
| 0R | 9.88 ( 10-5 | 4.86 ( 10-5 | 5.02 ( 10-5 | 4970.40 | -0.82 V |
| 1R | 4.78 ( 10-6 | 2.39 ( 10-6 | 2.39 ( 10-6 | 7011.60 | -0.77 V |
| 4R | 3.42 ( 10-6 | 1.81 ( 10-6 | 1.60 ( 10-6 | 5185.00 | -0.81 V |
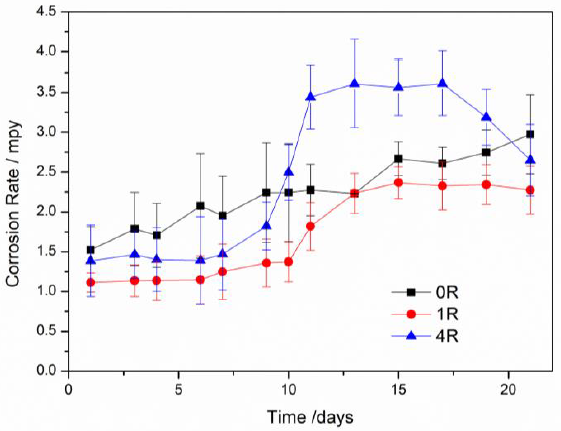
The corrosion rate day by day calculated from the Rt data (Hladky et al., 1980) is shown in Fig. 8. Aluminum degradation was observed in all samples. Considering that the Rt values of the 1R sample were the lowest during the entire testing, the RCS process positively influenced its corrosion rate. The error bars indicate a certain degree of variation during the first days, mainly for system 0R. As previously explained, this variation was observed in the Nyquist plot with the formation and fading of the inductive loop. The corrosion rate data are in agreement for samples 4R since the Nyquist semi-arc diameter continuously decreased over time. Finally, the average corrosion potential (Ecorr) is also shown in Table 2. From this data, the 1R sample developed the more anodic conditions with an average Ecorr value of -0.775 V. According to the Pourbaix diagram (Pourbaix, 1974), this potential is entirely within the passivity region closer to the water decomposition to produce H+, which means a more stable condition of the corrosion products than the others two systems with more cathodic potentials. Therefore, the electrochemical characterization elucidated the effect of the RCS process on the corrosion properties of Al-7075 alloy.
In order to understand the relationship between texture components and corrosion behavior, the orientation planes from Table 1 were sorted out based on its Al surface energy (Wen & Zhang, 2007): {130} > {011} > {001} > {435}. For Al-based alloys, the corrosion phenomena are normally influenced by the high surface energy (J. Wang et al., 2019). Based on the above, the higher surface energy of the main texture components (TC1 and TC2) present on the 1R and 4R samples agreed with the lower corrosion resistance when compared to the initial condition. Moreover, other factors could also contribute to the worsening of corrosion resistance with the RCS process. Due to the grain refinement produced by the RCS process, the increment of grain boundary length might also contribute to increasing the surface energy on the samples processed by RCS. Besides, the change in lattice strain after the cold deformation processes might also affect the corrosion resistance (Bahmani et al., 2020). Considering that grain boundaries are more energetic than the inner grain zones (Bahmani et al., 2020), as the grain boundaries increase the corrosion performance decreases, especially for the 4R sample. It is worth noting that if the energy of high-angle grain boundaries (HAGB) is higher than that of LAGB (Orłowska et al., 2019), the total energy of the system rises by increasing the number of grain boundaries, resulting in a deterioration of corrosion resistance as a function of the RCS passes.
Figs. 3-5 showed that the 0R sample was mainly composed of coarse grains, while the 1R specimen had a combination of micro-, submicro- and nano- metric grain sizes, homogeneously distributed in the sample, whereas the 4R sample was mainly formed by submicro- and nano- metric grains. From this, 0R sample agrees with the well-known assumption of good corrosion resistance for metals or alloys with coarse grains, resulting in fewer grain boundaries, which are active sites for preferential attack (Cramer & Covino, 2003; Osório et al., 2005). However, coarse grains allow a poor adherence of a passive layer on the material's surface compared to those nanostructured (Abdulstaar et al., 2014; Gollapudi, 2012; Ralston & Birbilis, 2010; L. Wang et al., 2007). On the other hand, the 4R sample possesses the finest grain sizes, allowing a more homogeneous formation of the passive layer. However, this microstructure could be affected by the considerable chemical activity due to the high density of grain boundaries and high lattice strain. Based on the above, the 1R sample, with a homogeneous distribution of micro-, sub-, and nano- metric grain sizes (no preferred location of grain according to their sizes) displays the best synergy between the mentioned features of coarse and refined grains. These results suggest that the microstructure has the most significant impact on the corrosion behavior than the crystallographic texture of the RCS-processed AA7075.
The morphology of corrosion products formed due to the immersion in NaCl electrolyte is shown in Fig. 9a-f. SEM images for the 0R sample (Fig. 9a, b) illustrate a thick corrosion product layer with scratches and localized porosity onto the entire surface. As the deformation applied increased, a less homogeneous layer of corrosion products was observed. Fig. 9c, d shows the 1R sample with a localized attack with a different degree of penetration of the Al oxides partially covering the Al substrate. Finally, regarding sample 4R, Fig. 9e, f illustrates the morphology of the different corrosion products heterogeneously distributed on the specimen. These Al oxides of different sizes showed some fractures on the substrate, indicating localized attack sites. SEM-EDS analyses were included in Fig. 9b, d, f. in order to identify the chemical elements of the corrosion products. The chemical analysis of the passivation layer for 0R and 1R exhibited Al and O. Whereas the oxide layer formed in the 4R sample was mainly composed of O, Al, and Mg with 68.0, 27.5, and 4.5 mass %, respectively. Fig. 9g shows the XRD patterns for 0R, 1R, and 4R samples to identify the corrosion products compounds formed in the corrosive environment. The primary corrosion products for the 0R sample were Al(OH)3 and probably Mg(OH)2, while MgO is the main compound after the first RCS pass. The Al phase was identified in all samples and associated with the alloy substrate. These corrosion products are congruent with the SEM-EDS results shown in Fig. 9b, d, f. It is important to mention that MgO, Mg(OH)2, and Al(OH)3 are commonly reported as corrosion products on Al-based alloys (Berlanga-Labari et al., 2020; Li et al., 2018; Linardi et al., 2012; Mahmoud, 2008; Ryl et al., 2014). The possible chemical reactions that occurred in the investigated corrosive environment are as follows (Esmaily et al., 2017; J. Wang et al., 2019; Xhanari & Finšgar, 2019):
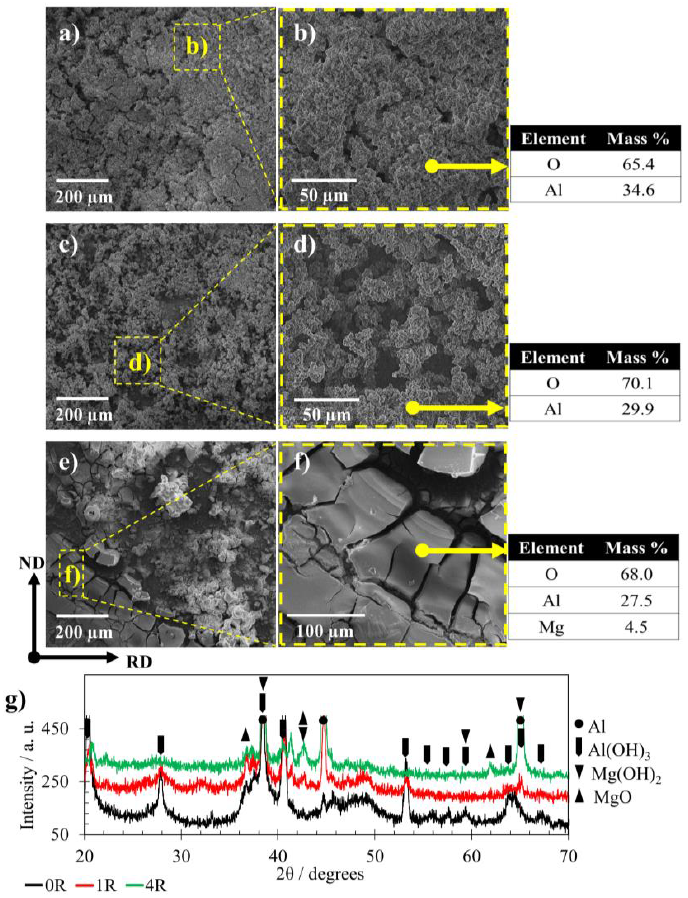
Figure 9 Corrosion products, magnified morphologies, and selected area SEM-EDS of a,b) 0R, c, d)1R, and e, f) 4R samples after EIS tests, and g) ow angle XRD of corrosion products for the same samples.
Anodic reactions:
Cathodic reactions:
The development of different corrosion products in the samples processed by RCS and the collective impact of corrosion mechanisms between micro-, submicro- and nano- metric grain sizes could be associated with the best electrochemical stability of the 1R sample compared with that for 0R.
The corrosion susceptibility in metallic alloys is a physical property that depends on several factors, where crystallographic texture is one of them (Brewick et al., 2017; Jiang et al., 2017; Yanqiu et al., 2020). The AA7075 evolved towards a loss of texture intensity with the deformation applied by RCS, which could be responsible for the formation of heterogeneities (porosity) in the oxide film for the 1R sample. On the other hand, the protective properties of the MgO compound in the 1R sample were seen on the stable impedance modulus values at high frequencies. Furthermore, the greater density of MgO (3.6 g cm-3) in comparison with Mg(OH)2 (2.34 g cm-3) and Al(OH)3 (2.4 g cm-3) could improve the impermeability of the formed passive film.
4. Conclusions
The AA7075 processed by RCS produced micro-, submicro-, and nano- metric grain sizes (up to 4 passes); this was observed from the first RCS deformation pass. In the texture analysis, four different components were identified in all the studied samples. The surface energy of the main texture components was consistent with higher corrosion susceptibility of the RCS-processed condition compared to the initial condition. Besides, as the RCS passes increased, a drop in corrosion resistance for longer immersion times was observed. However, the 1R sample showed the best electrochemical stability related to the homogenous mixture structure consisting of micro-, submicro-, and nano- metric grain sizes.
These results suggested that the microstructure has the most significant impact on the corrosion behavior than the crystallographic texture on the RCS-processed AA7075. The corrosion behavior associated with the obtained grain size distribution could be of interest to those working in materials design that involves severe plastic deformation, heterogeneous microstructure, and electrochemical stability.
Conflict of interest
The authors do not have any type of conflict of interest to declare.
Financing
The authors acknowledge the funding support from UNAM-DGAPA-PAPIIT- through project IN102321.

