


 nova página do texto(beta)
 Inglês (pdf)
 Artigo em XML
 Referências do artigo
 Enviar este artigo por email
 Citado por SciELO
  Similares em
SciELO
Similares em
SciELO 
 Permalink
1. Introduction
Nowadays, shortage of clean water in the world has become a big and serious problem since it affects thousands of people, especially the vulnerable population in rural and remote areas. This problem does not arise from the “lack of water” in the area, this comes from many other factors and even in areas with high water resources. For example, Latin America and the Caribbean (LAC) are regions with high water resources, they possess almost 34% of the fresh water in the world (Mekonnen et al., 2015). Nevertheless, access to potable and purified water is insufficient and their quality is inadequate (Flachsbarth et al., 2015). According to the World Health Organization (WHO) and the United Nations International Children's Emergency Fund (UNICEF), around 2.2 billion people around the world do not have safely managed drinking water services, 4.2 billion people do not have safely managed sanitation services, and 3 billion people lack basic handwashing facilities (World Health Organization & United Nations Children's Fund, 2015; 2019). The COVID-19 pandemic has woken up the previous red alerts.
It is well-known that lack of water brings many social problems. For example, in 2017 almost 1.6 million people died globally from diarrheal diseases (WHO & UNICEF, 2017a) and in Latin America and the Caribbean, it is the second leading cause of death (Pan American Health Organization, 2017). Diarrhea is completely preventable and treatable and the main causes come from the consumption of contaminated water mainly by Escherichia coli (E. coli) and heavy metals (Jaishankar et al., 2014), both are associated with toxicity and bioaccumulation in living beings (Marazzato et al., 2020; Shaharoona et al., 2019).
In the case of Latin America and the Caribbean, 74.3% and 31.3% of the population respectively have access to safely managed water and sanitation services (Pan American Health Organization & World Health Organization, 2019). Mexico is one of the Latin American countries with a larger supply of fresh water in the world, every year Mexico receives around 1,449,471 million cubic meters of water in the form of precipitation. The North, Center and Northwest regions possess 1/3rd of the renewable water with 4/5th of the population (1,581.28 m3/inhab/year) which is less than the Southeastern region with 2/3rd of the renewable water and 1/5th of the population (10, 718.25 m3/inhab/year) (PAHO & WHO, 2019). Even though, the Southeastern region possesses more water, this region is less developed in Mexico. The most affected states are Oaxaca, Guerrero, Campeche, and Chiapas. Among all these states, in 2016 the state of Chiapas had the highest renewable water resources per year and per capita in the country,113,903 hm3/year and 21,419 m3/inhab/year, respectively (Statistics on Water in Mexico, 2017). Even with these resources of water most rural communities of this state don’t have access to clean water, electricity and suffer from water-borne diseases.
In order to find solutions for this type of problem, many reports have proved that household water treatment can be the most cost-effective option (Holtman et al., 2018; Murray et al., 2020). However, this method has a disadvantage, such as taste and poor disinfection efficiency. Other options are the use of solar radiation for drinking water treatment through SODIS (solar water disinfection) (Kohn et al., 2016; Parsa et al., 2020; Vivar et al., 2017) this method had confirmed efficiency to remove bacteria, fungi, and viruses. Nevertheless, the time needed for solar exposure is at least 6 hours; if it is cloudy this is up to 2-3 days (Wang et al., 2016).
Another potential method to improve the efficiency of solar disinfection has been reported by the addition of a photocatalyst, such as titanium dioxide (TiO2) (Fernández-Ibáñez et al., 2015; Wu et al., 2014). Although TiO2 increased the effectiveness of the SODIS, the suspension of TiO2 nanoparticles had to be separated before human consumption (otherwise it could be a human health risk), also this process is costly and difficult. Even with this big potential, the SODIS is limited to the disinfection efficiency and the scale-up. This is because the large-scale systems such as the continuous flowing or pumping circulation both need electricity and they ceased to be useful for rural and remote areas that lack clean water and electricity.
Due to these reasons, other works have developed hybrid photocatalytic-photovoltaic prototypes to treat contaminated water (Qin et al., 2015; Vivar et al., 2012). Other researchers reported hybrid systems using solar radiation, these systems were pilot-scale solar photoreactors, which included flat plate reactors (FPRs) and compound parabolic collector (CPC) reactors (Ochoa-Gutiérrez et al., 2018; Wang et al., 2016). Many hybrid systems for remote locations have been developed to desalinate water through reverse osmosis (Alghoul et al., 2016; Peng et al., 2018) and ultrafiltration membranes (Clayton et al., 2019).
The main advantage of hybrid systems is that they do not require conventional energy for their operation. It favors their implementation in remote areas that lack clean water and electricity. However, despite its great functionality, each method has its disadvantages such as high cost, taste, laboratory scale, synthetic feeding water, low removal efficiency from toxic contaminants such as heavy metals (mercury, lead, arsenic, cadmium and copper). In addition, the experiments only showed few contaminants such as dyes, salts, microorganisms.
The aim of this work is to build and evaluate an autonomous water purifier (AWP) prototype, with practical and accessible dimensions/weight to make it easy to handle, highly efficient to remove heavy metals from remote locations, with the purpose of enhancing water quality in a community-scale.
Our results showed that the AWP prototype has an extensive range for the removal of contaminants in comparison to equivalent water treatment systems from the same locations, and the electricity generated by the solar cells can be used for running the whole system. The water performance, design, operational conditions, and photovoltaic system were studied.
2. Materials and methods
2.1.1 Feed water quality
The design of purification steps in the AWP prototype is dependent on the feed water quality, therefore the chemical and microbiological contaminants commonly found in most surface water and groundwater of Latin America were identified (Table 1). Based on these results, it was possible to determine and select the stages convenient for the purification system and achieve suitable drinking water that met the guidelines by Mexican official standards for purified water.
Table 1 Main chemical and microbiological contaminants present in natural waters of Latin America (WHO & UNICEF, 2017b).
| Contaminant type | |
|---|---|
| Microbiological | Concentration range |
| Total coliforms | 2000-180,000 |
| Fecal coliforms | MPN/100 mL |
| 1500-50,000 | |
| MPN/100 mL | |
| Chemical | Concentration range |
| Total alkalinity | 200-600 mg/mL |
| Total hardness | 150-700 mg/mL |
| Total solids | 200 -900 mg/mL |
| Sulfate | 10-50 mg/mL |
| Chloride | 10-30 mg/mL |
| Heavy metals | Concentration range |
| Mercury (Hg2+) | 10-30 mg/L |
| Lead (Pb2+) | 10-50 mg/L |
| Arsenic (As3+) | 10-30 mg/L |
| Cadmium (Cd2+) | 10-30 mg/L |
| Copper (Cu2+) | 15-30 mg/L |
2.1.2. Solar resources
Mexico is within the latitudes 15°N to 35°N, with annual average solar radiation levels of approximately 5.00 kWh/m2-year (Matsumoto et al., 2014). The northern region of the coastal zone of the Gulf of Mexico can reach a radiation up to 6.7 kWh/m2-day (Pérez-Denicia et al., 2017). While, the southeast region, including Chiapas, can reach a solar radiation level of up to 4.76 kWh/m2-day (REdataexplorer, 2022), and the annual average solar radiation at this area is 5.66 kW/m2/-year (Valdes-Barrón et al., 2014).
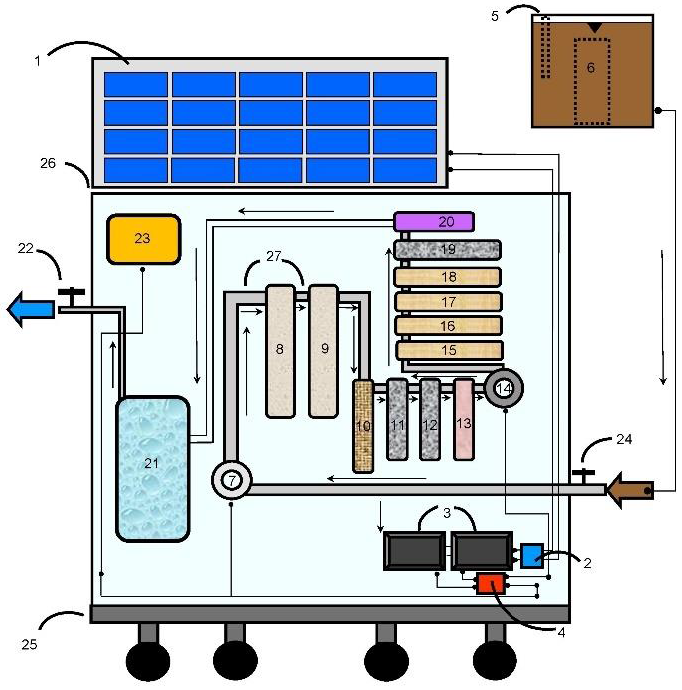
2.1.3. Components of AWP prototype
The AWP prototype is integrated by: (1) photovoltaic panels (capture the energy of the incident solar radiation and convert it into electrical energy); (2) controllers (regulate the electric current that arrives at the batteries); (3) batteries (store the electrical energy), (4) inverters (convert the input of direct current to alternating current). The purification system is located inside the housing (26) of the AWP prototype.
To put the prototype to operate, first it is necessary to pre-treat the feed water in the storage tank (5); inside there are coagulants, flocculants and disinfectants dispenser (6). The fluid (27) is formed by a pressure pump (7) for forced flow, purification processes are integrated by adsorption columns (8 and 9) with polymeric materials (polypropylene and polyester), zeolite ion-exchange column (10) of heavy metals, adsorption columns with activated carbon materials (11 and 12), polymer resins ion exchange columns (13) of hardness, a transmembrane pressure pump (14), semipermeable membranes (15 to 18), adsorption column (19), ultraviolet lamp (20) and a pressurized storage tank (21).
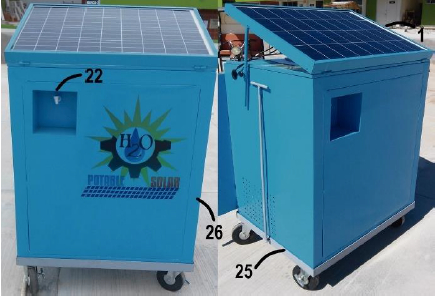
A purified water taps (22) and a digital indicator display (23) are located on the front outer surface of the AWP prototype. A shut-off valve (24) for feed water is located on the lateral outer surface, on the lower outer surface is located the trailer (25) that provides mobility to the device. The external surface of the device is formed by a rigid structure (26) with high resistance to corrosion and wear.
2.2.1. Dimensioning of the autonomous photovoltaic system
The purpose of photovoltaic dimensioning is to calculate system elements needed to reliably supply the electrical energy needed for a purification system to operate and achieve a completely autonomous system. The following environmental and operational parameters for calculations of the photovoltaic sizing were considered:
The daily power demand of the equipment required by the purifier was determined according to alternating (AC) and direct (DC) power consumption. It was obtained that the power demand required by the purifier is 52 W in AC, and for 8 working hours it is needed 416 Wh/d.
The solar peak time (SPT) and average SPT considered for Chiapas, México was 5.3 kWh/m2 (Pérez-Denicia et al., 2017).
Backup time chosen was N=4 days. This means the time in which the solar panels will not capture solar energy due to unfavorable conditions and whole consumption will be met with energy stored in the batteries.
The number of panels was calculated from total actual consumption relation (ET) and the peak power of panel (Pp), the result obtained was 90 Wp.
The battery capacity was calculated for a backup time of 4 days, and daily consumption of 468 Wh/d. Thus, it was obtained the necessity of 2 batteries of 115 Ah and 12 V for each one.
The capacity of the controller was calculated in order to obtain the maximum current (Imax) flowing in the installation. For this, it was calculated the current produced in the panel (Ip), the current consuming charges (Ic) and based on the maximum of these currents it was calculated the one supported by the controller (Luque & Hegedus, 2003).
2.2.2. AWP prototype construction
It was carried out the construction of the autonomous purifier based on the AWP prototype design (Figure 1). The material for manufacturing the prototype was galvanized steel of 24 caliber. Once it was built, we continued to integrate the purification system and the photovoltaic system. Two deep cycle batteries (115 A and 12 V) with a useful life of 5 years and one solar panel (90 W/m2 power) the useful life of 20 years were connected to ensure that the equipment works correctly.
The autonomous photovoltaic system was constructed according to the dimensions as shown in Table 2.
Table 2 Autonomous photovoltaic system sizing.
| Photovoltaic parameters | Dimensions |
|---|---|
| Total power of the system: | 52 W |
| Theoretical energy consumption for 8 hours: | 416 Wh/d |
| Total actual consumption required by the purifier: | 468 Wh/d |
| Peak power of solar panel: | 90 W/m2 |
| Battery capacity (2 batteries): | 115Ah, 12 V |
| Controller capacity: | 10 A |
| Inverter capacity: | 100 W |
It was observed that the energy generated satisfied the energy demand required by the AWP prototype for 8 hours of operation. The permeation rate from the membrane was 14 liters/hour (L/h), thus the working period of the prototype showed a total flow of 112 liters/day (L/day). This gives a calculation of 56 persons water need per day (assuming that a person will consume only 2 L/day). If the water is required for personal hygiene, then the number of persons will decrease up to 3-4 (since the average quantity of water used for bathing per person is 20 L/d).
In Figure 2, we can see the final AWP prototype. The overall dimensions are: 110 cm × 90 cm × 70 cm (height × length × width) and possesses relatively low weight ≈70 kg.
2.3.1. Study area
The study was carried out in Chiapas, Mexico (17°33′23.5″ N and 93°22′51.7″ O). The main reason was because Chiapas has the largest population without access to drinking water and occupies the first place of extreme poverty in the country (Gutierrez-Jimenez, 2014). One of the ten leading causes of children´s mortality in Chiapas is diarrheal illness from contaminated water (Stevens et al., 2008). For example, one rural community with the highest social backwardness and marginalization index is the municipality of Oxchuc, located in the region of Los Altos, Chiapas (16°43′00″ N and 92°37′00″ O), where around 70.85% of the households do not have safe drinking water supply (Gutiérrez-Jiménez et al., 2019).
2.3.2. Sampling
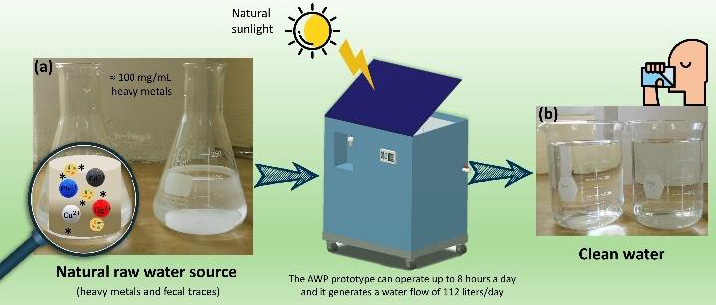
The surface water samples were collected from the Santo Domingo River located at Chiapa de Corzo, Mexico (16°42′30″ N and 93°01′01″ O), as far as possible from the riverbank, trying not to remove the ground and avoiding stagnant zones. The spring water samples were collected from Los Altos, Mexico (16°43′00″ N and 92°37′00″ O). Both samples were stored in drums of 60 and 50 liters to be filtered by the AWP prototype, also 2 litters of sterilized jars were kept for their microbiological and chemical analysis. Before storing the samples in the drums, they were washed three consecutive times and were also completely immersed in the opposite direction of the river’s flow. Samples were kept in ice boxes during transfer and were processed after a maximum period of 2 h (Rice et al., 2017). The temperature, pH (HI 98129, Hanna Instruments), and turbidity (HI 93703C, Hanna Instruments) of the water samples were determined immediately on the spot before they arrived at the laboratory. Microbiological and chemical analyses were conducted on the water samples before and after the treatment with the filter from the AWP prototype. The water samples, how they look like (a) before and (b) after purification are shown in Figure 3.
2.3.3. Feed water pre-treatment
The pre-treatment process at the storage tank (Figure 1, subsection 5) consisted of a clarification and disinfection step before being filtered by the AWP prototype. The clarification treatment was performed by the Jar-test technique (Aragonés-Beltrán et al., 2009) to determine the optimum dose of coagulant and disinfectant for the dispenser (6) inside the storage tank. It was found that the optimum dose of the coagulant (10% v/v aluminum sulfate) was 1320 mL for the total volume of raw water (110 liters). After this calculation, it was measured the initial and final parameters such as turbidity and pH (Table 4), and the optimum dose used for the disinfectant was 20 mL for the same volume of raw water. By adding an excess of chlorine, it was reached free residual chlorine that acted as a disinfectant. The samples were left in contact with the disinfectant for 15 to 30 minutes. After that, the concentration of free residual chlorine was measured with a digital Checker in order to achieve the right concentration of chlorine’s residual content (1.5 mg/mL).
Table 4 Main chemical contaminants of raw and water obtained from the AWP protype.
| Parameters | River water | Spring water | Units | ||
|---|---|---|---|---|---|
| Ci | Cf | Ci | Cf | ||
| Odor | Unpleasant | Nice | Unpleasant | Nice | -- |
| Flavor | Unpleasant | Nice | Unpleasant | Nice | -- |
| Real color | 58.00±2% | 0.00 | 1.00±0.8% | 0.00 | Units |
| Turbidity | 52.00±2% | 0.00 | 0.00 | 0.00 | NTU |
| pH | 5±0.5% | 7.60±0.2% | 5±0.5% | 7.20±0.3% | Units |
2.4.1 Total coliform and fecal coliform
The total number of coliforms was determined by the method of most probable number (MPN). The process consisted of inoculating 10, 1 and 0.1 mL of the raw water sample into Durham tubes, each volume was replicated into 5 tubes to give 15 tubes in total. Each Durham tube contained 10 mL of lauryl tryptose broth (LTB), and the gas production was used as an indicator of the presence of coliforms. The tubes were incubated at 35 °C for 48 hours (Erdem et al., 2004). It was compared the number of tubes giving a positive reaction to a standard chart and record the number of bacteria present in it (WHO, 1997). The results of the examination for the coliform group carried out by the multiple-tube fermentation technique are reported in terms of the most probable number (MPN/100 mL) of organisms present.
The presence of fecal coliforms was determined by performing the fecal coliform tests. The test consisted of the inoculation of Escherichia coli in broth tubes, introducing a loop with bacteria taken from the LBT and it was incubated at 44 °C for 24 hours. The presence of turbidity and gas formation after incubation was an indication of the presence of E. coli (Rice et al., 2017).
2.4.2. Turbidity, odor and taste
The Nephelometric method was used to determine the turbidity and color from the water samples. This method consisted of a comparison between the intensity of light scattered by the sample under defined conditions and the intensity of light scattered by a standard reference suspension under the same conditions, greater the dispersion of light higher the turbidity and color. The data were collected using a calibrated turbidimeter HACH TL2300 EPA with a reference suspension of formazin polymer prepared under specific conditions. The sensitivity of the instrument permits detecting turbidity range of 0 to 4000 NTU. The unit in which turbidity is expressed when it was been determined by the nephelometric method are Nephelometric Turbidity Unit (NTU) (Rice et al., 2017).
The test for determining the odor consisted of diluting a raw water sample with odor-free water to a dilution that has a minimal perceptible odor. It is taken as a fact that there is no absolute value for odor and that the test is used for comparison only (Rice et al.,2017).
2.4.4. Total alkalinity
The alkalinity in water was determined by titration technique. Phenolphthalein and methyl orange as indicator reagent were used. 100 mL of sample was transferred in a 250 mL Erlenmeyer flask and added a few drops of indicator reagent, until a slight coloration was noted. It was titrated with a standard solution of sulfuric acid (H2SO4, 0.02 N) until it turned from pink to colorless. The volume of spent acid was determined. Few drops of the methyl orange indicator solution were added. The titration was continued with acid solution until turned yellow or orange. The volume of spent acid was determined (Rice et al., 2017).
2.4.5. Total hardness
Total hardness is defined as the sum of the calcium (Ca2+) and magnesium (Mg2+) ion concentrations, both expressed as calcium carbonate (CaCO3) in milligrams per liter. The method to determine the total hardness consisted of an assessment using eriochrome T as visual indicator, which is red in the presence of calcium and magnesium and turns blue when these are complexed form or absent. A 50 mL sample of water was taken, 1 or 2 mL of H2SO4 buffer was added to achieve a pH of 10.0 and an amount (0.2 g) of the eriochrome T indicator was added. The sample became reddish in color. It was titrated with a 0.01 M Ethylenediaminetetraacetic acid (EDTA) solution, stirring continuously until the reddish hue disappeared. The last drops were added with intervals of 3 s to 5 s. At the end the sample changed from reddish to blue. The EDTAs spent on the titration in the sample are noted for later calculation (Rice et al., 2017).
2.4.6. Chloride and sulfate
The determination of chloride ions (Cl-) consisted of a titration with silver nitrate using potassium chromate as an indicator. A 100 mL sample was used, the pH was adjusted between 7 and 10.1 mL of potassium chromate indicator solution was added, and it was titrated with the silver nitrate standard solution until it turned yellow to orange. The silver reacted with the chlorine to form a precipitate of white silver chloride.
For the determination of sulfate ions
2.4.7. Heavy metals
The ion exchange in aqueous solution on the zeolite columns (10) was studied for the heavy metals such as Pb2+, Hg2+, Cd2+ and Cu2+. To do this, several zeolite samples (clinoptilolite-K) were washed using deionized water, then separated by settling. After that, were dried for 24 hours in an oven (H-33 Riossa) at 110 °C and kept in dry containers.
The exchange isotherm experimental data was obtained from the ion exchange column (10). The samples were filtered over this column. For this purpose, it was used a 500 mL solution prepared with an initial ion metal concentration of 10-100 mg/L.
Hydrochloric acid (HCl) was used to adjust the initial pH from 7 to 5, because it is reported that the maximum and optimum pH values for metal adsorption lie between 5 to 6.5 (Elboughdiri, 2020). The zeolite and the solution were left in contact until they reached the equilibrium (24 h). It was measured the absorbance of the final concentration of ions after being filtered by the AWP prototype using an Inductively Coupled Plasma Optical Emission Spectroscopy, ICP-OES (Thermo Scientific iCAP 6000 SERIES) spectrometer. The concentration was calculated also by the calibration curve method, this process was done by establishing the calibration curve over standard metal solutions at concentrations from 10 to 100 mg/L.
The metal cation removal percentage (%R) was calculated from the difference of initial (Ci) and final (Cf) metal cation concentration in each sample by the following equation (Erdem et al., 2004):
3. Results and discussion
3.1. Microbiological water quality
The data shown labeled as initial concentration (Ci) means the results from the samples before receiving any treatment (raw water) and the final concentration (Cf) is the results of samples treated by the AWP prototype (treated water). The microbiological water quality assessment results are presented in Table 3, the average was calculated from 3 times of sampling.
Table 3 Total coliform of raw and water obtained from the AWP prototype.
| Parameters | River water | Spring water | Units | ||
|---|---|---|---|---|---|
| Ci | Cf | Ci | Cf | ||
| Total colifor-ms | 54,000±3% | 0.00±0.00 | 79±2% | 0.00±0.00 | MPN/100mL |
| Fecal colifor-ms | 35,000±2% | 0.00±0.00 | Not detectable | 0.00±0.00 | MPN/100mL |
The Ci coliform values obtained from river and spring water were 54,000±3% and 79±2% MPN/100 mL respectively, this means that the value obtained from river water was 683 times higher than that obtained from the spring water. The groups of bacteria identified were total coliforms and Gram-negative bacilli made up of four genera, including the most predominant Escherichia coli. As the values were higher than 0.00 MPN/100 mL, both types of water exceeded the recommended limit for total and fecal coliforms according to the WHO guidelines (WHO, 1997).
The Cf results showed 0 values for both types of samples, meaning that 100% removal of the total coliforms was found in both samples and can be attributed to appropriate disinfection pre-treatment of raw water (5). Also, high efficiency for removal of pathogenic microorganisms by the ultraviolet lamp (20) at AWP prototype was demonstrated.
3.2. Chemical water quality
In Table 4 it is observed the average chemical parameters calculated from 3 times of sampling. The odor and flavor in both types of raw water were unpleasant, i.e, not suitable for human use. After the treatment with the AWP prototype, these parameters changed to nice, meaning the water samples comply the guidelines for drinking-water quality according to WHO and Mexican standards. The real color for river and spring water were 58.00±2% and 1.00±0.8% respectively, before percolation through the AWP prototype. After the treatment with the AWP prototype final concentrations were zero, fulfilling the guidelines of Mexican standards, since to the permitted value is 15 units (NOM-201-SSA1, 2002).
Complete removal of the organoleptic characteristics such as odor, flavor and color are due to the effective performance of adsorption columns with activated carbon materials (Figure 1, subsection 11-12).
In the case of the turbidity parameter the spring water Ci value was cero, therefore the Cf was the same. On the other hand, the reduction from 52.00 ±2% to 0 NTU was seen when the AWP prototype treatment was applied on the river water samples making only the AWP treated water below 1 NTU, the value that fulfilled the WHO guidelines (WHO, 1997).
The pH values as well were measured. The pH corresponding to Ci was 5±0.5% for both types of water and increased to 7.6±0.2% and 7.20±0.3% for river and spring water respectively. This was due to the clarification pre-treatment and proper functioning of adsorption columns (Figure 1, subsection 8-9). It means, the water treated with the AWP prototype is the only one that satisfies the Mexican Official Standards (the permissible limits are from 6.5 to 8.5 units for pH (NOM-127-SSA1, 1994).
Figure 4 shows the removal percentage of chemical average parameters obtained by equation 1 and calculated within 6 times sampling. In this figure, it is shown the initial concentration (Ci) of total alkalinity, hardness and solids for river and spring water. As a first look, it’s possible to realize that the river and spring water have high levels on those parameters. As the previous results, untreated waters were above the permissible limits. The recommended purified water limits for total alkalinity, hardness and solids were 300 mg/L, 200 mg/L and 500 mg/L, respectively. For example, the spring water was contaminated with high percentage of calcium (Ca2+) and magnesium (Mg2+) ion contents than river water. While, for both river and spring water the chloride and sulfate ions were 250 mg/L, below the permissible limits (NOM-127-SSA1, 1994).
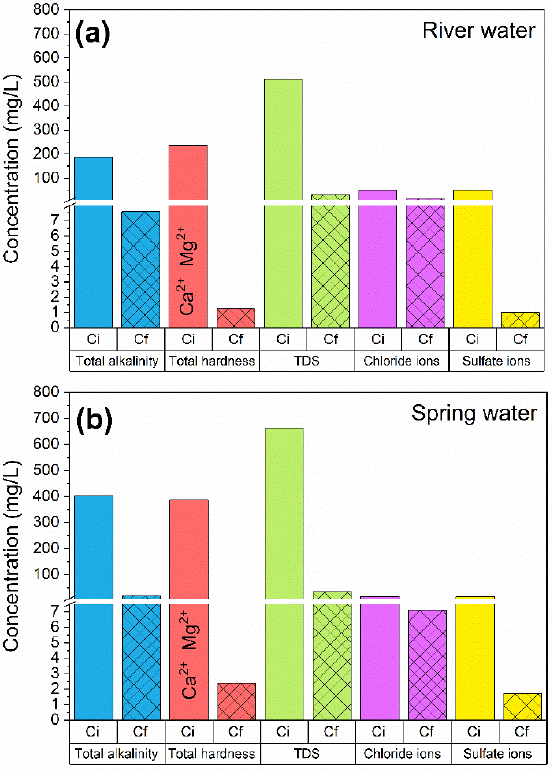
Figure 4 Concentration variation of chemical contaminants of raw water (Ci) and treated water (Cf) by the AWP protype: a) river water and b) spring water.
In Figure 5 it is shown the removal percentage (%R) and final concentration of heavy metals in zeolite ion exchange column (Figure 1, subsection 10) at AWP prototype, obtained by equation 2. The curves were fitted with the following mathematical equation by the exponential model:
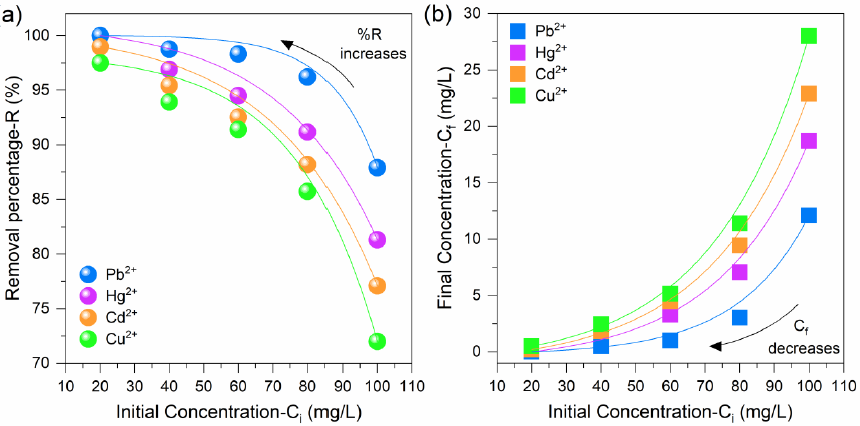
Figure 5 (a) Removal percentage (circles) and (b) final concentration (squares) of Pb2+, Hg2+, Cd2+, and Cu2+ on zeolite ion exchange column as a function of the initial concentration.
The removal rate of a cation in aqueous solution depends on the quantity exchanged in zeolite ion exchange column (10); as well on the function of the ion exchange. Thus, it was considered that under the same experimental conditions, the sample that has a higher capacity for a given ion exchange is one that exhibits the highest percentage of removal for that ion capacity (Erdem et al., 2004; Mihaly-Cozmuta et al., 2014).
In this figure, it is seen the removal percentage (circles) and final concentration (squares) against initial concentration for Pb2+, Hg2+, Cd2+, and Cu2+ obtained from ICP-OES technique. It can be seen that %R and Cf decrease as the initial metal concentration increases in aqueous solutions since zeolite has a maximum adsorption capacity and tends to become saturated at high concentrations. The %R varied from 87 to 99% for Pb2+, 81 to 99% for Hg2+, 77 to 98% for Cd2+ and 72 to 97% for Cu2+.
Comparing the %R obtained from zeolite ion exchange column (10) for each metal, it is noted that the exchange selectivity in zeolite is Pb2+> Hg2+> Cd2+> Cu2+, i.e, for the natural zeolite the Pb2+ is exchanged in greater quantity than the metal Hg2+ and so for the metals Cd2+ and Cu2+.
This cation exchange can be attributed as the replacement of Na+, Ca2+ and K+ exchangeable ions that constitute zeolite with the divalent cations of Pb2+, Hg2+, Cd2+ and Cu2+. This isomorphic substitution is due to the similarity on its ionic radius that metal cations have with the exchangeable ions, the affinity of the dimensions in their cavities of zeolite makes one cation take the place of the other, by simple interaction between its chemical bonds. Due to the similarity between their ionic radius the replacement is concluded as follows (Shannon, 1976):

Where, pm means picometer and is equal to 0.001 nanometers (nm).
The literature indicates that in the case of metal cations and natural zeolites, the predominant mechanism is ion exchange. It can be assumed that the zeolite had a great amount of exchangeable K+ ions, therefore, greater the exchange occurred with Pb2+ cation.
Final concentrations were 12.09 to 0.002 mg/L for Pb2+, 18.7 to 0.002 mg/L for Hg2+, 22.9 to 0.204 mg/L for Cd2+ and 28 to 0.5 mg/L for Cu2+ at initial concentration of 100 to 20 mg/L. The value of 20 mg/L of initial concentration are within permissible limit of purified water according to WHO guidelines that are 0.01 mg/L, 0.006 mg/L, 0.003 mg/L and 2.00 mg/L for Pb2+, Hg2+, Cd2+, and Cu2+ respectively (Herschy, 2012).
These results indicate that the AWP prototype was designed to remove the main heavy metals described in Table 1 up to permissible limits from zeolite ion exchange column. The heavy metal uptake is attributed to different mechanisms of ion-exchange processes as well to the adsorption process. During the ion-exchange process, metal cations had to move through the pores of zeolite and channels of the lattice, which in turn replacing exchangeable cations (mainly Na+, Ca2+ and K+). In this case the metal ion pickup could mainly be attributed to the ion-exchange reactions in the microporous minerals of the zeolite ion exchange column.
The maximum amount of metal ion exchanged per unit mass of the adsorbent represented by Nmax (adsorbed, mg / zeolite, gr) was estimated using the least squares method by plotting the C/N ratio as a function of the equilibrium concentration C for each metal ion adjusted to a straight line with slope 1/Nmax and ordered to the origin 1/KNmax for the Langmuir isotherm, using the following equation (Mihaly-Cozmuta et al., 2014):
where, C is the concentration of metal ions at equilibrium, K is the Langmuir isotherm constant related to the enthalpy of adsorption. The values of Nmax for each metal ion were: 1.785 mg/gr, 1.769 mg/gr, 1.753 mg/gr and 1.446 mg/gr for Pb2+, Hg2+, Cd2+ and Cu2+ respectively.
In Vivar’s work (Vivar et al., 2017), it is confirmed that the treatment of water through SODIS (solar water disinfection) is not an effective method for elimination of bacteria and the efficiency depends on the season of the year and irradiance (W/m2). A considerable amount of UV irradiation that arrives at the earth surface is UV-B (280-320 nm) and UV-A type (320-400 nm), this implies that it can break the simple DNA threads and destroy the cellular membrane of the microorganisms (Han et al., 2004).
Table 5 Summary of analytical results of raw and treated water samples by other similar systems.
| Parameters | SODIS Vivar et al., 2017 | ECAS Clayton et al., 2019 | AWP prototype (our work) |
|||
|---|---|---|---|---|---|---|
| raw water | treated water | raw water | treated water | raw water | treated water | |
|
E. coli |
1200 ± 45 CFU/100 mL |
30 ± 3.0 CFU/100 mL |
1.50±0.71 CFU/100 mL |
0.00±0.00 CFU/100 mL |
35,000±2 MPN/100mL |
0.00±0.00 MPN/100mL |
| Total coliforms |
11,000 ± 810 CFU/100 mL |
270 ± 14 CFU/100 mL |
12.0± 8.29 CFU/100 mL |
0.00±0.00 CFU/100 mL |
54,000±3 MPN/100m L |
0.00±0.00 MPN/100mL |
| Cadmium (Cd) |
not evaluated |
not evaluated |
0.12 µg/L |
0.10 µg/L (17%) |
20 mg/L |
0.204 mg/L (98.98%) |
| Copper (Cu) |
not evaluated |
not evaluated |
0.01 mg/L |
0.01 mg/L (0%) |
20 mg/L |
0.5 mg/L (97.5%) |
| Lead (Pb) | not evaluated | not evaluated | 5.38 µg/L | 0.62 µg/L (88%) | 20 mg/L | 0.002 mg/L (99.99%) |
However, many of these microorganisms have a mechanism capable of repairing these effects. For this reason, the SODIS method can only eliminate 97.5% of E. coli and coliforms bacteria. In the ECAS method (electrochemically activated solutions) and in the AWP prototype the elimination was 100%. This is an important parameter, because according to the WHO guidelines the optimum value for water suitable for human consumption should be 0.00 MPN/100 mL or 0.00 CFU/100 mL. It should be mentioned that in our AWP prototype the concentration of the E. coli in the feed water was 30 times higher than that in SODIS.
In the case of heavy metals, it is observed that the ECAS method posseses a low removal efficiency of cadmium and copper, 17% and 0% respectively. While with the AWP prototype the removal, efficiencies are above 98% for cadmium, copper, and lead. This is because the ECAS method uses ultrafiltration (UF) membranes that work through a physical permeability mechanism that occurs by size separation through a membrane with pore size between 1 and 100 nm, which can retain colloidal matter and in suspension, as well as protozoa, bacteria, and most viruses (Arnal et al., 2009). Therefore, it was ideal for the elimination of macromolecules such as E. coli and coliform bacteria, but not for heavy metals that are smaller than 1 nm (Shannon, 1976).
The AWP prototype is proved to be capable of efficiently eliminating E. coli and coliform bacteria, as well as heavy metals, because it contains a UV irradiation stage that leads to the cell death of microorganisms. Also, in addition to this a zeolite ion exchange column was added (Figure 1, subsection 10) the performance of this will be explained later.
Regarding the market, compared to commercial solar water purification systems distributed in e-commerce companies such as Alibaba and Indiamart, the market value of these products is between 300-1000 USD, for small systems of 15-20 L of water per day. For large systems with a production of more than 7,000 L/day the market value is between 18,000 and 25,000 USD, for example, the H2Optima solar water treatment plant. Our AWP prototype according to our business model is in the range of these values and would have a sale price of 900 USD (subject to change).
3.3. Chemical mechanisms in contaminants removal
Heavy metal removal was carried out in the zeolite ion exchange column (Figure 1, subsection 10) in the AWP prototype. The structure of zeolites (Figure 6a) forms a network of channels and cavities that allow easy penetration of molecules according to size, shape and polarity, leading to the adsorption and filtration of various substances that come into contact with zeolites (Abdel Rahim, 2017). One of the important mechanisms involved in the adsorption of toxins, such as heavy metals, is known as Cation Exchange Capacity (CEC), which is defined as the stoichiometric substitution of an equivalent ion in the solid phase for the equivalent of another ion in liquid phase (Petrus & Warchoł, 2003). In the case of zeolites, it is considered as an intrinsic property since it is the product of the isomorphic substitution of the silicon atoms of its crystalline structure by other atoms. This substitution occurs by tetravalent aluminum atoms, which produces a net negative charge in the structure that is compensated by cations external to them (Figure 6b). These cations are interchangeable and a manifestation of their nature of microporous crystalline structure since the dimensions of their cavities and of the cations that are exchanged determine the course of the process (Sherry, 2002). Figure 6a represents the ion exchange model for a clinoptilolite-K type zeolite with a high Si/Al ratio to show how different cations affect open pore cavities. As suggested in the literature, cationic charges affect the number of ion exchange during the exchange to maintain the valence balance of the zeolite (Figure 6b). According to the law of conservation of charge, each divalent cation (Pb2+, Hg2+, Cd2+, and Cu2+) consumes two monovalent sodium or potassium ion replacements (Na+ and K+) and vice versa (Sherry, 2002).
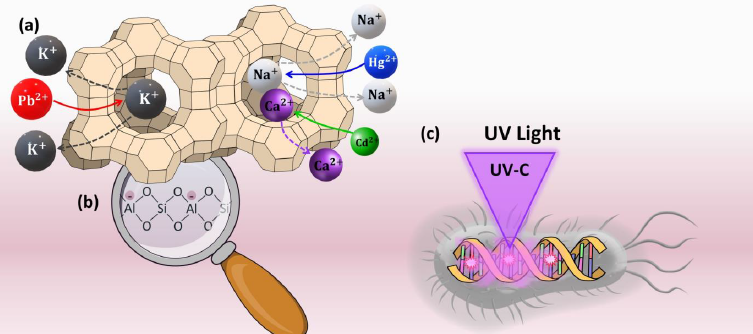
Figure 6 (a) Model of different cation exchanges in the structure of a zeolite; (b) ion exchange scheme on the surface of a zeolite; (c) scheme for elimination of microorganisms by UV light.
On the other hand, the elimination of bacteria such as Escherichia coli is carried out in the ultraviolet lamp (Figure 1, subsection 20) in our AWP prototype. Ultraviolet (UV) irradiation can be used to kill microorganisms, such as bacteria, fungi, fungal toxin viruses, and actinobacteria, with the sterilization efficiency determined by the wavelength of the applied light (Liu et al., 2019). The UV-C (200-280 nm) sterilization mechanism encompasses both physical and biochemical processes. When the microorganism absorbs ultraviolet light, a biochemical process of formation of pyrimidine dimers and thymine dimers occurs, which may interfere with the microorganism's DNA and eventually leads to cell death (Petrus & Warchoł, 2003), this mechanism is shown in Figure 6c.
4. Conclusions
In this work it is presented a new concept of portable water purifier to produce clean water. The aim of the study was to satisfy the need for clean water in places where they do not have access to this service or to the electricity grid, for example at rural and natural disaster areas. The study demonstrated the design, and it was discussed its performance in this article. The AWP showed autonomy by using an autonomous photovoltaic system that uses solar energy for its operation, the prototype was designed to operate up to 8 hours a day and generates a water flow of 112 L/day and the capacity of batteries gave a prolonged autonomy (4 days) to ensure the uninterrupted operation of the system.
It showed high efficiency on removing microbiological and chemical agents (up to 50-100%) such as total coliforms, fecal coliforms, total alkalinity, total hardness, total solids, chloride, sulfate and heavy metals. For chemical agents the decrease was from 70 to 99% after AWP treatment, and all the chemical and microbiological analyses showed total removal of E. coli and coliforms were achieved. The AWP prototype integrated different mechanisms of adsorption, ion exchange, reverse osmosis, ultraviolet radiation, disinfection and clarification.
The design of purification steps such as microfiltration, ultrafiltration, nanofiltration, reverse osmosis, disinfection, clarification and ion exchange processes allowed to obtain an extensive range of removal of contaminants and heavy metals compared to other purifiers, for that reason this novel prototype can remove toxic chemical contaminants such as heavy metals. The results showed that the ion exchange column evaluation with zeolite could be used effectively for the removal of heavy metals from raw water. The evaluation on raw natural waters reveals that this prototype is suitable and appropriate to treat water from different sources, with high concentrations and different types of contaminants. Resulting in clean, healthy, and safe water for human consumption, with good taste, odor and color.
Conflict of interest
The authors have no conflict of interest to declare.
Financing
The authors received no specific funding for this work.

