


 nueva página del texto (beta)
 Inglés (pdf)
 Artículo en XML
 Referencias del artículo
 Enviar artículo por email
 Citado por SciELO
  Similares en
SciELO
Similares en
SciELO 
 Permalink
1. Introduction
The design of low power data acquisition systems has seen a significant development in recent years, mostly due to the large number of existing applications for wearable devices. As a consequence, researches on Low-Power Wide Area Networks (LPWAN) are increasingly gaining popularity in industrial and research communities because of its low power, long-range, and low-cost communication characteristics (Mekki et al., 2019). (Bembe et al., 2019) show a survey about the usage of LPWAN for the Internet of Things (IoT). Low power researches have also increased the interest in Energy harvesting-powered systems to allow sensor nodes to work without no need for battery (Tjukovs et al., 2018). Even on advanced topics of artificial intelligence, authors have shown special attention towards achieving low power solutions (Grineva et al., 2017).
Most of the studies on low power consumption have been focused on Wireless Sensor Networks (WSN) since the hardware associated with wireless communication has been typically considered as the highest consuming subsystem (Chéour et al., 2018; Chulde & Cantero, 2017; Tjukovs et al., 2018). However, the considerable success of wireless data transmission networks has caused the development of many low power nodes (Quiles et al., 2015). (Kalantarian et al., 2015) and (Paci et al., 2016) show that using a local storage strategy is not always a less consuming choice when compared to wireless communication hardware. From a more general point of view, Wireless Sensor Nodes can be seen as a particular case of Sensor Nodes that stores the acquired data and receives configuration parameters through a wireless medium.
Several works have been done on the field of low power consumption nodes; however, energy analyses are mostly made from authors' personal experiences on low power designs and traditional recommendations on low power consumption systems design.
Two main approaches have been found in the bibliography related to low power systems analysis: hardware-based approaches and time-based approaches.
Among the works presented on the hardware-based approach, there is the one presented by Kumar and Singh (2015)), which shows a comparison between the power consumption of the given design with others discussed in the literature review. Power consumption is given as the contribution of independent hardware modules. Authors do not indicate the way current values are obtained, and they do not include a time analysis either. The work lacks generality by requiring to find works using the same kind of hardware blocks as they do, not allowing, therefore, a comparison with other works of the same application.
(Abdal-Kadhim & Leong, 2020b), presents a mathematical model for a wireless sensor node power flow and consumption powered by energy harvesting is shown, based on the work introduced by Abdal-Kadhim and Leong (2018). Nodes of a sensor network are divided based on the used hardware: microcontroller unit (MCU), sensor, wireless module, energy storage, power conditioning circuit, and energy harvester. Even including some time-based analysis, no sufficient generality is achieved by only including the wake-up, take readings, transmit, and sleep tasks on the firmware's main cycle. Besides, blocks on the presented model include the wireless transmitter, which could be used for signaling data and not only to store received data.
(Hesse et al., 2016) divide the system’s blocks, for modeling purposes, into Sensors, Transceivers, Memory, Interfaces, Microcontroller, Converter, Battery. In several cases, it is appreciated that two or more blocks share a common task, and yet energy consumption is analyzed independently.
Another problem with hardware-based analysis occurs when only datasheet information is used. Manufacturers, in most cases, do not offer device's information on every possible setting, in some other cases, measurements do not correspond to values indicated on datasheets (Gomez et al., 2019; Ikpehai et al., 2019; Ruan et al., 2017; Vilajosana et al., 2014).
On the other hand, time-based studies allow only an analysis of the system as a single unit, preventing a more detailed analysis. (Gomez et al., 2019) analyze the power consumption as the energy of the firmware's main cycle, including a determination of the states through which the system goes. An energy analysis was preferred instead of current or power since it offers information about the duration of a state. However, the study is very particular for the case of Sigfox technology and not applicable to other kinds of sensor nodes.
(Chulde & Cantero, 2017) present another work on modeling of low power sensor nodes that uses a time-based analysis. Authors resume the tasks of low power wireless sensor devices in three: data sampling, data processing, and communication. Firmwares developed for the nodes were analyzed in terms of radio power consumption since authors affirm that the radio transceiver is the most power demanding component of the WSN node. The system's behavior was divided into four states: MCU active, MCU in low power mode, Radio listening/receiving, and Radio transmitting. This approach limits an integral analysis, which includes a more general set of tasks and their cost on the overall consumption. Besides, it limits the system's behavior to only four states, and the same current measuring method is applied for each state.
(Morin et al., 2017) present a model derived from the study made by Vilajosana et al. (2014). The energy consumption is determined by getting the power required in each of four states (Tx, Rx, Idle and Sleep) and the duration of each state. Synchronization is one of the periodical tasks performed by the system; however, its contribution to energy consumption is included with data storage by offering values of energy in transmission and reception. This choice prevents researchers from comparing a system that does not include the task of synchrony but shares similar hardware and acquisition tasks.
(Lin et al., 2019) make another time-based analysis. Authors calculate power consumption by determining current-time product. Five current regimes were identified on a period of the system (sleep, send, delay, receive, step counter) and the current-time product of a period is determined through an expression that relates it to the current-time product of each of the current regimes. One of its main problems lies in the lack of correspondence between the regime and the set of hardware components that provokes the measured current levels. (Bhoyar et al., 2019) also use current-time product in their work. Even when the final results are given as the average current values, the charge of the entire task is first calculated, and the average value over the time spent is determined.
The existing diversity of criteria has not allowed the creation of a general model, which allows a more fair and useful comparison between sensor nodes of different applications, hardware platforms, and field of action.
The present work introduces a new approach focused on the division of a sensor node by functional blocks for energy analysis, unlike most of the existing works, which are split by hardware or time-based analysis. A set of parameters is offered that gives a more detailed prospect on the real cause of an increase in the energy consumption of a Low Power Sensor Node and uses the best features from both approaches.
2. Low Power Sensor Node
The problem that arises in most of the existing works on Low Power Sensor Nodes (LPSN) is that analyses are made dividing the system into hardware blocks rather than functional blocks. On several occasions, this choice hides the bond among hardware blocks executing the same task, and no valuable comparison can be made with other equivalent systems.
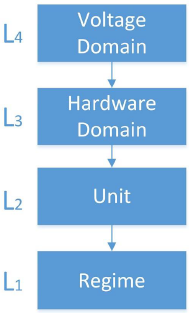
Based on the existing works, the approach proposed in the current work is to split any sensor node into six blocks: Power Unit, Sensing & Acquisition Unit, Controlling Unit, Heading Unit, Low Power Processing Unit, and Storage Unit, related among them as shown on Figure 1.
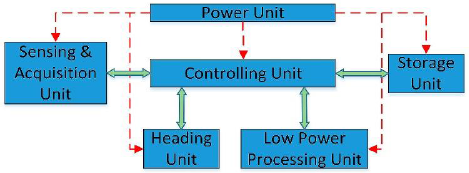
By grouping hardware blocks with the same function within the system, common functions for applications of different fields can be compared. The present approach resumes the determination of LPSNs’ energy consumption to an expression including a sum of all its blocks' energy, which has already been among researchers' interests (Vilajosana et al., 2014). To achieve such an expression, an analytical formulation, similar to the one given by Morin et al. (2017), is presented. Five principles must be taken into account to analyze power consumption in the current approach:
a) Controlling unit interacts with the rest of the blocks; therefore, the energy of each functional block is analyzed as the energy of the controlling unit and all the hardware modules associated with that function.
b) For each current regime, energy is determined using the most appropriate current measuring method.
c) Energy is determined on a period of the firmware's main cycle of execution, in case a function is implemented on a more extensive period, average energy per cycle should be determined.
d) A function can be executed in several time slots on a firmware's main cycle.
e) The energy consumption is given as the current-time product, which has units of charge, as long as there is a single voltage domain. In case a comparison should be made with a system where different source supply voltages are used, the current-time product should be multiplied by the voltage to get energy magnitude.
Point a) can be obtained from Figure 1. It is more practical to measure current with all the associated hardware blocks for a function since, in most cases, the hardware blocks cannot be left working by themselves without a controlling unit connected to it.
Point b) is related to the difference that can exist on current levels within a system. If the same current measuring method is applied all the time, erroneous results can be obtained (Abdal-Kadhim & Leong, 2020b).
Point c) includes the cases of functions that are executed more infrequently for power saving purposes or the application's constraints, as it could be date-time acquisition or synchronization. This adjustment allows the inclusion of a broader set of applications to the presented model since all parameters are adapted to a single cycle of firmware's main cycle.
Point d) specifies that a function is not limited to an action that is performed in a continuous-time interval (as time-based approaches) but rather the function itself, which can work in a discrete set of time intervals.
Point e) indicates that it is more appropriate to analyze the energy consumption as the charge consumed for a task since it is more suited to an analysis based on the functional blocks rather than hardware blocks.
In the next sections, each of the units is presented along with some of the best strategies to lower their energy consumption.
2.1. Power Unit
Power Unit is the one in charge of providing the system's power source. It has been the focus of several studies in recent years, mostly on:
Energy harvesting. An energy harvesting system is composed of an energy harvesting power supply and a low-power load. In such systems, the energy is collected from the environment using a transducer that transforms the ambient energy into electrical energy for supplying energy autarkic electronic devices (Spies et al., 2015). Much attention has been paid to it by wearable devices studies (Dionisi et al., 2016; Kuang et al., 2017; Khan et al., 2017; Paci et al., 2016; Piscitelli et al., 2019). More recently, (Abdal-Kadhim & Leong, 2020a) presented a dual source energy harvester based on a thermal energy harvester and a piezoelectric harvester; authors indicate that the strategy showed an excellent capability for recovering 90 mW of power. More recently, attention has been paid to RF harvesting and Wireless Power Transfer (Tjukovs et al., 2018). This latter approach is focused on powering sensor nodes in some area around RF energy transmitter, instead of just capturing the available RF energy. (Abdal-Kadhim & Leong, 2018) show a comparison among different energy sources.
Power Management. A common approach on power units has been the placement of a power management module (PMM) in between the energy harvester and the sensor node to manage the energy mismatch by harvesting as much power as possible from the energy used PMM techniques: Power Management of the Radio and Frequency & Voltage monitoring. Another issue on power management has been the loading effect and the start-up problem of a sensor node on a PMM (Ruan et al., 2017). Some attempts have been made to develop an energy-aware interface between the PMM and the sensor node to manage the energy flow from the energy storage element and activate the sensor node (Ferrari et al., 2013; Kuang et al., 2017; Ruan et al., 2017).
Voltage Monitoring Frequency Scaling. One of the most attractive techniques nowadays is Dynamic Voltage and Frequency Scaling. It aims at applying both voltage and frequency online tuning to efficiently minimize power consumption while running at a frequency, in line with the applicative constraints (Gaillardon et al., 2015). More recently, (Chéour et al., 2018) presented a study on Voltage Monitoring Frequency Scaling.
2.2. Controlling Unit
The controlling unit is the one who manages all the other units and plays an essential role in lowering power consumption since it manages the duty cycle of all the hardware modules.
Some of the most critical aspects when choosing the controlling unit are:
the presence of low power consumption modes (directly related to the ability to modify the active clock sources).
the capability to work in parallel with other units.
integration with most of the units.
Some of the hardware platforms which have been used as a controlling unit are MCU, Single Board Computers (Sheikh et al., 2017), and Field-Programmable Gate Array (FPGA) (Jafari et al., 2018; Ju et al., 2020; Lee et al., 2016). (Karray et al., 2018) presented an excellent survey on some of the most used platforms used as a controlling unit.
Motes have also been widely used recently. (Alioto, 2017) made a survey of some of the most used motes, a comparison with several MCUs is also included.
Microcontrollers are among the platforms that fit the best the principles mentioned at the beginning of the current section since the usage of low power consumption modes is typically included, and internal peripherals usually fit the second and third aspects. (Reverter, 2020) determines the energy reduction of the "Peripheral-Triggered peripheral" approach and shows the benefits of reducing Central Processing Unit (CPU) interventions.
According to (Conti et al., 2016), state-of-art Ultra-Low-Power microcontrollers can work with less than ten milliwatts. Examples include the SiliconLabs EFM32, Texas Instruments MSP430 families of MCUs, and Ambiq Apollo (Conti et al., 2016).
2.3. Sensing & Acquisition Unit
The Sensing & Acquisition Unit includes the transducer used to acquire signals and the communication interface with the controlling unit. According to (López-Lapeña et al., 2016), although the major research efforts have been focused on lowering the energy spent by the communication system, the measurement process can spend more energy whenever not all the measurement data are transmitted.
The function of the communication interface with the controlling unit is to convert the signal from the sensor's output to a digital signal which can be used by the controlling unit. The sensor's output defines the interface.
Analog sensors' output usually includes an Analog-to-Digital Converter (ADC) and a signal conditioning block. For power consumption, the best choice is to have a controlling unit with an integrated ADC and Direct Memory Acces (DMA) controller to make all the acquisition without the intervention of CPU. Data buffers are also essential in embedded applications, where the processing of the information must continue while the data transfers are completed (Quiles et al., 2015).
Figure 2 shows an example of the impact of DMA usage. In that case, an example is shown where data is acquired from ADC, moved to a buffer on Random Access Memory (RAM), and written to an SD card after 256 samples are acquired. Three DMA use cases are shown: no usage of DMA, usage of DMA only to send data via SPI to SD Card and usage of DMA to save data coming from the ADC into RAM and to send data via SPI to SD Card.
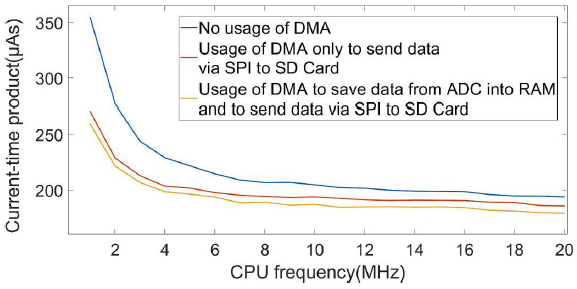
Figure 2 Charge consumption dependency with DMA usage and CPU frequency for system acquiring samples from ADC and storing in SD Card.
(Reverter & Gasulla, 2019) make an experimental characterization of the energy consumption of ADC embedded into microcontrollers operating in low power mode.
Another field of study within the Sensing & Acquisition Unit is the "Direct Interface Circuits" (López-Lapeña et al., 2016), which is useful in cases where no integrated ADC is present.
For digital sensors' output, the first important choice is the communication protocol; (Mikhaylov & Tervonen, 2012) show a comparison of the traditional communication interfaces. Some aspects to attend when choosing the communication protocol are the amount of heading information required by each protocol, since, in general, the bigger the header is, the larger will be the acquisition time.
By using the model presented in this work, it is possible to compare systems with different types of interfaces or different data acquisition strategies, since the sensing and acquisition tasks are analyzed as a unit. Otherwise, it would not be possible to make a fair comparison of systems having an external acquisition module and those who use a Direct Interface Circuit, which mixes the sensing and the acquisition tasks.
2.4. Storage Unit
Storage unit is present in almost every sensor node since data is always expected to be acquired and stored for future analysis. By defining a storage unit on the current model, wireless and wired storage devices are treated as the same, and it is possible to compare both kinds of systems. Besides, it allows a distinction regarding the nature of data: the storage unit is related to data acquired for analysis and not to signaling information from the measurement.
Although wireless communication hardware has been traditionally known for being the highest consuming module, LPWAN technologies have seen considerable development in recent years (Mekki et al., 2019). LPWAN is increasingly gaining popularity in industrial and research communities because of its low power, long-range, and low-cost communication characteristics.
Some of the LPWAN's leading technologies are LoRa (Augustin et al., 2016), Sigfox (Gomez et al., 2019) and NB-IoT (Sinha et al., 2017). (Mekki et al., 2019) make a comparison of the technologies mentioned above. Authors get to the conclusion that Sigfox and LoRa are advantageous in terms of battery lifetime, capacity, and cost. Meanwhile, NB-IoT offers benefits in terms of latency and quality of service. Other surveys and comparisons are shown in (Bhoyar et al., 2019; Sinha et al., 2017; Vejlgaard et al., 2017).
New technologies can further reduce power consumption by limiting the radio activities to their strict minimum, as is the case with a wake-up radio (WUR) (Wu et al., 2010). The interest for WUR and asynchronous communication is constantly growing and many researchers are proposing hardware and software solutions for several radios and protocols, even for already energy-efficient low-power and long-range sub-GHz communication such as LoRa and Bluetooth Low Energy (Elgani et al., 2018).
For wired storage units, some traditionally more used means are Universal Serial Bus (USB), RS-232, and SD Card, being the latter the most common storage device for low power applications.
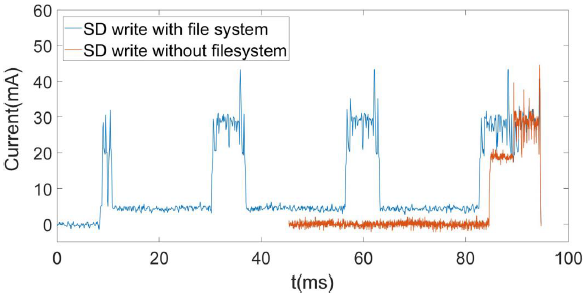
Most of the existing works, using local storage on an SD Card, use a file system to store data as text or excel files (Erraissi et al., 2018; Hadi et al., 2018; Niklaus et al., 2017; Villagrán et al., 2017). However, as it has been stated by Wang et al. (2009), microcontrollers read and write more efficiently to SD Card on blocks of 512 bytes. The waveform of current when writing the same amount of information on SD Card using and not using a file system is shown in Figure 3. As can be observed, significant reductions in energy consumption can be obtained when storing data on SD Card without a file system.
2.5. Heading Unit
Heading unit is the name given in this work to the unit in charge of the information or actions that are necessary for a proper interpretation of data, such as date, time, synchronization, description of network nodes, geographic location, conclusions on data processing.
Origin of heading information can be local or remote. Among the hardware modules which have been more used as a heading unit with a local origin of information, there is the Real-Time Clock (RTC) and Global Positioning System (GPS) modules. When the origin of heading information is remote, wireless communication hardware is typically used.
Usage of RTC is widespread on LPSNs (Hadi et al., 2018; Liu et al., 2015; Quiles et al., 2015; Villagrán et al., 2017) since it allows the system to stay on a more restrictive low power consumption mode during most of the time and return to active mode when a predefined time is indicated, or an alarm is set. (Quiles et al., 2015) present a work where a non-volatile random-access memory is used with RTC to allow saving power in case of making acquisitions at very low frequencies.
In addition to date-time information, on certain occasions, it is necessary to keep several isolated nodes synchronized. Synchronization can be either made without a physical connection between any two nodes or through a wired network communicating them. Currently, one of the most utilized synchronization mechanisms is the usage of the Precision Time Protocol (PTP), which is defined in the IEEE 1588 standard (Lee & Eidson, 2002). Even though PTP was initially created for wired networks, some recent efforts have been made to use it on low power wireless networks (Anwar & Srivastava, 2017).
In the case of isolated nodes synchronization, GPS receivers have been widely used (Fuhrmann et al., 2014; Gasparini et al., 2007). Although GPS systems have been associated with relatively high power consumption, some efforts have recently been made to reduce it (Manohar et al., 2018). Besides, GPS systems have been widely used to indicate geographic position (Cataldo et al., 2017; Gomez et al., 2018; Kozyra et al., 2017; Lin et al., 2019).
Regarding the heading unit for the description of network nodes, (Hussein et al., 2017) and (Jothiprakasam & Muthial, 2018) indicate how the choice of the routing protocol can play a central role in the extension of battery life on LPSNs.
2.6. Low Power Processing Unit
Most of the existing sensor nodes require some data analysis in order to make decisions. The processing complexity included on the sensor node has a significant impact on its power consumption since there is usually a trade-off between increasing local processing to reduce the amount of information to store or reducing the processing time and store more data. In terms of the current approach, this trade-off can be presented as increasing the processing unit's energy consumption to reduce the storage unit's energy or reducing the processing unit's energy consumption and increasing the storage unit's energy consumption.
By using the current approach, the trade-off mentioned can be correctly treated since only the storage and the processing unit should be analyzed to get a proper view of the best scenario, the rest of the units are independent of the chosen strategy.
Following the parallelism principle mentioned in Section 2.2, the processing unit should be composed of a hardware module with the capability to work in parallel with CPU instead of being done by the CPU.
One of the traditionally more used hardware platforms used as a processing unit is the Digital Signal Processor (DSP), still used at present as a low power solution to process data (Kumar et al., 2016). DSPs can efficiently perform some signal processing functions such as vector operations much faster than can be achieved by using firmware running instructions on a CPU (Lingam et al., 2018). According to (Karray et al., 2018), a sensor node architecture based on DSP could be in two forms: the DSP used as a co-processor or as the central processor.
Another approach is the use of dedicated Application Specific Integrated Circuit, which has been extensively used on traditional fields of applications of ultra-low-power devices, such as wearable or implantable sensors for health monitoring (Rossi et al., 2017). FPGA platforms have been widely used for hardware acceleration due to its advantages regarding the throughput performance (Harize et al., 2013). However, Complex Programmable Logic Device (CPLD) has been, in most cases, preferred over FPGA since using an FPGA typically increases the cost and power consumption as compared to the CPLD (Quiles et al., 2015).
To achieve the integration of the processing unit with the controlling unit, several microcontroller manufacturers have included hardware processing modules, such as the Low Energy Accelerator module (Lingam et al., 2018) on the FR series of the Texas Instruments' MSP430 family of microcontrollers. Although microcontrollers show a poor performance when compared to programmable hardware platforms, some works have been made on near-threshold microcontrollers (Botman et al., 2014; Ickes et al., 2011), achieving a significant efficiency.
More recently, the PULP platform has been presented (Conti et al., 2016). It is a platform that features clusters of tightly-coupled OpenRISC cores to achieve high energy efficiency through parallelism. It has proven to be a platform of a high level of flexibility and programmability that does not come at the expense of energy efficiency.
2.7. Comparison with existing models
After analyzing each composing unit of the proposed model, a comparison with some other energy-aware LPSNs system designs is shown in Table 1.
Table 1 Comparison of several energy-aware LPSN's works with this paper.
| Approach | Work | Accuracy of current measurement |
Possibility to use model to compare with other systems |
Mathematical expression |
Energy consumption parameter |
Support for better decision-making when choosing design strategy |
|---|---|---|---|---|---|---|
| Hardware- based |
(Kumar & Singh, 2015) | No analysis in time is given, only independent hardware, source of power values or measurement methods are not given |
Only for systems with the same hardware structure, power values shown are not accurate since the interaction between controller and others is not included |
No | Power | Data of power of blocks’ interaction with the controlling unit is not given, therefore no good partial conclusions can be obtained |
| (Abdal-Kadhim & Leong, 2020b) | Current is analyzed in two different regimes, but the same measuring method is used |
Power is given and analyzed for separate modules, yet, the whole system is active, thus the offered values might not be valid to compare as unitary and independent values. |
Yes | Power | It does not allow an analysis of each module’s specific current regimes |
|
| (Ruan et al., 2017) | Current regimes for each task are not analyzed, a source meter is used to measure all the current |
It is not indicated if the tasks’ energy values are obtained by analyzing the entire system or only the hardware involved |
Yes | Energy | Current behavior for each task is not analyzed |
|
| Time- based |
(Gomez et al., 2019) | For each individual state, several current measurements are performed, although all the regimes are analyzed with a power analyzer. |
The defined states are application-specific, not general enough to include most of the Sensor Nodes |
Yes | Energy, Current |
States are well defined as well as the regime for each of them. It is not indicated if only the active hardware module associated to each task is included. |
| (Chulde & Cantero, 2017) | All the current regimes are measured with a shunt resistor and an oscilloscope |
The analyzed regimes are restricted to the states defined by Contiki OS. Current values are given for the chosen states but the entire node’s hardware modules are included for each task |
No | Current | Only for software design, not suitable for hardware modules’ choice |
|
| (Lin et al., 2019) | Not specified | Current consumption is given for different regimes, thus allowing the entire system to be compared with a similar one |
Yes | Current, current-time product |
Power consumption data is not related to the used hardware |
|
| Function- based |
This work | Analysis performed down to each unit’s current regimes allows using several current measuring methods. |
The division of Low Power Sensor Nodes in functional units includes most of the sensor nodes, making simple the task of comparing two different works with common units. |
Yes | Current-time product |
The hierarchy of analysis’ levels allow to make a deep study of the system’s current behavior, either provoked by the software design or the hardware's |
As it is shown, most of the studied models do not allow a detailed analysis of the different units' regimes, which is necessary for a proper design strategy. Our model includes the possibility of applying different current measurement methods for each regime, in opposition to the existing works, which, in the best of cases, choose one measuring method for the entire system. The division in functional units resolves the problem of some works, where no link between the hardware and software is made. As in other cases, an analytical formulation is given and the chosen energy consumption parameter is the current-time product, which has magnitude of charge and works as a middle point between energy and current.
3. Analytical Formulation
Following the idea of obtaining the overall energy consumption by using the units' charges described in Section 2, it must be noticed that some units might share some hardware modules in addition to the controlling unit, which interacts with all the units. For this reason, it was decided to group the units which share a set of hardware modules in a “Hardware Domain”. With that arrangement, the node's charge can be determined using Eq. 1.
where N is the number of hardware domains,
Since a hardware domain associates several units that have a set of hardware modules in common, for each hardware domain,
where J is the number of units corresponding to the hardware domain,
An effective choice to determine the charge of a unit is to get the charge of every current regime independently since there are different current measuring methods (Abdal-Kadhim & Leong, 2020b) suited for each regime. Measuring the charge of a specific current regime is an easier task since, generally, designers can let the system executing only one task repeatedly. A time approach is suitable for these cases. Following these ideas
where K is the number of different current regimes for a given unit,
For each current regime, the charge can be determined by using Eq. 4, which indicates that it can be calculated as the average current multiplied by the duration of the regime.
where M=number of current samples obtained from the measurement device and
The determination of Eq. 4 can be explained in Figure 4. As can be seen for that figure, there are three current regimes. The base regime was called like that to differentiate it from the others since that regime is always present in an LPSN. From that figure, it can be seen that
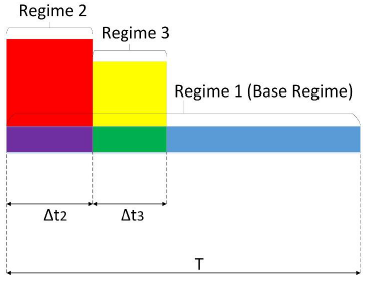
Figure 4 Visual representation of current consumption for a unit with three different current regimes.
where
From Eq. 5 it can be observed that when
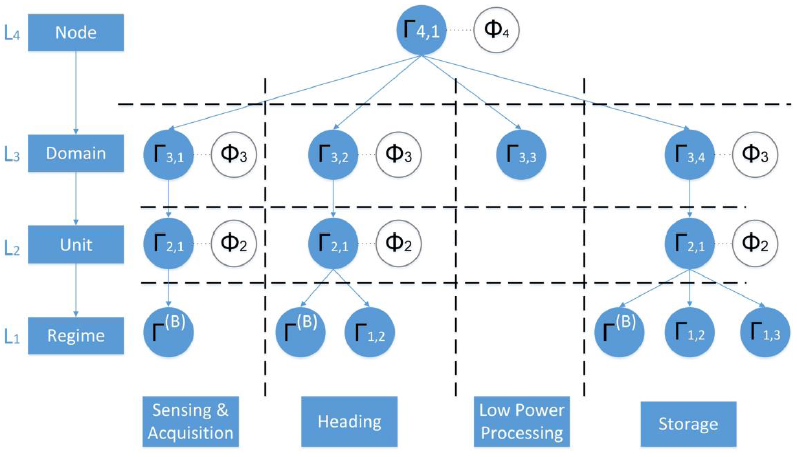
All the steps described above can be resumed in a 4 levels hierarchy as shown in Figure 5.
Therefore, the charge of the jth block at the ith level can be defined using Eq. 6
where N equals the number of blocks of the level i-1, which form the block j of level i (
Taking into account that
with M equals the number of current samples obtained from the measuring device.
A more straightforward case arises when every unit uses independent hardware (other than the controlling unit), in that case,
In the case of
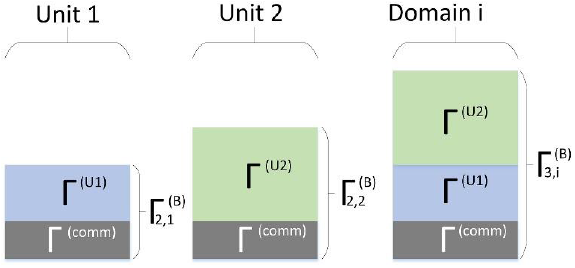
From Figure 6, it can be noticed that, according to its definition,
In general, for a domain with N units, there will always exist N+1 equations and N+1 unknowns, thus, there will always exist a solution for the equation system.
The same idea can be applied for
A simple approximation of Eq. 2 can be obtained when
4. Case Study
A case study is presented where the current model is applied to determine the system's energy consumption.
The case study is a monitoring system for hydraulic networks. Events are acquired by taking pressure samples at 3000 samples/s and forwarding them into an SD card once a 256 samples buffer (equivalent to an SD Card sector of 512 bytes) is filled. Date-time information is obtained through an RTC.
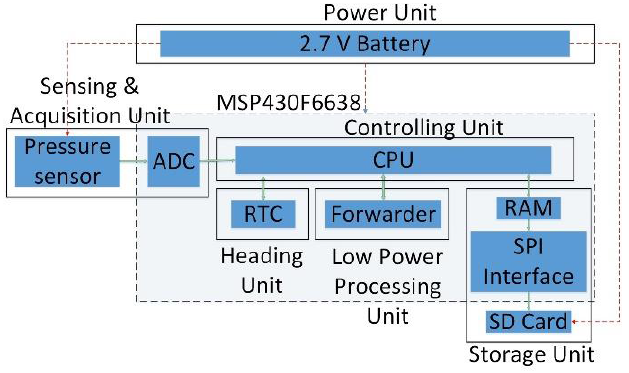
The Controlling unit is an MSP430 microcontroller from Texas Instruments (MSP430F6638). Such a microcontroller is well suited for applications with an LPSN, since, as stated in Section 2.2, it integrates most of the remaining units. The Sensing & Acquisition unit is composed of a pressure transducer based on the Keller 9S and the microcontroller's internal ADC. The heading unit is implemented using the microcontroller's internal RTC. Since the system forwards data from the ADC's output, the Low Power Processing Unit does not add any charge component (its output is the same as its input). The storage unit is composed of an SD card, which receives data from the microcontroller's SPI interface. It also includes the operation of moving samples from the ADC's output to a buffer in RAM using DMA controller.
Following the general block diagram of Figure 1, the particularization for this case study can be seen in Figure 7. The entire system was split on the hardware modules that were used. It can be noticed that most of the hardware modules are included on the MSP430F6638(gray area), which contributes to the reduction of power consumption. Therefore, only three physical hardware modules were used: microcontroller, SD Card, and pressure sensor. It can also be noticed that there is no hardware module shared by any two units, therefore every hardware domain includes only a unit. For this case, the following correspondence is made: Domain 1 is the Sensing & Acquisition Unit, Domain 2 is the Heading Unit, Domain 3 is the Low Power Processing Unit, and Domain 4 is the Storage Unit.
Following Eq. 8:
Since every unit uses independent hardware modules, each hardware domain is composed of a single unit, independent from each other, and
Following to the inferior level (unit level), for every unit j from each domain, Eq. 10 is verified:
Each
Two methods were chosen for current measurements: shunt resistor plus oscilloscope for high regimes and ammeter for low regimes in steady-state. An MR25-series shunt resistor with a measured value of 3.007 Ω and a temperature coefficient of 50 ppm/ºC was chosen, and it was placed as close of the device under test as possible. All the current measurements were repeated 10 times and for all cases, the current-time product was obtained with a standard deviation under 10%. All the measurement results were processed and presented using MatLab.
For the Sensing & Acquisition unit (domain 1), it was not possible to distinguish a regime other than the base regime, however, as stated by Reverter and Gasulla (2019), in many cases the effect of ADC's regime changes could be irrelevant since the ADC has a minor contribution on the overall energy consumption of the system. Therefore, only the charge for the base regime was determined, thus
For the heading unit (domain 2), two regimes are used:
Both regimes can be determined by letting the system with only the microcontroller and the RTC. The base regime is determined when no date-time information is being read, and regime
With the period of a main cycle and the current, a value of
To obtain
For the storage unit from (domain 4), three regimes are used as it can be observed in Figure 8 when writing on SD card: the base regime, a medium regime, and a higher regime. An analysis was made of the current's behavior for the different regimes. The CPU clock frequency was increased from 1 MHz to 20 MHz in steps of 5 MHz, and the current's waveforms for each CPU clock frequency were superposed. Results are shown in Figure 9. As can be observed from that figure, the high regime remains nearly constant for every frequency value. For the medium regime, it can be observed that there is a reduction of total time in write operation as the CPU clock frequency increases, whereas the current magnitude increases with frequency.
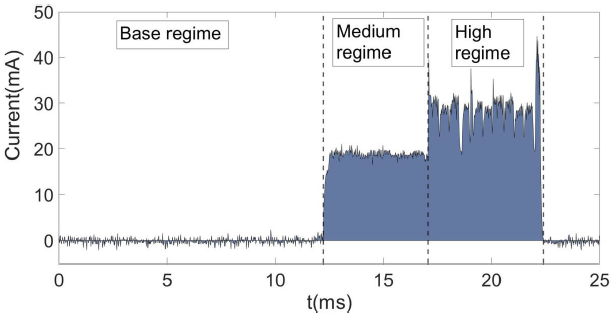
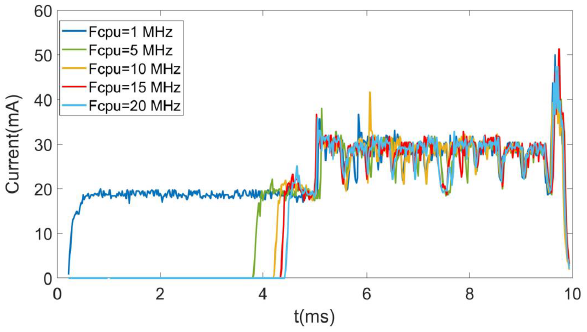
Figure 9 SD card's current consumption when writing a sector for several CPU clock's frequency values.
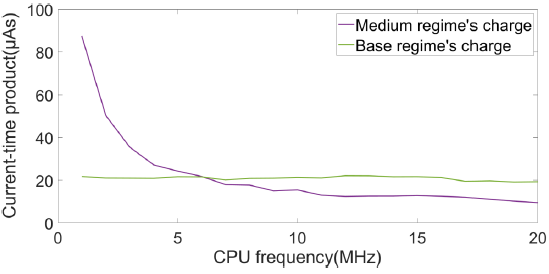
Current-time product was analyzed for every frequency value to analyze if the reduction in time has a bigger influence on the energy consumption than the increase in current value. DMA was used to move samples from ADC to RAM and from RAM to SPI interface. Results are shown in Figure 10. It can be observed that the medium regime's charge decreases when the CPU clock frequency increases due to the reduction in time to finish the write operation on SD Card. For the base regime, there is no remarkable decrease. When determining consumption with optimized parameters
The value of
Using Eq. 6 for level two of domain 4,
A summary of each unit's charge is shown in Table 2.
Table 2 Summary of all the units' charge.
| Unit |
|
|---|---|
| Sensing & Acquisition | 136.1273 |
| Heading | 8.1773 |
| Storage | 167.818 |
With all the values of level two and taking into account that the level three's charge equals their corresponding level two's charge, it only remains to determine
To find
If any of the results were to be compared with an LPSN using a different voltage value, these charge values should be multiplied by the voltage. If current values had to be obtained, the charge values should be divided by T=85.3 ms.
5. Conclusions
A function-oriented energy model is presented in the current work, which combines the best of hardware-oriented and time-oriented analysis. The choice of a function-oriented approach to analyze energy consumption gives more practical and useful values than hardware-oriented and time-oriented analysis, by allowing a comparison among different applications that might share a set of units in common.
The analytical formulation is presented in a compact, iterative and hierarchic form. Charge could be determined only at the desired level for purposes of comparison if all the regimes' charge consumption values are given, which allows a simpler validation of a design strategy.
The presented hierarchy reduces the problem to find only the current regimes of similar levels, which would allow the use of the most appropriate current measuring method for each case. The application of the model to the case study allowed us to find the best design strategy to write on SD Card, by distinguishing regular patterns on the current consumption when determining the current for each regime of the Storage Unit.
As future work, the current model will be applied to sensor nodes of different applications sharing functions in common to compare design strategies. For instance, transmitting the equivalent of a sector of data from SD Card through a LoRa network to evaluate the suitability of using a local or a remote storage unit. In addition, the model will be extended to systems having more than one voltage domain, including the relationship among blocks of inferior levels explained in this work.
Conflict of interest
The authors do not have any type of conflict of interest to declare.
Financing
The authors did not receive any sponsorship to carry out the research reported in the present manuscript.

