


 nueva página del texto (beta)
 Inglés (pdf)
 Artículo en XML
 Referencias del artículo
 Enviar artículo por email
 Citado por SciELO
  Similares en
SciELO
Similares en
SciELO 
 Permalink
1. Introduction
Electron beam radiotherapy is the most widespread and currently treatment modality utilized to treat superficial cancers. The relatively uniform build-up dose followed by the rapid dose falloff as the beam penetrates deeper into the target justify its clinical usage (Funk et al., 2016; Toutaoui et al., 2009).
In electron therapy, the energy spectrum and bremsstrahlung dose are important clinical characteristics of electron beam modelling (Deasy et al., 1996; Ding & Rogers, 1995) as the beam is composed by a mixture of primary and secondary electrons and photons produced in the internal structures of the medical accelerator (Faddegon & Blevis, 2000; Zhu et al., 2001).
The knowledge of the energy spectrum is critical characteristic when the purpose is accurate dose calculation since it affects the dose distribution (Chvetsov & Sandison, 2002; Faddegon & Blevis, 2000). Furthermore, the energy spectrum may also be relevant in dosimetry (Renner et al., 2014), treatment planning (Deasy et al., 1996), realistic simulations of the beam (de la Vega et al., 2008; Renner et al., 2014) and other clinical problems.
Radiation source modelling by Monte Carlo (Rogers et al., 1995), experimental measurement by means of a magnetic spectrometer (Deasy et al., 1996; Renner et al., 2014) and inverse reconstruction are the most commonly approaches to obtain the energy spectrum of an electron beam (Chvetsov & Sandison, 2002; Zhengming & Jette, 1999).
Inverse reconstruction employs an appropriate mathematical model to extract the spectrum from its dept-dose curve. Advantages of inverse reconstruction over the other approaches include not being necessary to have detailed knowledge about the geometry and composition of the accelerator head; no necessity of building the accelerator head’s phase space file, it is computationally fast and only demands depth-dose data which are easily measured in any radiotherapy center (Wilches-Visbal & Da Costa, 2019b). Limitations of inverse reconstruction are related to the determining of the bremsstrahlung dose, the solution of the ill-conditioning of the mathematical model (Chvetsov & Sandison, 2002; Wei et al., 2006) and the accuracy of off-axis dose data.
Since the percentage depth-dose curve (PDD) strongly depends on the electron spectrum, much information about the spectrum is already contained in it (Zhengming & Jette,1999). Fredholm integral equation is used to mathematical linking the centralaxis depth-dose curve to the incident energy spectrum through a kernel function of monoenergetic depth-dose curves (Faddegon & Blevis, 2000; Hansen, 1992; Zhengming & Jette, 1999). As the Fredholm equation is ill-posed (Hansen, 1992; Kabanikhin, 2008) some regularization method must be used to remove the ill-conditioning of the equation and thereafter getting a useful and stable solution (Golub et al., 1999; Hansen, 2007). Regularization function can be solved by using matrix tools related to singular values decomposition (Hansen, 1992, 2007) or by using an optimization function since the regularization involves a least-square problem (Golub et al., 1999).
In this work, Tikhonov regularization-generalized simulated annealing synergy is employed for obtaining the electron energy spectrum and bremsstrahlung dose at the same optimization process. The depth-dose curves were measured in water for a variety of nominal electron energy beams from a Varian Clinac 21X linear accelerator. Monoenergetic depth-dose curves and simulated depth-dose curves from reconstructed spectra were obtained via PENELOPE 2008 (Salvat et al., 2008) assuming the radiation source is a point source of divergent beam. The gamma index criterion was used to verify the accuracy of this method such as in Wilches-Visbal and Da Costa (2019b).
2. Materials and methods
2.1 Electron Spectrum Unfolding
The unfolding equation regards the electron spectrum incident upon the water
phantom surface,
where
As clinical electron beams have a certain quantity of photons, some part of
where
Eq. (2) can be discretized as,
where
The Eq. (3) can be represented as a linear equations system,
where
As Eq. (4) is ill-conditioned (Kabanikhin,
2008), i.e., its solution is extremely sensitive to arbitrarily small
perturbations of the system (Hansen,
1992), the calculation of
Tikhonov regularization, one of the most effective and popular methods for the solution of ill-posed problems (Silva Neto & Cella, 2006; Tikhonov, 1963), filters out the noise in the input data by adding some prior information about the desirable solution (Golub et al., 1999; Hansen, 2007).
In accordance with Hansen (2007), the
fundamental idea of Tikhonov regularization is to define the regularized
solution
where λ is the regularization parameter, L is a derivative operator matrix and
To determine the electron energy spectrum, the functional
Generalized simulated annealing (GSA) is one the most powerful and widely used optimization algorithms for the solution of global multidimensional functions (Schanze, 2006; Xiang & Gong, 2000). The main idea of GSA is mimicking the annealing, where metal is warmed up to the fusion temperature and immediately after it is cooled sufficiently slowly to achieve a crystalline structure free from imperfections (Wilches-Visbal & Da Costa, 2019a).
GSA function works well in many situations for
2.2. Reconstruction methodology
The methodology used for obtaining the electron energy spectra and the bremsstrahlung dose curves is summarized as follows:
(I) Experimental depth-dose curves,
(II) Maximum energy of electrons Emax is empirically adjusted as,
with, E, the nominal energy of electron beam and, R p , the practical range (Gerbi et al., 2009). Emax is the cut-off energy of the energy spectrum.
(III) The regularization parameter, λ, and regularization matrix, L, employed are the same of the previous article (Wilches-Visbal & Da Costa, 2019b).
(IV) The bremsstrahlung dose, Db, is determined by minimizing the Eq. (7) by means of GSA function (
subject to
(V) Bremsstrahlung dose is subtracted from the experimental depth-dose curve to obtain the pure electron depth-dose:
(VI) The regularized energy spectrum,
Once the energy spectrum is reconstructed, it is used to obtain the simulated depth-dose curve using the Monte Carlo package PENELOPE-2008 (Salvat et al., 2008, p. 248). The irradiation setup in the simulations is the same that were used for the monoenergetic depth-dose curves.
To verify the suitability of spectral reconstruction a comparison between the simulated and experimental depth-dose curves is carried out by means of the gamma passing rate criterion (Li et al., 2011). The same analysis is performed with the dose profiles for every energy beam studied. As no manufacturer provides the energy spectra at the phantom surface, the reconstructed spectra would be \estimated spectra" (Baird, 1981).
Gamma index (Г) is used to measure the coincidence degree of two dose distribution curves from combination of two factors: i) distance to agreement (DTA) is the distance between a point in the reference dose distribution curve (gold-standard) and the nearest point in the calculated dose distribution curve that has the same dose value, and ii) dose-difference (DD) is the difference between the calculated dose at each point to reference dose at that point (Low et al., 1998).
In 1D, gamma index is depicted in a circle with each axis being the quotient of DTA and DD regarding to its passing criteria as seen in Fig. 1.

According to Fig. 1, Г is calculated as the euclidean distance of two factors normalized to its respective passing criteria for each point. The minimum value of Г, ϒ, is selected and used to evaluate the concordance, such as (OncologyMedPhys, 2019; Low et al., 1998),
In this work, the gamma index passing criterion used to evaluate the suitability of the spectra reconstruction is > 95% with 2%/2mm for depth-dose curves, which is proposed by the American Association of Medical Physics (AAPM) (Chetty et al., 2007). For dose profiles is used a > 95% with 4%/4mm criterion. It is also explored what happens as more stringent criteria are applied to both the depth-dose curves (> 95% with 1%/1mm) and dose profiles (> 95% with 2%/2mm).
Analysis of gamma passing rate is done by using the CalcGamma function described and developed by Geurts (2017). In this paper, the experimental depth-dose curve is used as a reference and the global computation method is used for the gamma index calculations.
3. Results and discussion
Fig. 2 shows the reconstructed energy spectra at the phantom surface of the (a) 6, (b) 9, (c) 12 and (d) 15 MeV electron beams from a Varian Clinac 21EX accelerator.
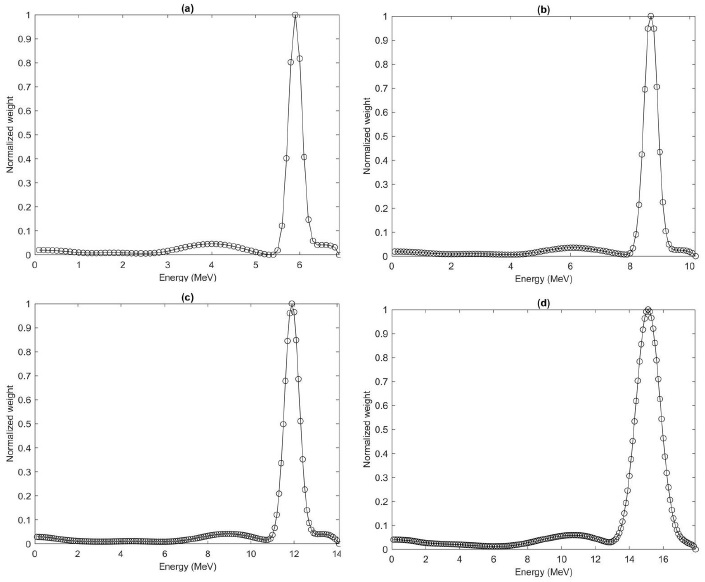
Figure 2 The electron energy spectra at the phantom surface reconstructed by generalized reconstructed simulated annealing for (a) 6 MeV nominal energy, (b) 9 MeV nominal energy, (c) 12 MeV nominal energy and (d) 15 MeV nominal energy. Field size 10x10cm2 at source skin distance (SSD) of 100 cm.
The most probable energy of the spectra was located at 5.9 MeV for 6 MeV, 8.7 MeV for
9 MeV, 11.9 MeV for 12 MeV and 15.1 MeV for 15 MeV nominal energy beam. The peak
width values expressed as
Fig. 3 shows the calculated bremsstrahlung dose by minimizing the Eq. (7) for every clinical electron beam. The x-axis is the depth in the water phantom whilst the y-axis the bremsstrahlung dose relative to the maximum value in the clinical electron depth-dose curve (electrons and photons).

Figure 3 Depth dependence of bremsstrahlung dose relative to the maximum value in electron depth-dose curve for beams of 6 MeV, 9 MeV, 12 MeV and 15 MeV of nominal energy. Field size 10x10 cm2 at SSD of 100 cm.
Contrary to Faddegon and Blevis (2000), Deng et al. (2001) and Wilches-Visbal and Da Costa (2019b), the method of linear extrapolation of the bremsstrahlung dose tail or the “Schiff method” has not been used for obtaining the bremsstrahlung dose.
The maximum contribution of bremsstrahlung dose to the experimental depth-dose curve was as much as 3.11% of the maximum dose for 15 MeV, 1.69% for 12 MeV, 0.81% for 9 MeV and 0.39% for 6 MeV nominal energy.
From Fig. 3 can be verified that as nominal energy increases so do the depth of maximum dose, build-up region, and maximum dose value just as it happens in X-ray megavoltage depth-dose curves (Brahme & Svensson, 1979; Deng et al., 2001; Rustgi & Rodgers, 1987).
Some of the important remarks between the bremsstrahlung dose curves calculated by the direct method and the linear-extrapolation one is: i) values of maximum bremsstrahlung dose from the direct method is lower; ii) as depth increases greater differences are found between the values of dose; iii) bremsstrahlung dose calculated from the direct method shows a better agreement to the tail region of the experimental depth-dose curves, just where bremsstrahlung contribution is most relevant.
Indeed, the maximum difference found, given in percentage points (pp), between the experimental and simulated (using the reconstructed spectra) depth-dose curves was 0.14 pp for 6 MeV, 0.16 pp for 9 MeV, 0.16 pp for 12 MeV and 0.22 pp for 15 MeV, which it indicates an optimum agreement in the tail region of PDD curves in Fig. 4. These deviations are less than those found by the extrapolation method (Wilches-Visbal & Da Costa, 2019b), above all for the greater energy electron beams in which the influence of bremsstrahlung dose is most critical (see 15 MeV electron beam in Fig. 4).

Figure 4 Comparison of simulated (plus-dashed line) and experimental (circle-dot line) PDD for beams of (a) 6 MeV, (b) 9 MeV, (c) 12 MeV and (d) 15 MeV of nominal energy. Field size 10x10 cm2 at SSD of 100 cm.
In Fig. 4 are displayed the experimental and simulated depth-dose curves for electron beams of nominal energy of (a) 6 MeV, (b) 9 MeV, (c) 12 MeV and (d) 15 MeV. Moreover, it is shown the depth-dose deviation (pp) computed by subtracting the simulated depth-dose from the experimental depth-dose, for every energy beam.
In Fig. 4 is shown a reasonable coincidence between the simulated and experimental depth-dose curves in terms of DD for all beams, except for the final part of the fall-off region for the electron beam of 15 MeV where DD ≥ 2%.
Optimum accordance is observed, in terms of DTA, given that no case DTA ≥ 1 mm in any energy electron beam.
Table. 1 shows the gamma passing rate under 2%/2 mm and 1%/1 mm criterion for each electron energy beam.
Table 1 Comparison of the simulated and experimental PDD curves by means of the gamma passing rate criterion. For a gamma passing greater than 95% the simulated PDD curves are considered approved.
| Nominal Energy (MeV) | Passing Rate (%) | |
| 2%/2mm | 1%/1mm | |
| 6 | 100 | 100 |
| 9 | 100 | 100 |
| 12 | 100 | 100 |
| 15 | 100 | 99 |
In Table 1, it is observed that the passing rate is greater than the acceptance threshold established at 95% for all beams. Therefore, it can be said that there are no clinically significant differences between the simulated and experimental depth-dose curves.
On the other hand, comparing these passing rates with the obtained in the early work (Wilches-Visbal & Da Costa, 2019b), these results are better than those, especially for the higher energy beams. For instance, in this work, the gamma passing rate with 1%/1 mm was 99% while it was 96% in Wilches-Visbal and Da Costa (2019b) for the beam of 15 MeV. Previous papers have reported that discrepancies in the build-up region are due to the angular corrections that have been ignored (Chvetsov & Sandison, 2003; Faddegon & Blevis, 2000).
Nonetheless, it is possible to suppose other reasons such as an improper capture of the low energy components on the algorithm; a choice of low values for the regularization parameters or a poor modelling of the radiation source (point source).
Since the differences in the build-up region found in the early article (Wilches-Visbal & Da Costa, 2019b) are greater than those of the present, it is possible to think that such differences are due to an improper mathematical modelling of the problem. That is, as regularization parameters and could be the actual reason of the better coincidence in the build-up region as seen in Fig. 4.
In Fig. 5 the dose profiles for all energy beams are depicted.

Figure 5 Comparison of simulated (plus sign line) and the experimental (dotted line) lateral dose profiles at the reference depth for (a) 6 MeV, (b) 9 MeV, (c) 12 MeV and (d) 15 MeV of nominal energy. Field size 10x10 cm2 at SSD of 100 cm.
Dose profiles in Fig. 5 were measured at reference depths of 1.35 cm for 6 MeV, 2.05 cm for 9 MeV, 2.9 cm for 12 MeV and 3.7 cm for 15 MeV electron beam. Furthermore, every dose profile is normalized to the value of dose at the central axis.
Results of the dose profiles gamma passing rate are shown in Table 2.
Table 2 Comparison of the simulated dose profiles and experimental dose profiles by means the gamma passing rate criterion at reference depth. For a gamma passing greater than 95% the simulated profiles are considered approved.
| Nominal Energy (MeV) | Passing Rate (%) | |
| 4%/4mm | 2%/2mm | |
| 6 | 100 | 80 |
| 9 | 100 | 98 |
| 12 | 100 | 100 |
| 15 | 100 | 100 |
In Table 2, it is observed that the computed gamma passing rate is greater than the preestablished threshold except for the 6 MeV energy beam such as in Wilches-Visbal and Da Costa (2019b). For a less stringent gamma passing rate (95% with 4%/4 mm) all dose profiles meet the acceptance threshold.
Such as in Wilches-Visbal and Da Costa (2019b), as the nominal energy decreases the worse is the match of the experimental and simulated dose profiles. This worsening can obey the angular spread increases as the nominal energy of the beam decreases. So, it seems that angular corrections are mandatory for lower energy spectra. Beyond this, it is remarkable that the reconstructed central-axis energy spectra can reproduce reasonably well the off-axis dose data for the electron beam of higher nominal energy.
The calculation time for reconstruction the energy spectra and bremsstrahlung dose were 30 s, 60 s, 73 s and 85 s for the 6, 9, 12 and 15 MeV electron beams, respectively. For algorithms and calculations, MATLAB®2015a, v.8.5 (Microsoft Windows 7 Ultimate SP1, CPU: 2.30 GHz, RAM: 4Gb) was utilized.
4. Conclusions
A novel methodology for the determination of the electron spectrum and bremsstrahlung dose of clinical linear accelerators have been developed. This methodology consisted of finding the energy spectrum and bremsstrahlung dose at the same optimization process.
Results showed a good agreement between the experimental and simulated depth-dose curves according to > 95% within 1%/1 mm gamma passing rate for all electron beams studied. An acceptable concordance was also observed between the experimental and simulated dose profiles according to > 95% within 1%/1 mm gamma passing rate except to the lowest energy beam.
It was demonstrated that this reconstruction methodology improved the previously published ones in terms of accuracy given that the gamma passing rate scores were closer to 100%. Besides, an appreciable improvement in terms of calculation speed was also observed.
Despite being a reconstructed central-axis electron energy spectra, a reasonable reproduction of off-axis dose data in dose profiles was obtained except for the lowest nominal energy beam. Considering angular corrections for lower energy beams could improve the results in dose profiles.
To determine if the reconstructed spectra are similar to the real ones, it would be necessary to compare them to those obtained by Monte Carlo simulation or experimental measurements (electron spectrometer) or with those supplied by the manufacturer.
Conflict of interest
There is no conflict of interest to declare.

