


 nueva página del texto (beta)
 Inglés (pdf)
 Artículo en XML
 Referencias del artículo
 Enviar artículo por email
 Citado por SciELO
  Similares en
SciELO
Similares en
SciELO 
 Permalink
1. Introduction
A metallic foam is a porous medium consisting of a solid metallic matrix with fluid-filled or un-filled pores, distributed throughout its structure. These can be open- or closed-cell according to the physical pore-pore interconnection (Gibson & Ashby, 1997; Liu & Chen, 2014). Depending on the desired structural characteristics and mechanical properties for a specific application, there exist different methods for metallic foams fabrication, some of them are the powder metallurgy, metal deposition and the liquid-state processes. The powder metallurgy process consists of heating and pressing metallic particles until these are compacted into one piece (Banhart, 2000; García-Moreno, 2016). This process allows to control porosity and particle size, but the resulting material exhibits poor mechanical properties, e.g., strength and plastic collapse stress, in comparison with other methods. Metal deposition consists of depositing metallic particles in a polymeric foam, then the polymeric structure is removed, and the remaining metallic particles are sintered (Liu & Chen, 2014). Samples produced by this technique exhibit high sample reproducibility in terms of physical and mechanical properties. Liquid-state processes include, mainly, the replication technique and blowing foaming agent methods. The former is widely used to produce open-cell foams, whilst the latter allows producing closed-cell foams. Samples obtained by both processes have shown excellent mechanical properties (Despois et al., 2007; Luna et al., 2014; Osorio-Hernández et al., 2014; Shi et al., 2017; Trinidad et al., 2014; Velasco-Castro et al., 2018).
Recently, it has been studied and proposed an unconventional technique to produce metallic foams, with no need of foaming agents or space holders. This method consists of the formation of an icosahedral-quasicrystalline phase as an out of equilibrium condition in the Al-Fe-Cu system, subjecting the material to heat treatments. This was called the “In-Situ” foaming method, which allows controlling porosity and pore size by means of adjusting the heat treatment parameters, i.e., temperature and time. This process could be cataloged as an unconventional technique, since at the beginning, the porosity was considered as an unwanted defect (Dubois, 2012; Suarez et al., 2014; Besser & Eisenhammer, 1997).
Nowadays, open-cell aluminum (Al) foams are the most common produced and commercialized kind of metallic foams. Due to the properties of Al as base metal, in addition to the porous interconnected structure, open-cell Al foams can be used in sandwich panels for energy absorption and sound dissipation, in construction as lightweight structures, in chemistry as carriers for catalyst and in hydraulic applications for gases or liquids conduction, heat transfer and filtering (Banhart, 2001; Lefebvre et al., 2008; San Marchi & Mortensen, 2002). The potential uses of open-cell Al foams in hydraulic applications have earned relevance, since this material offers the chance of transport a fluid while this is cooled or heated in its way. A precise description of fluid flow behavior in porous Al is essential to the successful design and operation of projects focused on fluids conduction. Thus, the permeability behavior of open-cell Al foams has been thoroughly explored and well-described within a limited range of flow conditions.
Permeability can be defined as the ability of a material to conduct fluids through
its interconnected pores (Tiab & Donaldson,
2012). Its magnitude depends on the physical and structural properties of
the medium, such as effective porosity and shape, size, distribution, and pores
physical interconnection. There exist different models to study permeability,
supported by diverse conditions of porous medium, flow and interaction between the
sample surface and the fluid flowing. The most extensively employed model is the
Darcy's law (Otaru, 2020; Pal et al., 2006;
Tiab & Donaldson, 2012), which
idealizes the fluid as incompressible (for liquids) and considers that this does not
react with the porous surface, that the porous medium is homogeneous and continuous
and that the flow is linear and isothermal. According to Darcy’s law, written in Eq.
1, the pressure gradient (
Darcy's law describes the phenomenon of fluid flow in porous media, assuming that the
inertial forces and the friction between the surface and the fluid are negligible.
As the pressure gradient refers to the drop of pressure (
Eq. 2 is well-known as the reduced Darcy's law (RDL) and is valid within a limited range of low flow velocities (Zeng & Crigg, 2006). If the fluid flows at high velocity, the flow in porous media migrates from the Darcy regime to the Forchheimer (non-Darcy) regime, where form drag and inertial forces start to be important and the energy dissipation becomes the sum of viscous and form drag (Dukhan & Ali, 2012). As the fluid velocity increases, RDL fails to describe accurately the permeability coefficient, owing that the linear correlation between the pressure gradient and the fluid velocity disappears. The Forchheimer equation considers the microscopic inertial effect and captures the impact of the force exerted by any solid surface on the flowing fluid and its resultant effect on the drop of pressure as a second order term (Otaru et al., 2018), modifying Eq. 1 as follows:
where
The exact beginning of the Forchheimer regime is controversial and has been broadly
discussed. Zeng and Crigg (2006) detailed the
employed criteria to discern between Darcy and non-Darcy flow. An adjusted Reynolds
number (Re) using the mean pore diameter instead of the conduit diameter (
According to Chilton and Colburn (1931), the
non-Darcy flow starts at a
Research concerning the drop of pressure measurements of open-cell Al foams have been
previously reported. Boomsma and Poulikakos
(2002), Despois and Mortensen
(2005), Dukhan (2012), Dukhan et al. (2014), Fernández-Morales et al.
(2017) and Otaru et al. (2018) measured the
drop of pressure resulting from the injection of diverse fluids through Al foams,
aiming to study their permeability and flow behavior. The consensus among all these
investigations is the inverse correlation between the value of κ and the drop of
pressure,
This paper proposes a new experimental design to analyze DPB when one single phase fluid is injected into open-cell Al foams at increasing pressure intervals, reaching pressure values up to 172.37 MPa (25,000 psi). The investigated foams were manufactured by the replication technique (Luna et al., 2014; Osorio-Hernández et al., 2014; Trinidad et al., 2014) in three different pore sizes. Flow tests were conducted at room temperature and 200 °C, in order to observe the effect of temperature on DPB. The correlation with PPI, pore size, porosity and pore-pore interconnections were also assessed as well as the structural integrity of the Al foams after high pressure flow test (HPFT). The relevance of this investigation is that Al foams performance at these extremely high flow conditions has never been reported before, thus, the results presented in this work could be of interest, for instance, for the energy industry in oil/gas extraction and transportation.
2. Materials and methods
2.1. Fabrication of Al foams
The foams were produced by the infiltration of molten Al with a sodium chloride (NaCl) preform, under an inert argon (Ar) controlled atmosphere. The preform was obtained by sieving NaCl irregular particles in three different size intervals, in order to produce pores of: (A) 0.71 to 1.00 mm, (B) 2.00 to 2.38 mm and (C) 3.35 to 4.75 mm (Fig. 1).
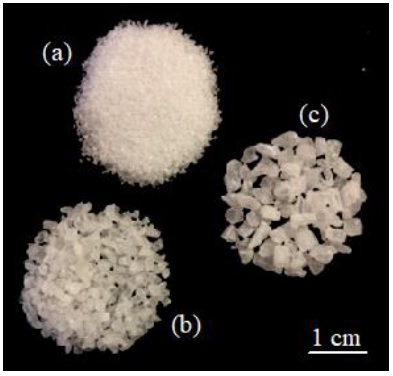
Figure 1 Employed NaCl beads for preform (a) 0.71 to 1.00 mm, (b) 2.00 to 2.38 mm and (c) 3.35 to 4.75 mm.
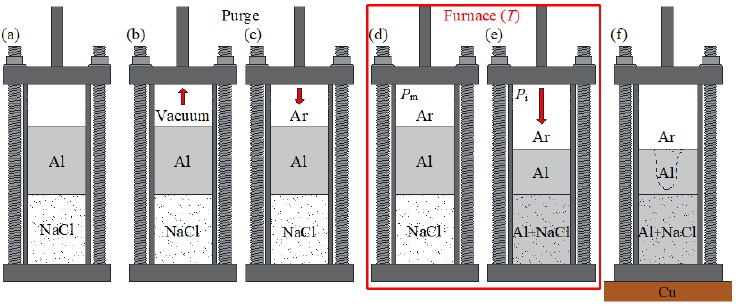
The experimental setup, for manufacturing Al foams, consisted of a resistance furnace, a cylindrical steel crucible and a valves system with a pressure regulator connected to a mechanical vacuum pump and an Ar tank. The steps of the process are shown in Fig. 2. It can be observed that an Al cylindrical ingot, of commercial purity, was placed on top of the NaCl perform into the crucible (Fig. 2a). Then, the crucible was sealed using graphite O-rings on top and bottom. The system was purged three times, suctioning the air with the mechanical pump to produce a vacuum of 10-3 Torr (Fig. 2b). After that, argon (Ar) was introduced to start the melting process (Fig. 2c). The crucible was placed into the furnace at a working temperature of 770-780 °C, which is above the Al melting point (~660 °C) and below the one of NaCl (~800 °C). At this temperature, the metal load was melted under an Ar atmosphere at a controlled pressure of 0.5 kg cm-2 (P m ) for 60-70 minutes (Fig. 2d). Afterward, the solid NaCl was infiltrated with the molten Al by increasing the Ar pressure (P i ) for 20-30 minutes (Fig. 2e) at pressures of 2, 1.65 and 1.25 kg cm-2 for pores A, B and C, respectively. Finally, the crucible was extracted from the furnace and placed over a copper (Cu) block to control the metal solidification from bottom to top, thereby inducing the formation of the shrinkage outside the foam volume (Fig. 2f). The composite material (Al-NaCl) was retired from the crucible and machined into cylinders of 5 cm in length and 3.81 cm in diameter, according to testing cell dimensions. The NaCl perform was leached in distilled water by means of an ultrasonic shower, remaining only the porous Al.
2.2. Structural characterization
All produced samples were physically and geometrically characterized. PPI was
determined as the number of pores in one linear inch. The pore wall thickness
(t
wall
) refers to the average of several aleatory measurements on each tested
foam of the distance between two pores. The density (
where VS is the volume of the sample (57 cm3) and
VAl is the volume occupied by the Al (solid volume). Based on the
Al density (
2.3. Fluid injection tests
The HPFT was conducted at room temperature and 200 °C, using the pore-permeameter shown in Fig. 4 and gasoline additive as testing fluid. The pore-permeameter consists of a fluid storage tank (Fig. 4a), a mechanical pump (Fig. 4b), a hydraulic press (Fig. 4c), a testing cell (Fig. 4d) inside which the testing section is (Fig. 4e) and an exhaust tank (Fig. 4f). The beforementioned components are coupled with a set of pipelines and valves to transport fluid and control its entrance to each section. The internal pipeline diameter is 0.45 cm, whereas the diameter of the testing section is 3.81 cm. Moreover, the entire experimental setup was computer-controlled.
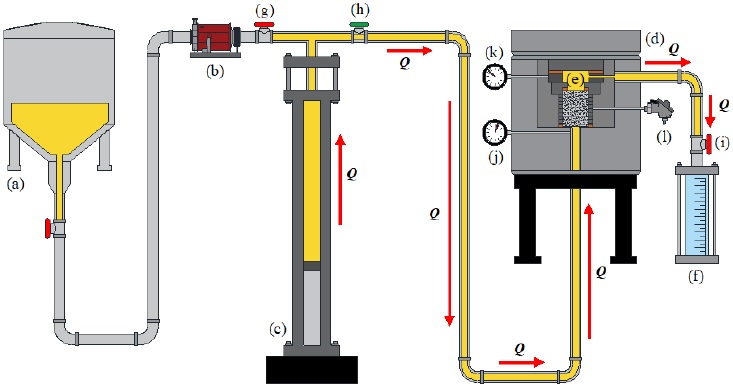
Figure 4 Diagram of the pore-permeameter: (a) testing fluid storage tank, (b) mechanical pump, (c) hydraulic press, (d) testing cell, (e) testing section, (f) exhaust tank, (g, h, i) valves, (j, k) pressure gauges and (l) resistance temperature detector.
Firstly, the Al foam sample is mounted into the testing section, using two Teflon/copper gaskets on the bottom and top to properly seal the cell and guarantee the sample confinement. The test starts with the mechanical pump moving the testing fluid from the storage tank to the hydraulic press. Once the latter is full, its valve is closed (Fig. 4g). Then, whilst the testing cell valve is open (Fig. 4h) and the exhaust tank valve is closed (Fig. 4i), the hydraulic press injects the gasoline additive toward the testing cell at preset increasing pressure intervals, ranging from 1.38 to 172.37 MPa (200 to 25,000 psi) with increments of 6.89 MPa (1,000 psi) in each test, i.e., 1.38-6.89, 1.38-13.78, etc., this in order to find out the critical hydrodynamic pressure that can be supported by the Al foams without severe physical damage. The pressure at the inlet and outlet of the sample was measured with two pressure gauges connected to the entrance (Fig. 4j) and exit (Fig. 4k) of the testing section, capturing one value per second. Once the highest value of the preset pressure interval is reached, the exhaust tank valve is opened, and the fluid is expelled from the system.
The fluid injection was upward with regards to the testing section, at a preset flowrate (Q) of 7 cm3 s-1. The cell temperature was measured with a resistance temperature detector (Fig. 4l). It is worth highlight that the analysis temperature acts into the testing section, therefore, the gasoline additive will not necessarily attain this temperature, as each test lasts between 10-20 s.
The structural integrity of open-cell Al foams after HPFT was assessed by generating the stress-strain curves of tested samples by means of compression tests, using a universal mechanical testing machine Instron 1125-5500R, at a crosshead speed of 0.5 mm min-1 and a maximum load of 9,980 kgf (97.870 kN).
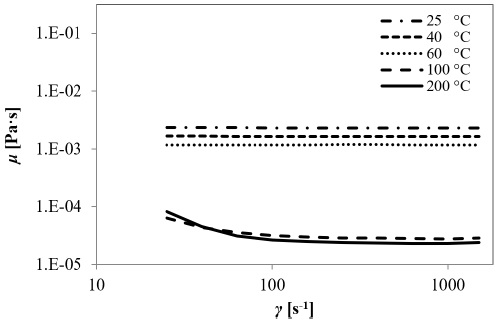
The dynamic viscosity, μ, of the gasoline additive was measured using a parallel plate rheometer, at shear rates (γ) ranging from 10 to 1,500 s-1. The rheology tests were conducted at room temperature and 200 °C.
3. Results and discussion
3.1. Production of Al foams and physical characterization
Fig. 5 shows the foams produced for HPFT. It can be appreciated the absence of defects, such as lack of infiltration or NaCl particles embedded, forming a composite material. The resulting size difference among pores A (Fig. 5a), B (Fig. 5b) and C (Fig. 5c) is reasonably significant, as expected. In the top view of the samples, shown in Fig. 5d, it is observed that the pores geometry is highly irregular, which is a consequence of the used NaCl particles. Nevertheless, the pores distribution observed over the sample flat surface is rather homogeneous, despite its stochastic nature.
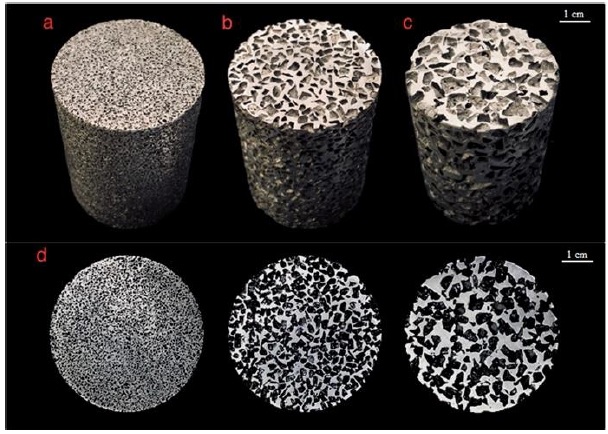
Figure 5 Al foams produced with pore sizes of: (a) (A) 0.71 to 1.00 mm, (b) (B) 2.00 to 2.38 mm, (c) (C) 3.35 to 4.75 mm and (d) Al foams observed from the top view.
Table 1 presents the physical and
structural properties of Al foams. The measured weight, m, and solid volume,
VAl, were rather similar for all the investigated samples, with a
data dispersion within ±1%. Therefore, the relative density,
Table 1 Experimentally determined structural and physical properties of the produced Al foams.
| Pore size |
m [g] |
VAl [cm3] | PPI |
twall [mm] |
ρ [g cm-3] |
ρ* | Φ [%] | ||
| Estimated | Measured | Estimated | Measured | ||||||
| (A) 0.71 - 1.00 mm | 59.10 | 21.81 | 21.76 | 29 | 0.55 | 1.04 | 0.38 | 62 | 62 |
| (B) 2.00 - 2.38 mm | 58.40 | 21.55 | 21.44 | 12 | 1.19 | 1.02 | 0.38 | 62 | 62 |
| (C) 3.35 - 4.75 mm | 58.50 | 21.59 | 21.52 | 7 | 1.88 | 1.03 | 0.38 | 62 | 62 |
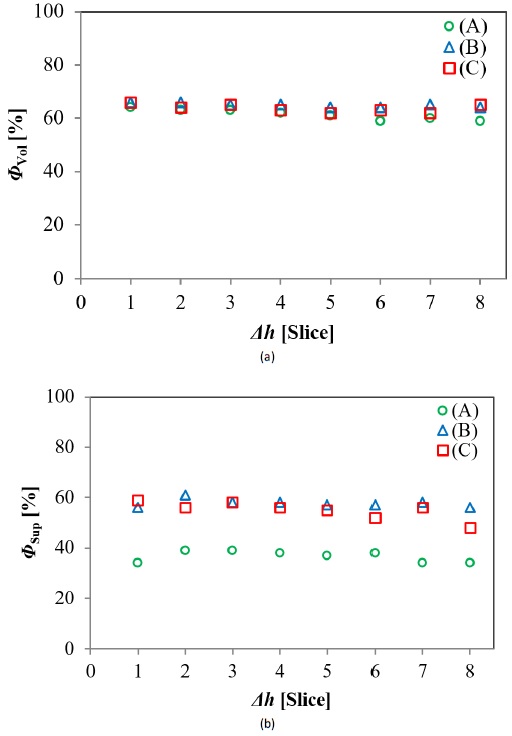
Fig. 6 shows the volumetric and superficial porosities, ΦVol and ΦSup, as a function of the sample height, Δh. Porosity values corresponding to the slices from the same foam described almost horizontal lines in these plots, suggesting the uniformity of the pore’s distribution along the axial axis (vertical direction) of samples, and demonstrating the non-existence of a porosity gradient. The volumetric porosity (Fig. 6a) remained at 62% ±2% for all analyzed slices, whereas superficial porosity (Fig. 6b) for pore A tended to be significantly lower (34% ±4%) when compared to that for pores B and C (55% ±5%). The beforementioned allows theorizing the absence of a direct correlation between both porosities. It is worth noting that this porous homogeneity does not necessarily mean an isotropic behavior of the flow through Al foams.
3.2. Drop of pressure and flow analysis
The fluid velocity, v, was calculated according to the methodology described by
Despois and Mortensen (2005), assuming
spherical pores and using data from Table
1 with a flowrate of 7 cm3 s-1. The modified
Table 2 Fluid velocity and modified Re for all flow conditions.
| Pore size | Dp [mm] |
ʋ [cm s-1] |
Re | Flow regime |
| (A) | 0.71 | 1644.27 | 3921.61 | Forchheimer |
| 1.00 | 828.88 | 2784.34 | Forchheimer | |
| (B) | 2.00 | 207.22 | 1392.17 | Forchheimer |
| 2.38 | 146.33 | 1169.89 | Forchheimer | |
| (C) | 3.35 | 73.86 | 831.15 | Forchheimer |
| 4.75 | 36.74 | 586.18 | Forchheimer | |
| Pipeline | 4.50 | 44.30 | 669.58 | Laminar |
The lower obtained
Fig. 7 shows the drop of pressure as a function of the pressure at the outlet of the sample when HPFT were conducted at room temperature (Fig. 7a) and 200 °C (Fig. 7b). The flow rate started to drop when the hydrodynamic pressure exerted by the fluid approached the upper value defined for the pressure interval, i.e., 137.90 for 1.38 to 137.90 MPa, 172.37 for 1.38 to 172.37 MPa, as a relaxation response due to the proximity, observing this flow behavior in all tested samples. For analysis purposes, only drop of pressure values corresponding to a steady flow of 7 ± 0.2 cm3 s-1 were taken. Thus, the maximum pressure attained with the aforementioned flow is closely 103.42 MPa (15,000 psi). Nonetheless, the fluid pressure of 172.37 MPa (25,000 psi) was reached at flow rates between 0 to 1 cm3 s-1. Pressure losses associated with the confining wall effect were ignored, as all HPFT tested samples had the same dimensions (Dukhan & Ali, 2012).
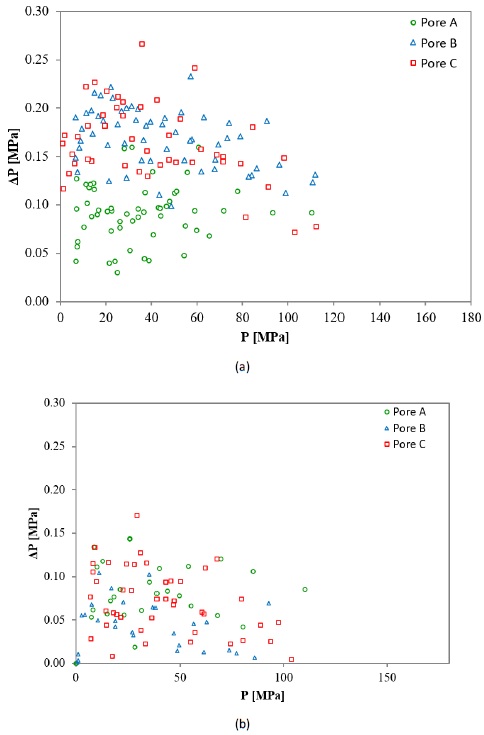
Figure 7 Drop of pressure as a function of the pressure at the outlet of the sample at (a) room temperature and (b) 200 °C.
At room temperature is noticeable a tendency to present lower pressure losses for pore A regard to pores B and C, contrary to the expected. Otaru et al. (2018) demonstrated the key role within the Forchheimer regime of the windows that interconnect the pores, based on their size and alignment, finding that lower pressure differences are associated with larger windows. Fig. 8 shows some scanning electronic microscopy (SEM) images for the HPFT tested samples, where the windows (bottlenecks) can be appreciated, being marked with red arrows. An amount of 13, 6 and 3 windows were counted for pores A, B and C, respectively, within a 10.8 mm2 area. The windows density is noteworthy higher as the pore size decreases, although larger pores compensate this with larger windows. Due to the pore shape irregularity, the mean diameter and window connectivity area are difficult to determine and would not be representative values; therefore, this investigation avoids their calculation. It is worth mentioning that the windows density is directly linked to the pore’s density (PPI in Table 1), prevailing a similar amount ratio among the investigated pores. As the porosity for all investigated foams was 62% ±2% regardless of pore size, these unexpected outcomes are attributed to windows density, being apparently more decisive the amount of these structures than their sizes.
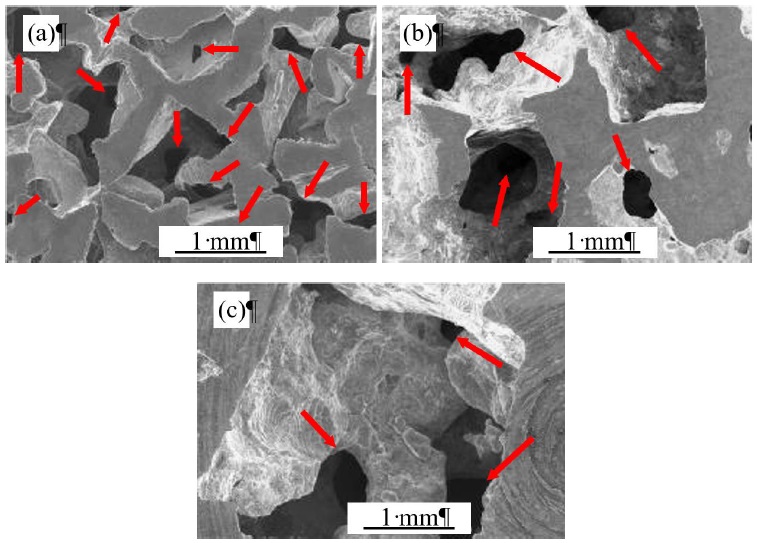
Figure 8 SEM images of the windows resulting from the pore-pore interconnections of the produced Al foams (a) (A) 0.71 to 1.00 mm, (b) (B) 2.00 to 2.38 mm and (c) (C) 3.35 to 4.75 mm.
At 200 °C, it is not observed a clear trend associated with the pore size,
relating this performance to the temperature effect. However, either at room
temperature or 200 °C, a slight tendency of
Fig. 9 shows the flowrate (Q = 7 ± 0.2 cm3 s-1) as a function of the drop of pressure, at room temperature (Fig. 9a) and 200 °C (Fig. 9b). The drop of pressure outcomes surprisingly fell into a range of values and not into a single value. In the same way that in the drop of pressure vs. pressure plots (Fig. 7), this behavior might be attributed to the drag variations linked to the achieved fluid velocity. At room temperature, the range of pressure losses has lower values for the smallest pore, A, when compared to the larger ones, B and C, with the data dispersion being rather similar for A and B. The inverse correlation between the fluid velocity and flow pressure is well-known, i.e., as the fluid velocity increases, the pressure exerted by the fluid decreases. Thus, according to data from Table 2, pore A foams would have lower flow resistance than that for pores B and C. On the other hand, at 200 °C, the pressure losses are practically within the same range of values regardless of the pore size, which leads to suggest that, at higher temperatures, the influence of dimensional parameters becomes negligible, at least for open-cell Al foams (presumably).
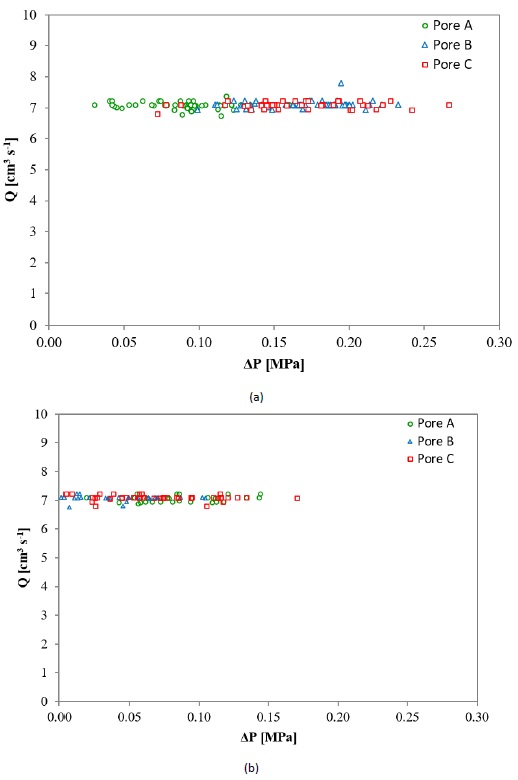
Fig. 10 shows the flowrate as a function of the drop of pressure plots at both temperature conditions for pores A (Fig. 10a), B (Fig. 10b) and C (Fig. 10c). For the medium and largest pores (B and C, respectively) the pressure losses clearly display an inverse correlation with temperature, i.e., as the temperature increases, the drop of pressure decreases. Considering that the flow behavior through porous media does not depend exclusively on the conduction channels geometry but also on the properties of testing fluid flowing, the performance of the latter should also be evaluated. Fig. 11 shows the dynamic viscosity, μ, as a function of the shear rate, γ, at 25 (room temperature), 40, 60, 100 and 200 °C. From the rheology analysis is observed that the magnitude of the dynamic viscosity is directly affected by temperature, because of the weakening of friction among the microlayers of the fluid. Thus, it is possible to deduce that when HPFT are conducted at a temperature higher than 25 ºC, the DPB will be different from that expected at room temperature for the same foam.
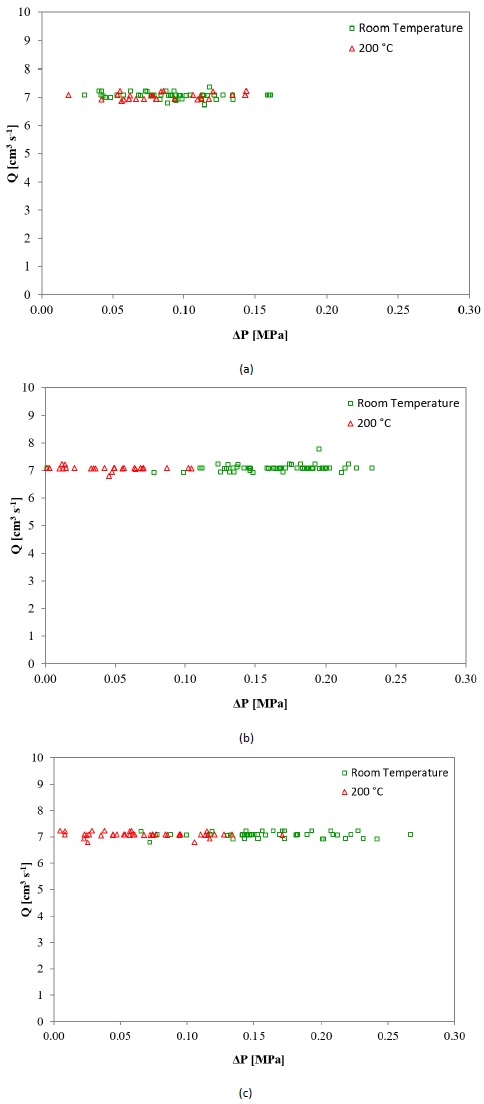
Figure 10 Flowrate as a function of the drop of pressure at room temperature and 200 °C for pore (a) (A) 0.71 to 1.00 mm, (b) (B) 2.00 to 2.38 mm and (c) (C) 3.35 to 4.75 mm.
The first term at the right in Eqs. 1 and 3 refers to the pressure gradient (drop of pressure per unit length) required to overcome the viscous resistance (Zeng & Crigg, 2006). Therefore, a reduction of the viscous forces (µ) means a reduction of the resistance to flow, resulting in a lower drop of pressure values. The outcomes shown in Fig. 10b and Fig. 10c could also be attributed to the decrease of the gasoline additive density. As the flow is within Forchheimer regime, a lower density will have repercussions on inertial forces, represented by ρ in the second term at the right in Eq. 3, thereby having repercussions on the pressure gradient.
The relationship between the drop of pressure and temperature for pore A is not as clear as for pores B and C. The smallest value of ∆P in Fig. 10a corresponds to HPFT at 200 °C, whilst the largest ∆P value corresponds to HPFT at room temperature. Thus, the influence of temperature on DPB for pore C is subtle but exists.
3.3. Structural integrity assessment
Starting from the fact that Al has high strength and toughness, in addition to its ductile mechanical behavior, it could be assumed that an Al based porous structure has the capacity to conduct highly pressurized flow without important physical damage, at least at room temperature. Nevertheless, an increase of the testing temperature might have repercussions on the foam’s metallic matrix, e.g., microstructurally changes associated to diffusion effects, in detriment of the material performance. Fig. 12 shows a foam with pore C (Fig. 12a) before and after (Fig. 12b) HPFT at 200 °C. It can be externally appreciated that the foam structure did not collapse as a consequence of the critical testing conditions. The stains along the length of the sample are the only visual difference in the aspect of the foam before and after the HPFT. These stains are the result of the contact between the sample external hot surface and the burned gasoline additive. Fig. 13 shows the stress-strain diagram generated from the sample shown in Fig. 12.
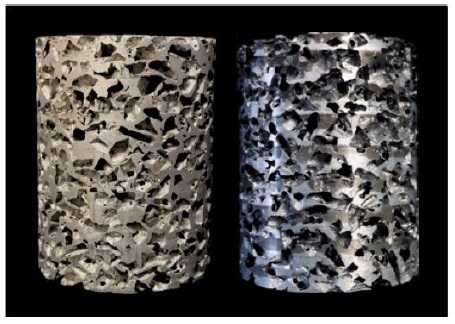
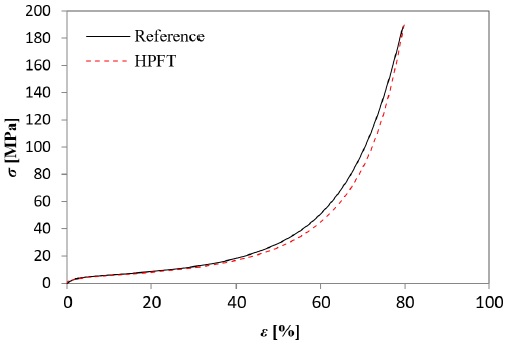
and its respective non-HPFT tested reference. The HPFT curve showed the expected compressive behavior for open-cell Al foams, without observing an early structural collapse. The energy absorption capacity, defined as the area under the stress-strain curve, was calculated for the HPFT sample and its reference, finding that both samples absorbed 3.41 MJ m-3for 38% strain. Thus, it is assumed that the analyzed samples were not structurally damaged because of the extremely high hydrodynamic pressure at 200 °C.
The fact that open-cell Al foams present a rigid structure and are capable of supporting high pressure flow without deformation or significant physical alterations allows to reject any possible experimental errors, thereby reducing uncertainty. Grossmann et al. (2018) studied the water permeability of fibrous membranes for biomedical applications, suggesting that a nonlinear behavior of the permeability with increasing pressure might be caused by the deformation of the nonwovens like a compression of the membrane or at least a rearrangement of the nanofibers, because of the 120 mmHg (0.016 MPa or 2.3 psi) hydraulic pressure.
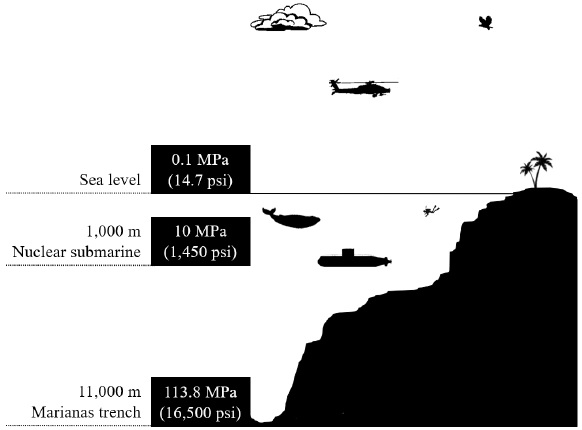
In order to contextualize the physical dimensions or technological implications of using 172.37 MPa, this pressure is equal to 1,700 times the atmospheric pressure at the sea level, 17.5 times the hydrostatic pressure exerted by the water column over the shell of a nuclear submarine at 1,000 m deep and 1.5 times the water column at the Mariana trench, the deepest known point on earth (Fig. 14). From this figure, it can be observed that pressure of 172.37 MPa is exceptionally high. Therefore, the results of this research are important since metallic foams have never been investigated nor proposed for industries that may need to conduct fluids at high pressure, such as energy industries. Thus, the results presented in this research give way to a new engineering application of these materials.
4. Conclusions
The drop of pressure behavior of open-cell Al foams, produced by the replication technique in three different pore sizes, was studied by means of the injection of highly pressurized gasoline additive at pressures up to 172.37 MPa (25,000 psi), at room temperature and 200 °C. According to the physical and geometrical properties of the investigated samples, it was found that a flow rate of 7 ± 0.2 cm3 s-1 of gasoline additive, the investigated Al foams behaved within the Forchheimer regime. From the high-pressure flow tests at room temperature, it was found that the drop of pressure values tended to be lower as the pore size decreases, contrary to the expected, based on prior research made by other authors. These unexpected outcomes are attributed to the existent inverse correlation between the fluid velocity and the pressure exerted by the fluid. As the highest estimated fluid velocity was reached for the smallest pore (A) it is assumed that the pressure exerted by the fluid toward the foam surface was lower when compared to that for the larger pores (B and C). Thereby, it is thought that the friction between the fluid and the foam surface is lower, as well as the flow resistance. From the high-pressure flow tests (200 °C) it was found that the drop of pressure is more related to the testing temperature than the foam physical and geometrical properties. Thus, it is speculated that the pore size (and therefore, pore-pore interconnections area) influence becomes negligible when the working temperature is high enough (( 200 ºC). From visual examination and compression tests, it was determined that open-cell Al foams have the structural capacity to conduct fluids at pressures up to 172.37 MPa and 200 °C, as the studied samples did not exhibit any apparent physical damage or structural collapse. Thus, the functional applicability of this material is expanded to more industries, such as the energy industry.

