nueva página del texto (beta)
 Inglés (pdf)
 Artículo en XML
 Referencias del artículo
 Enviar artículo por email
 Citado por SciELO
  Similares en
SciELO
Similares en
SciELO 
 Permalink
1. Introduction
The adoption of EEG signals has been relevant to analyze aspects of human factors in software engineering (Crk & Kluthe, 2016; Fucci et al., 2019; Lee et al., 2018). The electroencephalogram (EEG) is responsible for capturing the electrical signals generated through the interaction of neurons (Cohen, 2017). Software engineering researchers have been using this indicator along with machine learning techniques to classify task difficulty (Lee et al., 2018), level of experience (Crk & Kluthe, 2016), and categories of programming tasks artifacts (Fucci et al., 2019), i.e., between textual prose and programming language. The EEG signals contain noises such as abnormal readings, electrical interference, and eye movements, which are not of interest to the analysis and therefore contribute to the classifiers' lack of precision as they are not related to a specific cognitive process required in such experiments. For this, these noises must be removed and treated before being analyzed. The EEG filtering process is usually the removal of abnormal readings. The literature usually attenuated low and high cutoff frequencies by using low and high pass filters. They also removed movement components, such as eye movement, with an ICA algorithm.
However, despite the evident benefit of filtering EEG signals in studies focused on research areas such as signal processing and clinical image, it remains unknown if filtering an EEG signal can affect the applications focused on software engineering (Crk & Kluthe, 2016; Fucci et al., 2019; Lee et al., 2016; Lee et al., 2018; Radevski et al., 2015). Such research generally claims that filters in EEG signals improve the analysis and helps to obtain more effective results. Software engineering literature did not produce empirical evidence about these statements (Crk & Kluthe, 2016; Fucci et al., 2019; Lee et al., 2018). Therefore, there is a lack of a specific analysis of the effectiveness of filtered EEG signals in software engineering. Moreover, while the extent of the filter application in software engineering is unknown, there is a lack of an approach in the literature to classify developers’ code comprehension based on EEG data. Code comprehension consists of a task in which developers must interpret a piece of code and deduce the result and purpose of a source code snippet. This classifier would be a basis for recommendation systems, for example, to recommend tasks to the developer based on their EEG activity.
Therefore, this work seeks to analyze the effectiveness of filters on EEG signals for classifying developers' code comprehension. Specifically, this work analyses the effectiveness of a classifier trained with EEG data after the application of EEG filters. For this, a random forest (RF) technique was both trained with filtered EEG data (EEGf) and with the unfiltered EEG signals (EEGu). We measured the classifier's effectiveness by the f-measure, i.e., the harmonic mean between recall and the classifier's precision. This work used a paired t-test, a Wilcoxon, and a Mann Whitney U test for analyzing the effectiveness (f-measure) of EEG filters in the classification of developers' code comprehension.
This work describes this research into seven sections: Section 2 presents the basics concepts of this work; Section 3 describes the related works; Section 4 describes the methodology of this work; Section 5 presents the study results; Section 6 discusses the results; Section 7 highlights the final remarks and future work.
2. Background
This section presents the basic concepts behind this work. Section 2.1 describes the theory related to EEG signals. Section 2.2 introduces the concept of EEG filters used in this work. Section 2.3 describes the metrics used to measure the effectiveness of the classifier.
2.1. EEG
The electroencephalogram (EEG) is responsible for measuring the variation in tensions from brain activity (Cohen, 2017). These electrical fluctuations are a natural consequence of the dynamics between neural populations. To capture these activities, the EEG has sensors that are also well-known as electrodes. The electrodes capture EEG signals in specific regions of the users' scalp. Each electrode corresponds to an EEG channel. In this work, we adopted the Emotiv Epoc+ (Emotiv, 2020) that contains 14 channels. Figure 1 shows the Emotiv Epoc+ channels locations. In addition, the EEG signal consists of five frequency bands: Alpha [8-13Hz], Beta [13-30Hz], Theta [4-8Hz], Delta [1-4Hz], and Gamma [30-70Hz].

The electrodes of Emotiv Epoc+ consist of a sponge containing a sponge that has direct contact with the scalp. Behind the sponges, there is contact with golden plates connected to the device's transmitter.
2.2. EEG filters
The device captures raw EEG signals (Emotiv, 2020). The EEG signals contain several noises, i.e., artifacts that are not of interest to the analysis, such as involuntary eye movements (Cohen, 2017). For researchers, it is relevant to filter EEG data, highlighting and attenuating frequencies of interest (through filters), respectively, and removing artifacts that are not of interest to the analysis, e.g., removing EEG signals that reflect eye movement.
Software engineering literature has adopted high and low pass filtering (also known as bandpass filtering) to attenuate band frequencies that are not of interest to the analysis. The high-low pass, as the name implies, maintains frequency waves between the low and high range. However, this filter attenuates the frequency signals below and higher than a respective cutoff frequency. Studies generally use a bandpass filter from 1Hz to 40Hz on EEG signals because the literature does not report interest in data below 1Hz, and above 40Hz. Above the frequency of 40Hz, interferences of lamps and devices on EEG signals that operate at an approximate frequency can occur. Other studies have also opted to clean up EEG signals from noise, e.g., involuntary eye movements. For this, some reference channel, which is generally more likely to reflect this movement, must be defined to serve as a basis to remove these patterns from other channels.
Before filtering, we established some frequencies that are necessary to eliminate. We eliminated the signals above 40Hz to discard the AC powerline frequency. We also removed frequencies below 1Hz to remove heart signals related to pulse artifacts and low-frequency noise, such as building vibrations and nearby electromagnetic field noise (Jiang et al., 2019). Since the EEG sensors also capture electrooculogram signals (EOG) due to the volume conduction effect, and the frequencies between EEG and EOG are similar, the ICA algorithm removes EOG artifacts in the frequencies between 1Hz and 40Hz (Jiang et al., 2019). The ECG artifacts, such as the QRS, resides between 8 Hz and 50 Hz frequencies (Tereshchenko & Josephson, 2015). However, the ICA algorithm has not removed ECG artifacts because we did not find a reference channel to serve as a basis to remove these artifacts from EEG signals.
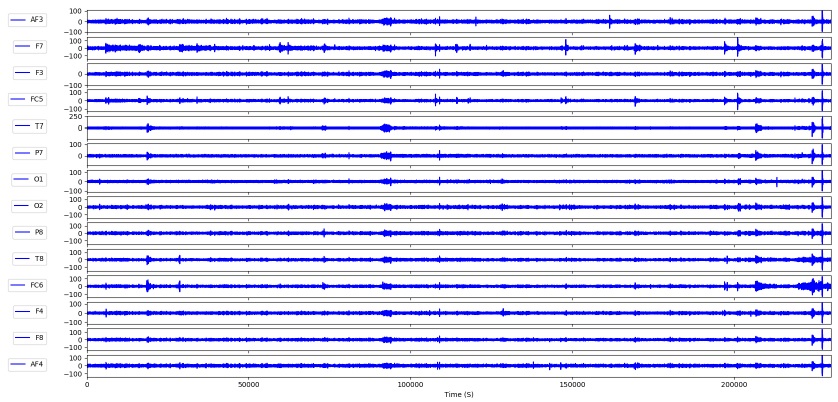
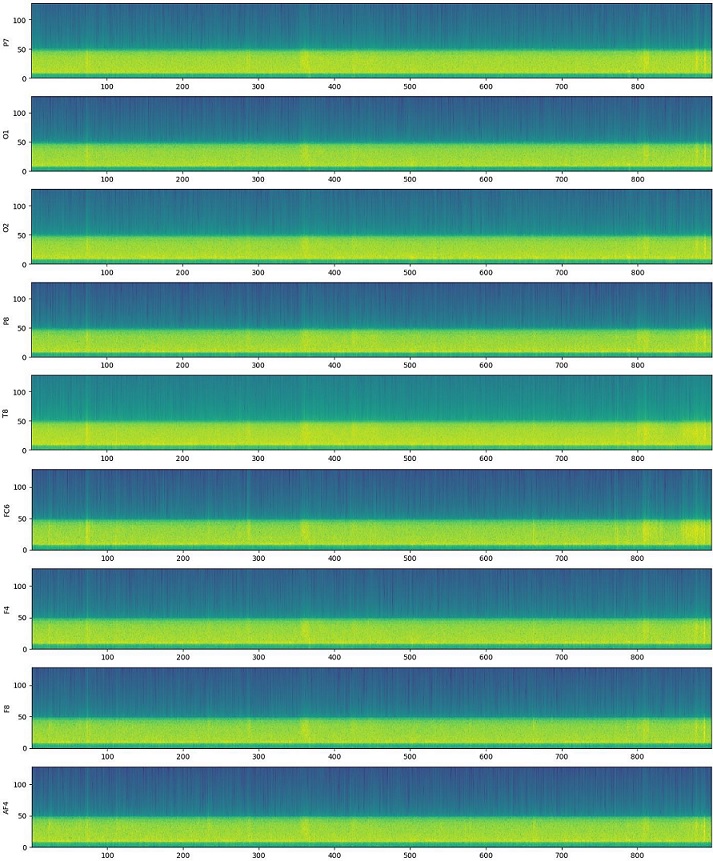
In this work, the filtered signal consists of the flow in Figure 2. (1) Remove abnormal signals: The first step is to remove abnormal EEG readings. Therefore, this work rejected signals above 8 µVolts. The value of 8uV refers to a single sample value. We choose this value because above +8uV and below -8 µVolts were involved in briefs abnormal readings caused by sensors malfunction. We discarded values between the range of +8uV and -8uV. We did not replace it with other values. (2) High- and low-pass filtering: the filter used frequencies below 1Hz and greater than 40Hz to attenuate signals. We used a high- and low-pass filter designed with a Finite Impulse Response (FIR), using a hamming window. More details about the FIR design used in this work in Section 2.4. (3) Eye artifacts removal: we run an Independent Component Analysis (ICA) to remove eye movements from EEG signals. We used a fast ICA algorithm to compute the eye components. Section 2.5 contains more details about the ICA we used in this work. We set ICA to use the readings of the F8 channel as a reference for removing the eye artifacts. There are two reasons we chose the F8 channel to remove eyeblinks: First, the absence of a dedicated channel to capture EOG artifacts. Second, we observed that the F8 channel contained the components of the eye blinking frequently. The EEG filters and ICA were performed using python's MNE library (Gramfort et al., 2013). The raw EEG signals, EEG filtered signals, and spectral analysis of the respective signals of both datasets are in Goncales et al. (2021). Appendix A contains the EEG signals and spectral analysis of one of the participants.

2.3. High and low pass filtering
This work applies a Low- and High- pass filtering in the EEG signal. Low-pass filtering consists of rejecting frequencies that are higher than a defined frequency threshold. The low-pass filter does not alter the frequencies below the cut-off limit. Frequencies above 45Hz in EEG signals generally contain irrelevant noise fluctuations. Literature indicates the low-pass filter to attenuate these signals.
The high-pass filtering consists of the opposite of low-pass filtering because it rejects frequencies below a cut-off frequency, but it does not alter the frequencies above. The literature indicates the high-pass filtering to attenuate slow frequencies containing DC components and negative deflections representing spikes of single neurons.
This work establishes specific cut-off frequencies for the low and high pass filters. However, filters can differ in design. Researchers usually design these filters through FIR and IIR methods. We introduce some basic concepts about the FIR design in the following Section.
2.4. Finite impulse response (FIR) filter design
In particular, there are two main types of filter design, the Finite Impulse Response (FIR) filter, and the Infinite Impulse Response (IIR) Filter (de Cheveigné & Nelken, 2019). The Infinite Impulse Response (IIR) filters the impulse signal indefinitely, i.e., while the signal is occurring. The calculus of an IIR filter is recursive and combines the sum of inputs with the last signals' outputs. In contrast, the Finite Impulse Response (FIR) filters in each impulse signal in a finite response. The FIR filter sums a finite range of input-weighted signals. The convolution sum bellow represents the FIR filter:
Where:
• y(n) is the output signal;
• x(m) is the input signal;
• h(n-m) is the impulse response at instant n-m.
In this work, we designed an FIR filter with a hamming window method. Equation 2 defines the hamming window we used.
The cut-off frequency (𝜔c) of the low pass filter in this work is 40Hz, and the cut-off of the high pass filter of this work is 1Hz. Given that |𝜔| is the window function in a particular range of the EEG signal, this window function is multiplied by the desired low pass filter when the condition |𝜔| ≤ 𝜔c is satisfied. The window function is multiplied by the signal when the condition 𝜔c ≤ |𝜔|.
2.5. Independent component analysis (ICA)
The Independent Component Analysis (ICA) is a technique for identifying different signals from a single source. For example, an EEG signal from a single channel can contain eye movements. The research on electrophysiology knows that eye signals have well-established patterns related to different eye movements. When these movements are not of interest to the study, it comprises a noise, and ICA can separate these signals. Therefore, in this case, the application of ICA holds because it is a source separation technique. Formally, the following generative model defines the problem of separating independent components in a signal:
Where x is a vector of dimension m, s is a vector of dimension n . The s contains the supposed signal with the mixed components, and A is the matrix with mxn dimension the model should estimate, i.e., contains the independent components. After the algorithms estimate the matrix A , the algorithm generates an inverse matrix W from A . There are several methods to compute the ICA model: First, by maximizing the non-Gaussian signals. Second, by minimizing the mutual information between independent components. Finally, ICA also can use the maximum likelihood for estimating statical models based on a set of observations to find the matrix for unmixing signals and then extract the components.
In this work, we adopted the Fast ICA algorithm (Hyvarinen,1999). This algorithm computes the minimization of
non-Gaussian. The algorithm computes this by approximating the negentropy of the
signals using a linear fixed-point approach. Equation 5 describes the final
algorithm of the Fast ICA. This equation shows a one-by-one estimation of
components. This Equation subtracts the projections of previously p vectors in
Hyvarinen (1999) provides a detailed description of this algorithm and the transformations involved in this equation. The Fast ICA (Hyvarinen, 1999) is the default algorithm of the framework MNE in Python used to compute the ICA in this work. MNE adopts the Fast ICA as the default algorithm because it is faster than the infomax and Picard algorithms most of the time. This algorithm does not require the computation of learning rates to execute.
3. Related work
Section 3.1 presents the benefits of filters used in EEG signals in medical and signal processing research. Section 3.2 presents related works in software engineering which applied a gamma of filters in EEG signals.
3.1. Related work in signal processing and medical research
Correa et al. (2007) proposed an algorithm to filter EEG signals in a cascade for attenuating line interference, eye signal, and electrocardiogram signals. This algorithm comprises a filtering process consisting of a sequence of three filters. Each filter is responsible for a single cancellation in EEG signals. The first deals with line interference, the second cancels the electrocardiogram signals, and the third filter cancels the eyes signals. For each step, the authors applied an FIR filter implementing a least mean square algorithm. Correa et al. (2007) used this algorithm in a database containing five participants, in which previous researchers captured eye and electrocardiogram signals with dedicated sensors. The results showed that the algorithm attenuated the artifacts and consequently improved the quality of the EEG signal.
Jadav et al. (2020) proposed a scheme to remove noise data in EEG signals and preserve the signal of interest. Jadav et al. (2020) analyzed the application of the relative intersection of confidence interval (RICI) algorithm. Jadav et al. (2020) applied the algorithm in simulated data. The results are that after denoising the EEG with the RICI algorithm, the Rényi entropy-based analysis detected ERP components efficiently.
Kawala-Sterniuk et al. (2020) compared three smoothing filters in EEG signals, such as smooth filter, Savitzky-Golay, and median filter. The basic smoothing filtering conducts a moving average with a default span. The median filter is also a median average but with a higher windowing parameter. The Savitzky-Golay is a smoothing filter. Kawala-Sterniuk et al. (2020) applied the filters on a database with 52 participants. The results confirmed that filters impacted the higher quality of the EEG signal for use in the diagnosis for medical purposes. The Savitzky-Golay presented the best results because it did not distort the original signal.
3.2. Related work in software engineering
Fucci et al. (2019) investigated whether it was possible to use psychophysiological signals, including EEG signals to train machine learning techniques to make a binary classification of comprehension tasks: code, in case the artifact be a source code, or prose, i.e., in case the artifact be textual prose. Fucci et al. (2019) used EEG signals to train an SVM technique in 10-fold cross-validation and applied the bandpass filter in the EEG signal. Fucci et al. (2019) also removed the eye-movement components using ICA. The authors did not focus on classifying developer code comprehension. The SVM technique reached a precision of 72%, a recall of 66%, and an f-measure of 62%.
Lee et al. (2018) used EEG signals in an SVM machine learning technique to conduct a binary classification of the developers' level of difficulty in code comprehension tasks (easy/difficult), and another binary classifier, also an SVM, to identify the expertise level of software developer (expert/nonexpert). Lee et al. (2018) evaluated the effectiveness of the classifiers through precision, recall, and f-measure. The authors applied a frequency cutoff of 2Hz. The task difficulty classifier reached an f-measure of 63.3%, and the experience level classifier achieved an f-measure of 93.1%.
Radevski et al. (2015) developed a model to monitor the brainwaves of software developers during daily tasks. The objective of the work was to evaluate the feasibility of using EEG in a realistic scenario of software development. For this, Radevski et al. (2015) evaluated the model using the Technology Acceptability Questionnaire (TAM). Thus, Radevski et al. (2015) focused on assessing the developers' point-of-view in adopting this type of system. The conclusion is that although the EEG brings a new point of view about software development tasks, it is difficult to use and deploy.
Crk and Kluthe (2016) analyzed the developers' EEG signals about the developers' experience levels. The authors applied the high-low pass filter to EEG signals. Based on the EEG signal, the authors estimated the ERD (Event-Related Desynchronization). Crk and Kluthe (2016) used the ANCOVA statistical method to analyze the developers' expertise. The authors used the ERD and the five groups of expertise levels. The results showed a significant difference between the five levels of developer experience.
Lee et al. (2016) compared the difference between the power of the EEG signal between experienced and inexperienced developers. Lee et al. (2016) applied band-pass filters to the EEG signals to attenuate noise from external devices. The investigation focused on the different frequencies of the EEG signal, i.e., alpha, beta, delta, gamma, and theta. Lee et al. (2016) identified a significant difference between experienced and inexperienced developers in the beta frequency.
In general, the data presented in Table 1 shows an opportunity to verify the effectiveness of filters in EEG signals in the classification of developers’ code comprehension. The literature applied filters in EEG signals without investigating the effectiveness of filters in EEG signals. They also did not focus on the classification of developers’ code comprehension. Thus, research on software engineering applied filters to the EEG signals without pointing out the effectiveness of using filters in EEG for software engineering applications.
Table 1 Overview of related work.
| Focused on EEG | Applied Filter | Technique | Classification | Context | |
| Proposed work | Yes | High-Low pass, ICA, Removal of Abnormal Signals |
Random forest | Multi-class | Code comprehension |
| Fucci et al. (2019) | No | Bandpass | Random forest | Binary | Task type |
| Lee et al. (2018) | No | Lowpass | Support vector machine | Binary | Difficulty and experience Level |
| Radevski et al. (2015) | Yes | None | Not used | Does not apply | Code comprehension |
| Crk and Kluthe (2016) | Yes | Bandpass | Not used | Does not apply | Expertise level |
| Lee et al. (2016) | Yes | Bandpass | Not used | Does not apply | Expertise level |
4.Materials and methods
This section describes the methodological aspects of this work. First, Section 4.1 defines the main objective and the research question of this study. Section 4.2 describes the hypothesis that guides the investigation of this research. Section 4.3 shows the study setup. Section 4.4 detail the profiles of the participants. Section 4.5 describes the effectiveness metrics of the classifiers. Finally, Section 4.6 shows the variables and the procedure of analysis we performed in this study.
4.1. Objective and research question
We aim to filter EEG signals with a high-and-low pass filtering designed with a Finite Impute Response method with a hamming window, using fast ICA to remove eye components. This work seeks to analyze the impact of the EEG filter we designed with respect to the effectiveness of classifying developers' code comprehension in the context of software engineering.
Therefore, the following research question to investigate in this work:
RQ: Does applying filters to EEG signals improve random forest's effectiveness in classifying developers' code comprehension?
4.2 Hypothesis
This work investigates whether a filtering process on the EEG signals impacts the effectiveness of the machine learning technique to classify developers’ code comprehension. The filtering process consists of rejecting abnormal EEG signals, followed by a bandpass filter, and removing artifacts that are not related to the task of code comprehension of the EEG signal, e.g., the involuntary movement of the eyes. This work assumes that the existence of this conjoint of unfiltered noises and artifacts in EEG signals can impair the analysis or the use of these signals for purposes in software engineering. In particular, this work assumes that filters can improve the effectiveness of classifying code comprehension of developers based on EEG signals. A random forest technique performs the classification because this technique is present in research on EEG signals in software engineering. The hypotheses are specified below:
Hypothesis 1-0: The application of filters to the EEG signal does not impact the effectiveness of the random forest learning technique (Eff(RF)) to classify the developers' code comprehension. Then, the effectiveness of the classifier trained with filtered EEG data (EEGf) performs equal to or below the classifier trained with unfiltered EEG data (EEGu):
H1-0: Eff(RF) EEGf <= Eff(RF) EEGu
Alternative hypothesis 1-1: The treatment of EEG signals with filters impacts the effectiveness of the random forest learning technique (Eff(RF)) to classify developer’s code comprehension, and the effectiveness of the classifier trained with filtered EEG data (EEGf) is greater than the classifier trained with unfiltered EEG data (EEGu):
H1-1: Eff(RF) EEGf > Eff(RF) EEGu
4.3. Study flow
Figure 3 shows the three stages of this study: EEG monitoring (Figure 3.1), data pre-processing (Figure 3.2), and data classification (Figure 3.3).

Stage 1. EEG monitoring. Figure 3.1 presents the steps to obtain the EEG data from the developers. The wireless device Emotiv Epoc+ (Emotiv, 2020) was used and deployed on the developers' heads. While Emotiv Epoc + captures EEG signals, developers were performing code comprehension tasks. These tasks consist of the developer interpreting a source code and deducting its result. For this, the developer chooses one of the possible answers among five options. We timed the tasks in 60 seconds. If a participant does not answer the comprehension tasks within this time limit, the software considers it "Not response".
Figure 4 presents an example of this task, and Table 2 contains the description of each comprehension task performed by the developers. The following link shows all the code of the comprehension tasks:
https://luciangoncales.github.io/studies/jartsupplementary2020/.

Table 2 Details of the comprehension tasks.
| ID | Task Objective | C | L | M |
| T1 | Salary calculation | 1 | 10 | 1 |
| T2 | Salary calculation - Version2 | 1 | 17 | 5 |
| T3 | Calculate soccer points | 1 | 8 | 1 |
| T4 | Calculate soccer points - Version2 | 2 | 14 | 2 |
| T5 | Obtain current date | 1 | 6 | 1 |
| T6 | Obtain current date - Version2 | 5 | 30 | 5 |
| T7 | Count elements in a queue | 1 | 10 | 1 |
| T8 | Count elements in a queue- Version2 | 2 | 16 | 2 |
| T9 | Count type of playing cards | 1 | 19 | 1 |
| T10 | Count type of playing cards- Version2 | 5 | 44 | 5 |
Legend:
C: Number of classes, L: Number of Lines,
M: Number of methods
Stage 2. Data pre-processing. Figure 3.2 shows the second stage, which starts the processing of the EEG signals. Synchronize and store: while developers perform the comprehension tasks, the Paradigm software synchronizes the developers' current events with the EEG signals. For this, the software Paradigm inserts ID markers in the EEG signals, which specifically indicate the type of event in a specific location of the EEG signal. The software inserts the task ID (from 1 to 10) and the ID of tasks' answers. For this, Paradigm inserts markers corresponding to the type of response (Correct, Incorrect, and No response), which are respectively the markers 17, 27, and 37.
Filter:the EEG data passes by a filtering process, the same which was described in Section 2.2, thus generating the filtered EEG data (EEGf). The EEG unfiltered data (EEGu) refers to the same EEG data but discarding the filtering step. EEG is a non-invasive approach, and electrodes are deployed above the scalp consequently. Between the scalp and the surface of the cortex contain nerves and muscles that can produce noises that can affect the EEG signals. Raw EEG signals (EEGu) also might include eye blinks and heart beating signals. In other words, there is the presence of other signals than EEG. Removing components and filtering high and low bands are the main difference between the filtered EEG signals and the unfiltered ones. A filtered signal (EEGf) can lead to an improved classification of code comprehension in machine learning algorithms. Brainwave Attribution: This step is responsible for assign the tasks EEG data to the class corresponding to the developer’s answer. For instance, if the developer has answered task number 5 correctly (marker 17), the brain waves for that task are assigned to that this class. Thus, these waves are now part of the respective answer class. Data balance: both groups of data (filtered (EEGf) and unfiltered (EEGu)) are balanced. The method used was under-sampling without replacement. For this, we applied an under-sampled randomly the predominant classes (incorrect and unanswered) to the minority class (Correct). Balancing the data classes avoids the machine learning technique to make biased classifications. The classification bias can happen due to a predominance of a type of class over others. After windowing the data every ten seconds and balancing all the EEG filtered and unfiltered data, the wholeEEGf(filtered dataset) contains 2.278 lines of EEG readings, each line attributed to an event, i.e., the task answer (897 as correct, 440 as incorrect, and 941 as no response). TheEEGu(unfiltered dataset) contains 2.401 lines of EEG readings containing the event (962 as correct, 467 as incorrect, and 972 as no response). In particular, every EEG line is related to an event, i.e., the participants answer correct, incorrect, or non-response. The filtering process removed abnormal signals, and consequently, the filtered signals (EEGf) have fewer EEG readings lines about the unfiltered signals dataset (EEGu).
Stage 3. Classification. Figure 3.3 consists of classifying developers' code comprehension based on EEG signals. Extract features + PCA: This stage addresses the extraction of variables from the set of unfiltered EEG signals (EEGu) and the data set with filtered EEG signals (EEGf). This stage uses the multitaper method in both EEG sets to extract the variables. Multitaper transforms brain signals from the time domain to the frequency domain (Prerau et al., 2017). Specifically, we decomposed the waves of each of the 14 channels of the electroencephalogram into six frequency ranges: Delta, Theta, Alpha, Low Beta, High Beta, and Gamma.
This process generated 84 variables (6 frequency ranges by 14 channels). We reduced the dimensionality of both datasets with a Principal Component Analysis. After the PCA, TheEEGfdataset contained 14 columns by 2.278 lines, and the PCA also reduced theEEGu14 columns by 2.401 lines. In particular, the PCA reduced the number of columns from 84 to 14 in both datasets. In both datasets, the PCA detected 4 components. The variance of the PCA version ofEEGfabout the original data are the following: PCA component 1: has a ratio of 0.98 and a cumulative ratio of 0.98. PCA component 2 has a ratio of 0.008 and a cumulative ratio of 0.99. PCA component 3 has a ratio of 0.002 and a cumulative ratio of 0.99. PCA component 4 has a ratio of 0.003 and a cumulative ratio of 0.99. The variance of the PCAs version ofEEGuabout the originalEEGuare the following: PCA Component 1 has a ratio of 0.420465 and a cumulative ratio of 0.420464, the PCA Component 2 has a ratio of 0.128873 and a cumulative ratio of 0.549337, the PCA Component has a ratio of 0.0805973 and a cumulative ratio of 0.629935, and the PCA Component 4 has a ratio of 0.0720947 and a cumulative ratio of 0.702029.Classifier:This step trains the random forest (RF) classifier using 10-Fold cross-validation, where each fold consists of a 70% training group and a 30% test group. We trained the classifier to perform a multiclass classification. Based on the EEG data, the classifier must identify whether the programmer comprehends the source code correctly, incorrectly, or does not answer the question (unanswered).Metrics:metrics collected from the classification results are precision, recall, and f-measure (section 4.4).
4.4. Participants’ profile
Consent formulary: Before performing the comprehension tasks, the developers signed a consent form, authorizing the authors of this study to use their psychophysiological EEG data for research purposes.
Personal characteristics: we recruited a total of 35 participants to carry out the study. The age of the participants varies between 17 and 46 years.
Education: Some participants have a college degree and pursue postgraduate courses in Applied Computing (31%, 11/35). Moreover, 29% (10/35) completed higher education. About 11% of the participants had completed high school (4/35), 5% (2/35) of participants were pursuing a doctorate in Applied Computing, 2% of participants finished their master's degree (1/35), and 2% completed a specialization (1/35). One participant was in high school (1/35). The bachelor course of the participants is related to software development. In particular, they were involved or finished courses such as computer science (29%, 10/35), information systems (17%, 6/35), systems analysis (14%, 5/35), digital games (14%, 5/35), and other courses (26%, 7/35) such as computer engineering, electronic engineering, bachelor of science in computer science, information security, and computer technician.
Profession: A total of 34% (12/35) of the participants mainly work as software developers, and 23% (8/35) are students in scientific initiation and research assistants. About 14% (5/35) act as software analysts, 3% (1/35) as computer assistants, 2% (1/35) are data scientists, 2% (1/35) are project managers, 2% (1/35) are software engineers. Moreover, the participants also work as entrepreneurs (2%, 1/35), computer technicians (2%, 1/35), and about 11% (4/35) did not specify their jobs. A total of 34% (12/35) work at universities. Moreover, participants also work in different companies such as Banrisul, Correios, GetNet, Altus, CIGAM, Kenta, Ilegra, and Umbler. About 14% (5/35) of the participants did not reveal the names of their workplaces.
Personal skills: A total of 57% (20/35) of the participants have up to 2 years of experience with software development. A total of 14% (5/35) of the participants develop software between 3 to 4 years, 9% (3/35) of participants work with software development between 5 to 6 years, and 20% (7/35) have more than seven years of experience developing software. Regarding Java language, i.e., the language used in the tasks of this study, 46% (16/35) of the participants reported that they have basic knowledge, 26% (9/35) know the language moderately, and 29% (10/35) are proficient.
4.5. Effectiveness metrics
This section presents the effectiveness metrics used in this study. In this study, we measured precision, recall, Matheus coefficient correlation (MCC), and f-measure of the classification results.
True Positive (TP) refers to the number of classifications reported as correct by the classifier, in which the classifier should report it as correct. True Negative (TN) refers to the number of classifications that technique should report as incorrect, and the classifier correctly classified it as incorrect. False Positive (FP), e.g., is the number of results that should be incorrect, but the classifier reported as correct. False Negative (FN) is simply the opposite of false positive, i.e., classier report the results as "false" but should address as “true”.
Precision: it refers to the percentage of the correct classified labels that we expected to be correct. However, not considering the false positives (FP) values (Eq. 1).
Recall: it refers to the percentage of the correct classified labels not considering those labels that the classifier pointed as incorrect, but it should treat as correct, i.e., False Negatives (Eq. 2).
Matthews correlation coefficient (MCC): MCC is a correlation coefficient between the ground truth (observed values) and classified labels (classifier results). This coefficient varies from -1 and 1, where values close to zero imply the classifier results are equivalent to a random guessing method. Values near to -1 mean an uncorrelated classification, and close to 1 indicates an optimal classification. Thus, this value can point to whether the precision, recall, and f-measure are not misleading.
F-measure: It refers to a harmonic average between precision and recall.
4.6. Variables and analysis procedures
Dependent variables. The precision and recall describe the results obtained by the random forest technique to classify developers' code comprehension. However, the dependent variable controlled in hypothesis testing in this work is the f-measure. We adopted this variable because it already encompasses recall and precision. Moreover, this metric is a harmonic mean between these measures; the f-measure usually penalizes more the results and generates a lower value than precision and recall.
Independent variables. The independent variables of this study are the Filtered EEG data (EEGf) and the unfiltered EEG data (EEGu).
Analysis procedure. To analyze the effect that the application of EEG filters causes on the developers' code comprehension classification, we conducted a descriptive analysis, normality tests of the classifiers' effectiveness (F-measure), and hypothesis tests. We performed a descriptive analysis of the data to observe its distribution, followed by the normality tests Kolmogorov Smirnov and Shapiro Wilk test. The p-value > 0.05 indicates that the normal distribution in any of these tests. The statistical tests we conducted to analyze the effectiveness of the machine learning classifiers (EEGf x EEGu) were the paired t-test, the Wilcoxon test, and the Mann-Whitney U test. These tests need a p-value < 0.05 to accept the alternative hypothesis. We used the paired t-test and the Wilcoxon signed-rank test because the literature already used these tests to demonstrate the effectiveness of classifiers (Demšar, 2006). Moreover, the conjoint use of these tests covers the normal and not normally distributed data. The t-test is appropriate for datasets with normal distribution and the Wilcoxon signed-rank to test data with non-normal distribution. Finally, we used the Mann-Whitney U test because it provides a rank about the effectiveness of the classifiers, making it possible to obtain a ranked result concerning the effectiveness of the machine learning technique.
5. Results
Table 3 presents the macro precision, recall, and f-measure of the Random Forrest classifier trained with the data set with unfiltered EEG (EEGu) and the filtered EEG data (EEGf).
Table 3 Effectiveness results of RF classifiers.
| RF - Filtered EEG | RF - Unfiltered EEG | |||||
| P | R | F | P | R | F | |
| Fold 1 | 0,77 | 0,76 | 0,76 | 0,61 | 0,62 | 0,62 |
| Fold 2 | 0,69 | 0,69 | 0,69 | 0,65 | 0,64 | 0,64 |
| Fold 3 | 0,73 | 0,73 | 0,73 | 0,64 | 0,63 | 0,62 |
| Fold 4 | 0,73 | 0,72 | 0,72 | 0,56 | 0,56 | 0,56 |
| Fold 5 | 0,68 | 0,67 | 0,67 | 0,62 | 0,58 | 0,59 |
| Fold 6 | 0,60 | 0,60 | 0,60 | 0,58 | 0,59 | 0,58 |
| Fold 7 | 0,74 | 0,73 | 0,72 | 0,62 | 0,62 | 0,61 |
| Fold 8 | 0,70 | 0,70 | 0,69 | 0,60 | 0,60 | 0,60 |
| Fold 9 | 0,70 | 0,70 | 0,70 | 0,61 | 0,61 | 0,60 |
| Fold 10 | 0,68 | 0,68 | 0,67 | 0,60 | 0,63 | 0,60 |
| AVG | 0,70 | 0,70 | 0,70 | 0,61 | 0,61 | 0,60 |
Legend:
P: Precision, R: Recall, F: F-measure, AVG: Average
A “macro” metric means it is an average of the respective metrics of each classified class. For instance, the precision of the classifier trained with filtered EEG in fold one is equivalent to the average between the precision value of correct, incorrect, and unanswered classes. It is the same rule applied for the recall and f-measure in the respective folds. The results in Table 3 are relative to each of the folds of the cross-validation. The average precision, recall, and f-measure of the Random Forrest classifier trained with filtered data was higher than the classifier trained with unfiltered EEG data. Random forest trained with unfiltered EEG data obtained an average precision and recall of 61% and 60% in f-measure.
The classifier trained with the filtered EEG data obtained a precision and recall of 70%, and the f-measure achieved 71% to classify developers' code comprehension. After applying the filters, the random Forrest classifier obtained a precision and recall of 9% higher than the Random Forrest classifier trained with unfiltered data. The f-measure was 10% higher than the trained classifier with filtered EEG data.
Matthews correlation coefficient (MCC): Figure 5 shows the results of the MCC of the classifier trained with unfiltered EEG data (green) and filtered EEG data (blue). The MCC coefficient of the random forest trained with filtered EEG data outperformed the MCC coefficient of the classifier trained with unfiltered EEG data. The higher coefficient means that the classifier trained with Filtered EEG has a stronger correlation with the classification results than the classifier trained with unfiltered data. Finally, the MCC values are higher than zero, meaning that both classifiers are not making random classifications.

Descriptive analysis. Table 4 presents the descriptive statistics about the f-measure of the random forest classifiers trained with filtered EEG data and unfiltered EEG data. Through Table 4, it is possible to notice that the effectiveness of the random forest classifier without the applied filters is lower than the classifier trained with a filtered EEG dataset to classify the developer code comprehension. This lower effectiveness of the classifier trained with unfiltered EEG data is evident throughout the data distribution. The minimum value (Min), the first quartile (25), the median, the third quartile (25), and the maximum value are higher for random forest classifier trained filtered EEG data. Figure 6 presents the boxplots representing the distribution of the f-measure data obtained by the random forest trained with filtered data (blue) and the unfiltered data (green).
Table 4 Descriptive statistics.
| Min | 25 | Med. | 75 | Max | AVG | SD | Var. | P-Value (Filtered > Unfiltered) |
||
| T-Test | Wilcoxon | |||||||||
| RF EEG unfiltered |
0,48 | 0,56 | 0,61 | 0,64 | 0,74 | 0,6 | 0,059 | 0,003 | 0,000001 | 0,000025 |
| RF EEG filtered |
0,55 | 0,66 | 0,7 | 0,75 | 0,78 | 0,69 | 0,06 | 0,004 | ||
Legend: Min: Minimum, Med: Median, Max: Maximum, SD: Standard Deviation, Var: Variance.

To confirm this, we performed the Kolmogorov Smirnov and Shapiro Wilk normality tests. The Kolmogorov test showed normality for both data sets (p > 0.05). However, the Shapiro Wilk test showed that the filtered data set was not normally distributed (p < 0.05). For this reason, we performed the paired t-test and the non-parametric Wilcoxon test.
Paired T-test. A paired t-test was performed on f-measure samples to determine if there is a difference in the mean effectiveness between a classifier trained with filtered EEG data and a classifier trained with unfiltered EEG data. We applied the t-test to the respective f-measures samples of classifiers. In other words, we collected a total of 60 data of effectiveness (f-measure). In particular, 30 from each machine learning classifier and 10 of each answers' class (Correct, incorrect, and unanswered). The results showed that the effectiveness of the classifier trained with unfiltered EEG (EEGu) was lower (0.6 ± 0.059) compared to the classifier trained with the filtered (EEGf) EEG (0.69 ± 0.06), a difference from the means of 0.09, that is, 9% (95% CI, 0.066 to Inf), t (29) = 5.91, p = 0.000001.
Wilcoxon test. We performed a Wilcoxon signed-rank test because it is non-parametric. Thus, it satisfies the requirement to test not normally distributed datasets. It is the specific case of the distribution of the effectiveness of the classifier trained with filtered data. Moreover, the properties of the Wilcoxon test provide a safer comparison between classifiers because it does not require normal distribution and does not assume homogeneity of variances (Demšar, 2006). The Wilcoxon test showed that using filtered EEG data (EEGf) elicited greater effectiveness to classify developers’ code comprehension compared with a random forest classifier trained with unfiltered EEG data (EEGu) filters (V = 430, p = 0.00002).
Mann Whitney U test. This test is the nonparametric version of the t-test and is ideal for independent groups. We performed this test to avoid the threat of independence in the division of data between the classifiers' folds. This test compares the difference between the average ranks of the classifiers' effectiveness. Thus, this test ranks which classifier was most effective. Table 5 shows that the rank points of the random forest classifier with filtered EEG (EEGf) data are higher than the rank of the random forest classifier trained with unfiltered EEG (EEGf) data.
Table 5 Mann Whitney U test and the respective ranks for each classifier.
| Classifier | Mean Rank |
Sum Ranks |
U | P-Value |
| RF filtered | 41,03 | 1231 | 134 | 0,000002991 |
| RF unfiltered | 19,97 | 599 |
Therefore, through these results, we concluded that the f-measure effectiveness metric of the random forest classifier trained with filtered EEG data was higher compared to the classifier trained with unfiltered EEG data to classify the developers' code comprehension. Thus, the alternative hypothesis of this study is accepted.
6. Discussion
This section presents a discussion regarding the results presented in section 5. In Section 6.1, there is a discussion about the implications of filtering EEG signals in code comprehension. Section 6.2 discusses the threats to the validity of the results.
6.1. Implications
Code comprehension is a relevant cognitive process in software engineering (Crk & Kluthe, 2016). Studies estimate developers dedicate 70% of their time to comprehend the source code. They apply this time before making any changes to the source code. Classifying developers' code comprehension could help to reduce the amount of time they usually dedicate to comprehend programs. In this way, the code comprehension classifier would be a means for a recommendation system, which would allocate shorter tasks for the developer when he has a long time without comprehending a software task. This situation could also be indicative of refactoring and reducing the complexity of the source code.
According to the results, when using the random forest technique to classify the developer code comprehension, the results showed the use of filters is related to the better effectiveness of the random forest classifier. So, this study points out that the filtering process used in this study (section 2.2) can effectively improve the classification of developers' code comprehension using a Random Forrest technique. The main advantage is the greater precision and recall achieved by the classifier. The disadvantage is that applying the filters consumes computational resources and would take time to process the EEG signals. These characteristics are not performance-friendly. To avoid the delay that filtering EEG causes in data processing, developers should disregard the application of filters in EEG signals. However, if future researchers apply a random forest technique to the real-time scenario, the classifier will show lower effectiveness when working with unfiltered EEG data. For this, future research should test another classifier that could deal better with the unfiltered EEG.
We also expect that this study will be used as a model to evaluate the effectiveness of using EEG signal filters. Another expectation is that research on software engineering and computing evaluates the impact of EEG filters in studies of machine learning in applied areas. For instance, this study focused on the developers' code comprehension. Future studies could investigate the impact of filters in the classification of perceived difficulty or developers' cognitive load. The investigation about filters in EEG signals in software engineering research would bring to the reader, and researchers, empirical reinforcement for the adoption or not of the EEG filters. For example, in a scenario where the difference in adopting EEG filters for trained the random forest was not relevant, it could justify not spending computational resources to process filters in the EEG signals.
6.2. Limitations
This work contains some limitations, which we mitigated and addressed to avoid threats to the results obtained.
To ensure that we made the correct collection of the EEG data, we followed instructions from the EEG device manufacturer to ensure that the sensors were in the right place on the users' scalp. To perform the EEG filtering, we followed the process defined in section 2.2. For this, we used functions from Python's MNE library. Moreover, the EEG data has markers that relate the events to the respective parts of EEG signals.
We timed the duration of comprehension tasks in 60 seconds. We timed the comprehension task to reflect the size of the source code and provide the necessary time for participants to finish it. There is a threat that this time maybe is not enough for all users and may affect their performance.
To ensure we correctly conducted the statistical analysis, we used statistical tests adopted and reported on the machine learning literature. Next, we performed the normality tests Kolmogorov Smirnov and Shapiro Wilk to verify the normality
distribution of the data when p > 0.05. Thus, we adopted parametric and non-parametric tests to analyze the effectiveness of the classifier. Both tests pointed out the higher effectiveness in the classifier trained with filtered data compared to the random forest classifier trained with filtered EEG data. We also evaluated the machine learning techniques with 10-fold cross-validation. This method avoids the threat of existing a supposed lucky split division between training and test set. The EEG signals may contain EOG artifacts because we did not have an appropriate channel that captured heart signals. The EOG artifacts can threaten the validity of the results. The end of the filtered EEG signal may contain spurious frequencies. The presence of spurious frequencies may jeopardize the performance of the classifiers.
Finally, the results of this study are limited to the laboratory environment since it does not perform real-time classification. Two facts can threaten the generality of the results: there is also a limited variety of developers' profiles and the limited number of tasks that developers performed in this study.
7. Conclusions
Research in software engineering has generally adopted applied filters in EEG signals, claiming that the removal of noise from the EEG signal improves the precision of the analysis. This because the EEG filters would be responsible for removing noises that are not of interest to such a study. However, studies have adopted such filters based on claims in the research of other areas. Thus, there was an evident lack of what was a real improvement is compared to the use of unfiltered EEG signals for software engineering purposes. Therefore, this work investigated whether EEG filters improve the effectiveness in the classification of code comprehension.
For this, we collected EEG data from 35 developers solving code comprehension tasks. We used this data to train a random forest classifier. We used the 10-fold cross-validation to train and evaluate the classifier. Moreover, we also reported the classifiers' precision, recall, and f-measure. We conducted statistical analyzes to test the difference in effectiveness between the random forest classifier trained with filtered EEG data and the random forest classifier trained with unfiltered EEG data to classify developers' code comprehension. The paired t-test and the Wilcoxon test presented the average effectiveness (f-measure) increased in a random forest classifier after using filters in EEG signals to classify developers' code comprehension.
As future work, we intend to extend the evaluation to other machine learning classifiers, such as Neural Networks and Naïve Bayes. We also aim to increase the number of participants, the number of tasks, and testing the classifier in a realistic scenario.