


 nueva página del texto (beta)
 Inglés (pdf)
 Artículo en XML
 Referencias del artículo
 Enviar artículo por email
 Citado por SciELO
  Similares en
SciELO
Similares en
SciELO 
 Permalink
1. Introduction
The versatility of silver (Ag) nanoparticles ranges from catalysis, anticancer, antimicrobial activities to printed electronic devices. Ag conductive inks in printing technology for radio-frequency identification (RFID) tags, sensors, switches, electrodes, and other flexible electronic components have gained much attention because of their electrical conductivity and resistance to oxidation (Lai et al., 2014; Rajan et al., 2016). Ag nanoparticles were also combined with graphene to improve the conductivity of nonmetallic inks (Deng et al., 2017).
Ag nanoparticles are commonly synthesized by the chemical reduction of Ag salts. For Ag conductive inks, a high concentration of nanoparticles is desirable. Electrical conductivity can be tailored by the morphological distribution and packing density of nanoparticles (Lai et al., 2014; Rajan et al., 2016). After the sintering, the voids are inevitably left on the silver track. The ink containing different sizes and shapes of nanoparticles is beneficial because more voids are filled and the packing density is therefore increased (Yang et al., 2012). It follows that the conductivity is higher than those measured in uniform nanoparticles. Ag nanospheres of less than 10 nm in diameter were successfully obtained and tested as conductive inks on different substrates (Dang et al., 2015; Trinh et al., 2019).
In addition to transmission electron microscopy (TEM), the morphological variation of metallic nanoparticles can be observed from the surface plasmon resonance. The effect is commonly investigated by ultraviolet-visible (UV-Vis) spectrophotometry and corresponds to the change in color of nanosuspensions. Smartphone colorimetry is therefore increasingly implemented in Ag nanostructure characterizations. The application is extended to detect ammonia (Amirjani & Fatmehsari, 2018) and mercury (Firdaus et al., 2019; Jarujamrus et al., 2018; Sajed et al., 2019) in the presence of either Ag or Au nanoparticles.
Plant extracts have already attracted much attention as the reductants in the production of metallic nanoparticles because they are environmentally friendly and harmful chemicals involved in the process are decreased. Antimicrobial Ag nanoparticles were synthesized by using a variety of plants including Ocimum sanctum (Chandran et al., 2016), Neurada procumbens (Alharbi & Alarfaj, 2020), and Nelumbo nucifera (Supraja et al., 2017). Supraja et al. (2017) also demonstrated the anticorrosion properties of Ag nanoparticle coating on irons and steels. Aqueous leaf extracts from Belosynapsis kewensis (Bhuvaneswari et al., 2016) and Luffa acutangula (Vizhi et al., 2016) were respectively employed in productions of larvicidal and anticancer Ag nanoparticles. For catalytic applications, the use of
Citrus limetta peel extracted was demonstrated (Srivastava & Choubey, 2019). Other peel extracts including Carica papaya were also employed in the Ag nanoparticle synthesis (Balavijayalakshmi & Ramalakshmi, 2017). The development of green synthesis for conductive inks will be advantageous for both industrial and environmental points of view (Supraja et al., 2018; Wang et al., 2017).
In this article, the mulberry (Morus alba Linn.) leaf extract is used as a reducing agent and stabilizer in a green route to produce Ag nanoparticles. The factors affecting the synthesis of silver nanoparticles are investigated. The pH and temperature of the aqueous 1 mM AgNO3 solution are adjusted to tailor nanoparticles for specific uses. To investigate the possible increase in particle concentration for conductive inks, the syntheses using 0.1 M, 0.3 M, and 0.5 M AgNO3 solutions are compared. Furthermore, it is demonstrated that the smartphone could be effectively used in the quantitative assessment of colors after prolonged storage.
2. Materials and methods
AgNO3 (99.9%), NaOH (99%), and HNO3 (98%) were respectively obtained from POCH, Merck, and Sigma-Aldrich. The mulberry leaves were locally collected in Prapayom District, Phatthalung Province in the south of Thailand. They were washed and cut into small pieces. Prepared leaves of 20 g were heated in 100 ml distilled water at 80 (C for 5 min. The obtained solution was filtered and centrifuged at 4000 rpm. In the nanoparticle synthesis, 5 ml of this mulberry leaf extract was mixed with 10 ml of aqueous AgNO3 solution and boiled for 15 min.
Three synthesis conditions for 9 samples were varied, namely pH, temperature, and AgNO3 concentration. Samples A1, A2, and A3 were prepared using 1 mM AgNO3 at 25 (C with varying pH values of 9, 11, and 13 respectively. The pH was adjusted by adding NaOH and HNO3 solutions. To investigate the temperature effect, samples A4, A5, and A6 were respectively synthesized at 25 (C, 80 (C, and 90 (C with a pH around 7.4-7.7. Finally, the concentration of AgNO3 solution was varied as 0.1, 0.3, and 0.5 M for the samples referred to as A7, A8, and A9 accordingly.
Ag nanosuspensions were characterized by UV-Vis spectrophotometry (Shimadzu, UV-1700 Pharma Spec) and scanning electron microscopy (SEM) equipped with energy dispersive spectroscopy (EDS). By using TEM (JEOL, JEM-2010) at a 200 kV accelerating voltage, the morphology of nanoparticles was imaged and the phase was probed by selected-area electron diffraction (SAED). After the storage at room temperature for 10 months, samples A1-A6 were photographed by an Android smartphone (OPPO A5) and their colors were classified by the ‘Colorimeter’ application based on 3 sets of parameters. The first classification scheme is the RGB color space consisting of the red (R), green (G), and blue (B) components. For the CIE color space, the L*, a*, and b* represent the lightness, green-red and blue-yellow respectively. Finally, the chroma is the colorfulness relative to the brightness of a white object and the hue angle from 0 to 360 corresponds to red, yellow, green, cyan, blue, magenta, and back to red. All parameters were averaged from 9 repeated measurements.
3. Results and discussion
The results in sections 3.1-3.3 demonstrate that the surface plasmon resonance of Ag nanoparticles is influenced by pH, temperature, and AgNO3 concentration in the synthesis. Finally, the smartphone colorimetry of Ag nanosuspensions after storing for 10 months is presented in section 3.4.
3.1. Effect of pH
As shown in Fig. 1 (a), the peak in UV-vis spectra is located slightly below 400 nm in the case of pH 9 (A1) and shifted to above 400 nm when the pH in the synthesis is increased to 11 (A2). This peak corresponds to the surface plasmon resonance of Ag nanoparticles. The broad and asymmetric peaks indicate the nonuniform size distribution in both A1 and A2. The shift of the surface plasmon resonance band is due to the changes in particle size and shape. TEM images clarify that nanoparticles in both A1 and A2 are spherical. The redshift should therefore reflect the increase in nanoparticle size but particle diameters in both cases are comparable around 20 nm.
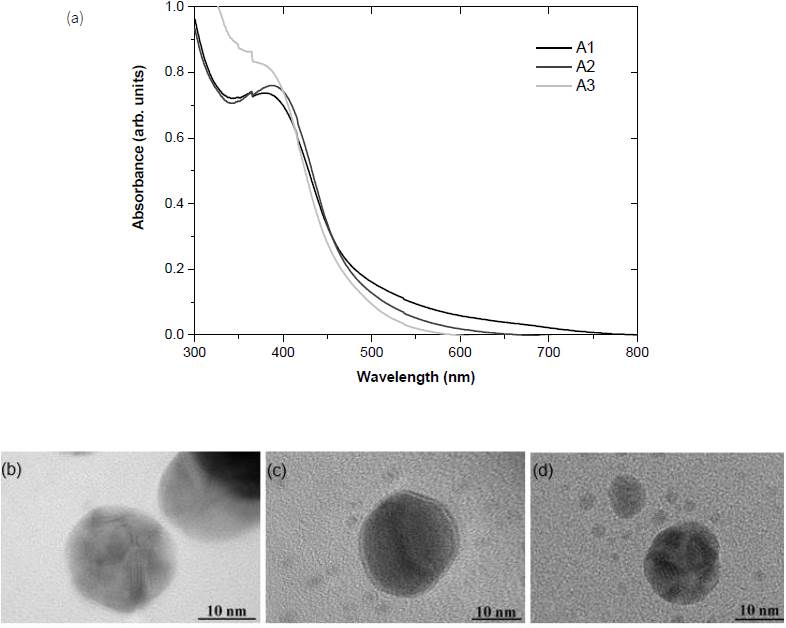
Figure 1 (a) UV-Vis spectra and TEM images of Ag nanoparticles synthesized with varying pH values of, (b) 9 (A1), (c) 11 (A2), and (d) 13 (A3).
The increase in pH to 13 (A3) reduces the particle diameter to 15 nm. The UV absorption below 400 nm is significantly enhanced but the peak is not clearly observed. The results agree with the pH effect reported by Xiong et al. (2013) that the higher absorbance was observed with increasing pH. The TEM image links this slight blue shift in the UV-vis spectrum to the reduction in particle size. As summarized by Nahar et al. (2020), the pH modifies charges on capping and stabilizing biomolecules during the synthesis which controls the Ag growth and therefore affects the particle size and shape.
3.2. Effect of temperature
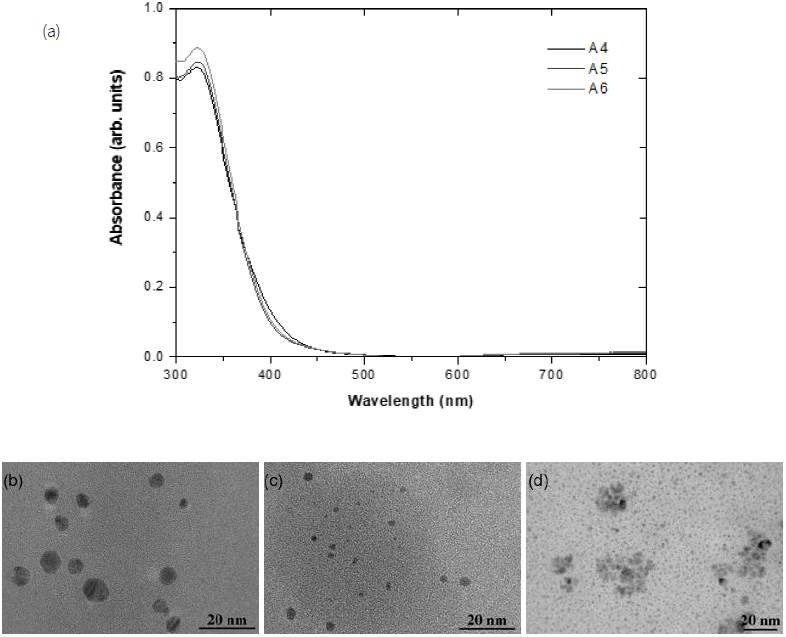
The temperature is less influential than the pH effect. In Fig. 2 (a), the UV-vis spectra in the case of 25 (C, 80 (C, and 90 (C reaction temperatures similarly exhibit the maximum optical absorbance at 330 nm. The shift to a lower wavelength than those in Fig. 1 (a) indicates the reduction in particle size of samples A4-A6. The symmetry of narrow peaks indicates a decrease in morphological distribution. The variation in the peak intensity with the temperature is due to the density of nanoparticles (Dakhil, 2017). The trend is in accordance with TEM images in Figs. 2(b)-(d) showing particles much smaller than 10 nm with a slight increase in density by higher temperature syntheses. Such changes are attributed to the increase in reaction rate with the temperature (Nahar et al., 2020).
3.3. Effect of AgNO 3 concentration
With increasing concentrations of AgNO3, the UV-Vis peak in Fig. 3 (a) is significantly shifted to higher wavelengths. TEM images in Figs. 3(b)-(d) confirm the largest size of nanoparticles from the synthesis using the highest AgNO3 concentration of 0.5 M (A9). Redshifts were previously observed in Ag nanoparticles synthesized with increased AgNO3 concentrations (Baláž et al., 2019; Dragan et al., 2018; Tolouietabar et al., 2020; Xiong et al., 2013). However, the intensity of the peak is substantially reduced suggesting that the nanoparticle concentration is decreased. Other characterization techniques are then used to clarify this discrepancy. In the case of the lowest AgNO3 concentration of 0.1 M (A7), the SAED rings in Fig. 3 (e) are clearly characterized as fcc Ag crystals with the diffraction from (111), (200), (220), (311) lattice planes (Baláž et al., 2019; Saravanan et al., 2017). When the concentration of AgNO3 was increased, the sharpness of the rings in Figs. 3(f)-(g) is reduced which is an indication of mixed phases.
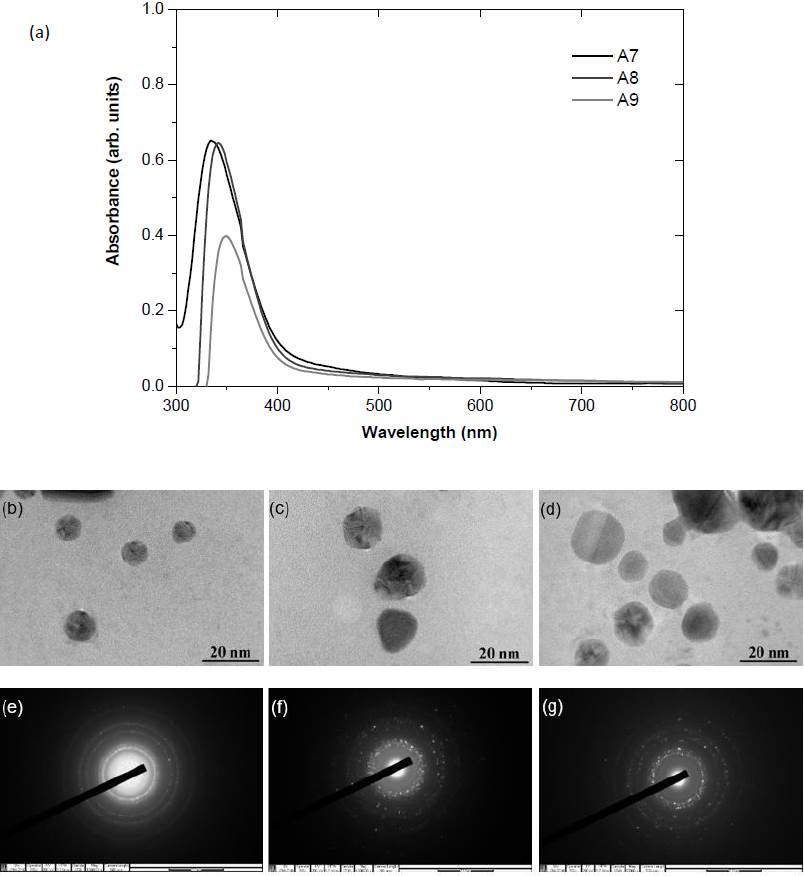
Figure 3 (a) UV-Vis spectra, (b-d) TEM images, and (e-g) SAED rings of Ag nanoparticles synthesized with variations in AgNO3 concentrations (A7-A9)
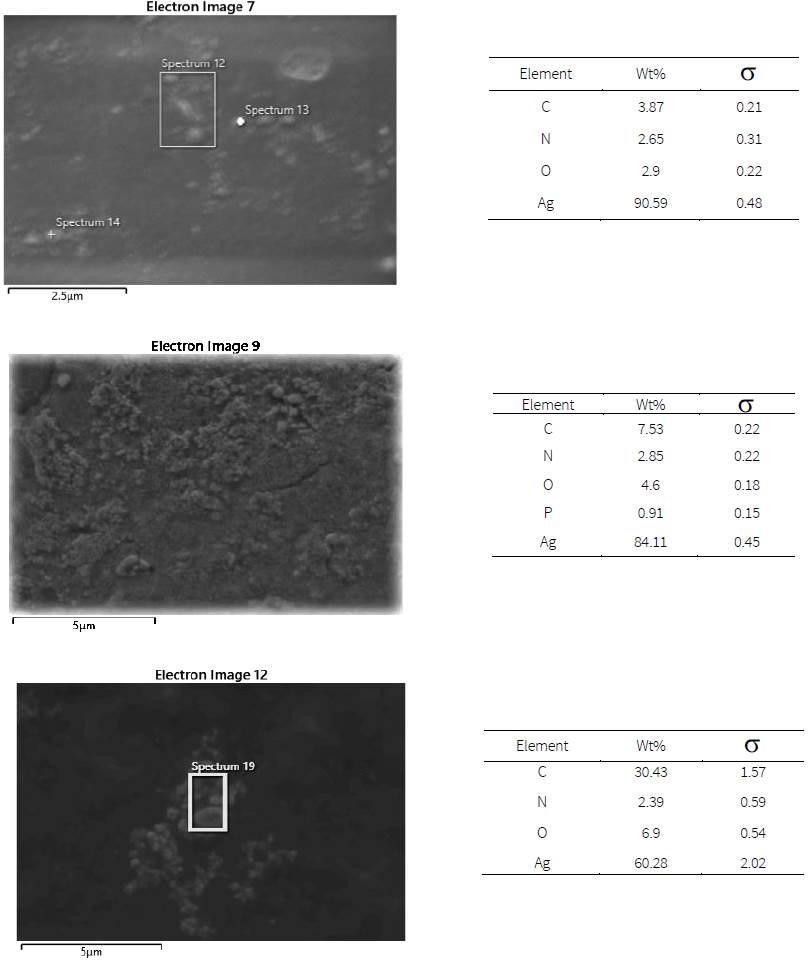
From the SEM micrographs in Fig. 4, the surface of drop-casting nanoparticles is uniform only in the case of the lowest concentration (A7). The EDS confirms the highest composition of Ag over 90%. The Ag composition is respectively reduced to 84% and 60% as the AgNO3 concentration was increased to 0.3 and 0.5 M. The increases in other elements suggest that the reduction is incomplete when excessive AgNO3 concentration is used. The irregular morphology of drop-casting nanoparticles is consistent with the SAED and EDS results.
3.4. Effect of storage
The stability of the nanosuspension is vital for their storage and usage. Based on the visual inspections, Ag nanoparticles in this work have dispersed in liquid carriers without visible sedimentation for 10 months. However, the colors of nanosuspension have drastically changed from those after the synthesis as shown in Table 1. The gradual change in color of Ag nanosuspension was shown 24 h, 2, and 8 weeks after the synthesis by Hussain et al. (2018). Besides, UV-Vis spectra could be used to compare the nanosuspension after different times of storage (Mražíková et al., 2018; Kavuličová et al., 2018). Dang et al. (2015) monitored the agglomeration in Ag conductive inks after 15, 30, and 45 days. In this work, smartphone colorimetry is capable of aiding visual inspections. The colors of samples A1-A6 are firstly quantified by the RGB color space and compared in Fig. 5. For every sample, the lowest value is the B whereas the R is the highest corresponding to the majority of reddish-brown appearance. The R value is substantially increased when the maximum pH of 13 (A3) is used in the synthesis. By contrast, the R value is not sensitive to the temperature in the synthesis. The G and B values remain rather constant for samples A4 and A5. It follows that the samples A4-A6 are not clearly discriminated. These pH and temperature effects are consistent with the results from samples A1-A6 before the storage in Figs. 1 and 2.
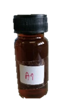
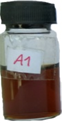
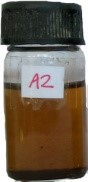
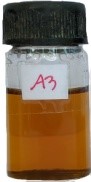
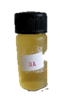
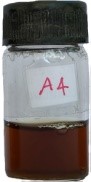
Table 1 Photographs of nanosuspensions synthesized with varying temperatures and pH values after synthesis and storage for 10 months.
| Sample | pH | Temperature °C | After synthesis | After storage |
| A1 | 9 | 25 |
|
|
| A2 | 11 | 25 |

|
|
| A3 | 13 | 25 |

|
|
| A4 | 7.4 | 25 |
|
|
| A5 | 7.6 | 80 |

|

|
| A6 | 7.7 | 90 |

|

|
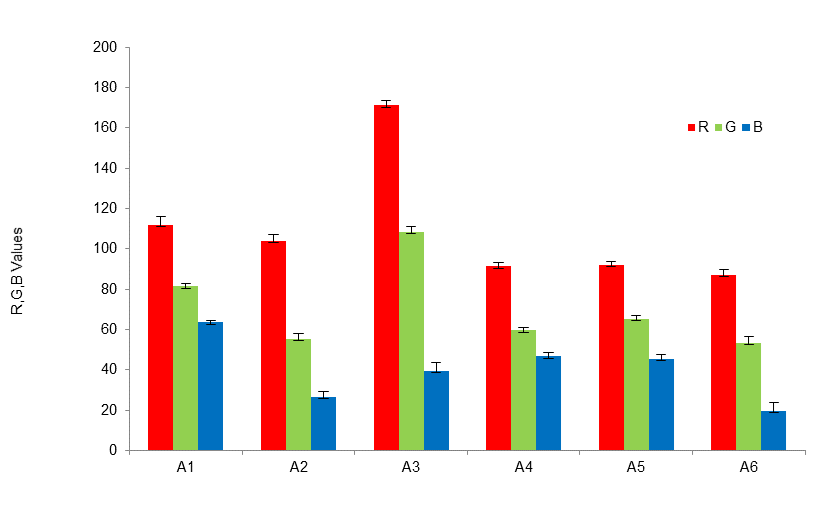
Figure 5 R, G, and B values from smartphone colorimetry of Ag nanoparticles synthesized with variations in pH values (A1-A3) and temperatures (A4-A6).
The classification by the RGB color space is complemented by other color parameters. Comparing samples A1-A3, the increase in pH in the synthesis results in substantial rises in the CIE b* value in Fig. 6 and the chroma value in Fig. 7. In addition, sample A3 has the highest CIE L*, hue, and chroma values. Interestingly, the color difference of samples A4-A6 can be clearly detected by using CIE and hue parameters whereas the RGB color space could not distinguish them. The CIE b* value in Fig. 6 and the hue angle in Fig. 7 are significantly increased with increasing synthesis temperature from 25 (C to 90 (C. The RGB color space has mostly been used in smartphone colorimetry (Amirjani & Fatmehsari, 2018; Firdaus, 2019; Sajed et al., 2019) and smaller error bars in Fig. 5 indicate the precision of this method. However, the results from Figs. 6 and 7 strongly suggest that the CIE L*a*b* as well as chroma and hue angle are effective alternatives in the color classification.
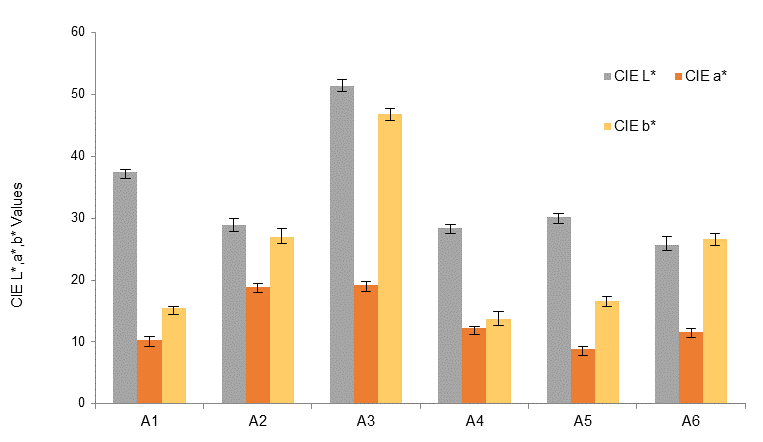
Figure 6 CIE L*, a*, and b* values from smartphone colorimetry of Ag nanoparticles synthesized with variations in pH values (A1-A3) and temperatures (A4-A6).
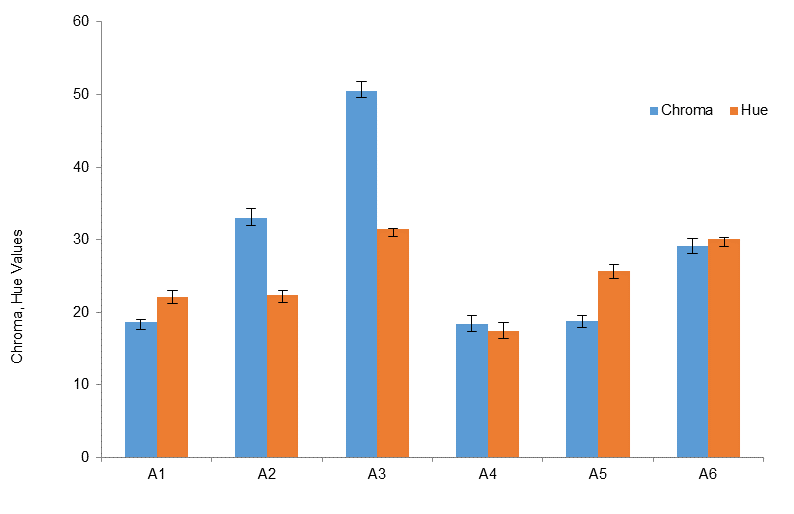
4. Conclusions
This study provides evidence for developing value-added nanoparticles for conductive ink industries. Ag nanospheres were synthesized by the chemical reduction of AgNO3 in the presence of mulberry leaf extract. Effects of pH and temperature in the synthesis were studied by TEM and the corresponding surface plasmon resonance was demonstrated via UV-Vis absorption spectra. The increase in AgNO3 concentration to 0.5 M resulted in mixed phases. The nanoparticle characterizations by UV-Vis spectra and TEM were complemented by smartphone colorimetry. After 10 months, the color corresponding to the change in nanoparticle size was quantitatively classified by the RGB, CIE L*a*b*, as well as chroma and hue angle. The CIE b* was a very effective parameter to distinguish these reddish-brown nanosuspensions.

