


 nueva página del texto (beta)
 Inglés (pdf)
 Artículo en XML
 Referencias del artículo
 Enviar artículo por email
 Citado por SciELO
  Similares en
SciELO
Similares en
SciELO 
 Permalink
1. Introduction
The success of a company requires that it explores opportunities for increasing financial results and sustains these results over time. Planning allows a balance between them to be reached (Cox & Schleier, 2013). Different decisions use different timescales to be effective, for example, the time needed to change a production line from product A to B is different from the time needed to build a new business unit. It is necessary, therefore, to provide tools to support decisions in both horizons: the long and the short-term (Lapide, 2014).
Short-term horizon decisions need to ensure clients satisfaction while keeping a company’s flexibility. The theory of constraints (TOC) is a well-known management philosophy focused on the role of a constraint in a company’s performance (Goldratt & Cox, 2002). It is recognized that TOC leads to significant results when applied to production and control planning. This can be seen in areas such as: increase in profit, throughput or net profit (39%), lead time (about 75%), cycle time reduction (66%), improvement in defect detection percentage and / or inventory (50%), and in financial performance (Mabin & Balderstone, 2003).
TOC can be applied in accounting, distribution, marketing, projects and other areas (Gupta et al., 2010; Souza, 2005). For example, throughput accounting (TA) questions the conventional way of allocating costs to establish the product unit cost. The conventional method suggests that all resources have the same function in generating throughput: a fallacy from the TOC point of view. The most important resource is the constraint, and it is the only resource which can limit the throughput. So, three basic measures are taken to support TOC decisions: inventory, operational expenses and throughput (Lockamy & Spencer, 1998; Mehra et al., 2005; Queiroz & Rentes, 2010; Rahman, 1998).
On the other hand, one of the most commonly used tools to support long-term horizon decisions is Sales and Operations Planning (S&OP). Its goal is to devise plans, for all functional areas (Manufacturing, Sales, Financial and others), that are consistent in two ways: horizontal (across the areas) and vertical (across the different levels of strategy - meaning that the strategic planning decisions taken must be deployed at the operational level). Thus, S&OP develops tactical strategies assuring the achievement of a company’s long-term objectives, based on coherent daily decision-making (Feng et al., 2008; Grimson & Pyke, 2007; Lapide, 2004, 2005; Noroozi & Wikner, 2017; Olhager, 2013; Thomé et al., 2012a, 2012b).
However, TOC posits that there is some room for improvement. Firstly, S&OP usually works with forecasts centered on mean numbers, which can narrow possibilities and fail to prepare the company for extreme situations, such as “what happens if everything goes wrong or if everything goes very well?” (Singh & Lee, 2013; Warren, 2012). Secondly, with justifications based on increases in resource efficiency and cost reduction, operations’ planning does not prevent high utilization levels for all resources, which can reduce shop floor flexibility, increase production lead time and hinder on-time delivery (Schragenheim, n.d.-b).
There are a few studies criticizing TOC for being applicable and effective only in short-term horizons and limited in supporting decision making and developing plans for longer-term horizons, such as those resulting from the S&OP process. Some of those studies had investigated the limitations of TOC application as a long-term decision support approach (Kee, 2008; Mehra et al., 2005; Sopariwala, 2003; Tsai et al., 2008; Watson et al., 2007), however they did not propose a TOC application for long-term horizons. Some studies have suggested applying TOC together with other methods, such as balanced scorecard (Gupta, 2012) and activity-based costing (Tsai et al., 2008; Cogan, 2003; Kee & Schmidt, 2000).
Recent studies leaded by Eli Schragenheim started to propose and illustrate how TOC can contribute to long-term planning (Schragenheim, n.d.-a, n.d.-b., 2012, Schragenheim et al., 2019), but studies that particularly attempt to identify the possible limitations and contributions of TOC within S&OP processes, is an area that remains to be explored further and no articles published approaching the relationship about these methods was found.
The question this article aims to answer to fill that gap is: how can TOC support decision making, in the context of long-term horizons, in particular, within the scope of S&OP processes? Therefore, the purpose of this research is to investigate how TOC, through its fundamental assumptions and recent developments, can support management decision making within the scope of S&OP processes. In addition, this paper also aims to propose a decision-making process based on some basic TOC principles, identifying similarities and differences in S&OP decision processes, between the approach guided by TOC and the conventional approach. Thus, the construction of a framework and a spreadsheet to test the proposal are expected as a result.
2. Research methodology
This is a theoretical research using the review method to establish how TOC has been approached in terms of long-term planning, especially aiming to identify proposals which integrate TOC in S&OP processes.
Based on the proposal made by Lage Jr. and Godinho Filho (2010) which has also been adopted by authors such as Jabbour (2013), Fiorini and Jabbour (2017) and Mariano et al. (2015), the current literature review was guided by the following five steps:
Step 1: Research for available articles published in journals from academic databases using predefined key words and with no predefined time limit;
Step 2: Filter research results through a reading of Abstracts, excluding those which are not related to the desired subject, duplicated articles and articles without an Abstract or author signed (Luiz et al., 2016). If this evaluation is considered insufficient, the result of this first filter should be analyzed again, this time sorting by a reading of introductions and conclusions;
Step 3: Develop and adopt a classification system;
Step 4: Present the literature review according to the classification above;
Step 5: Identify research opportunities.
The research was carried out using the Scopus and Web of Science database, with the following key words: (“theory of constraints” AND “long-term”) OR (“theory of constraints” AND “short term”) OR (“theory of constraints” AND “sales and operations planning”) OR (“theory of constraints” AND “operations planning”) OR (“TOC” AND “S&OP”) OR (“throughput account” AND “long-term”) OR (“throughput economics”), searched on field “Article title, Abstract, Keywords”.
The search results, a total of 45 articles, were collected in July 2020 - step 1. Articles not belonging to the research scope, the long-term application of TOC, were excluded, such as Lochner et al. (2003), Stratton and Knight (2010) and Macdonald (2013). After applying the filters, 13 articles remained (steps 3 and 4). Step 5 was completed consequently.
Based on this systematic literature review, the following session brings a discussion about how TOC has been applied in the context of S&OP process. Based on the insights provided by the literature and, in particular, the contributions allowed by Eli Schragenheim's texts and book, a framework to support a S&OP decision-making processes is proposed, resulting in the recommendation of a set of steps necessary to develop an aggregate production and sales plan. Also, a spreadsheet tool to support this process has been devised and a theoretical example of its application is shown.
3. The theory of constraints and its contributions to the sales and operations planning process
S&OP is a monthly-based process the main objective of which is to balance demand with supply. It is lead by senior management through multi-functional planning meetings intending to overcome interest conflicts across departments, and its output is the provision of tactical plans for each area (sales, manufacturing, development, financial and others). This set of integrated tactical plans supports the strategicbusiness plan (Feng et al., 2008; Noroozi & Wikner, 2017; Thomé et al., 2012a, 2012b).
Conventionally, the process has five steps: (i) Data collection, (ii) Sales planning, (iii) Production planning, (iv) Pre-executive S&OP meeting and (v) Executive S&OP meeting. The planning meetings usually work with a time horizon of between 12 and 18 months, and analyze the balance across sales, production and inventory/backlog plans (Grimson & Pyke, 2007; Lapide, 2004, 2005; Olhager, 2013).
Although S&OP is a widely-used mature model, some development opportunities have been identified by researchers, such as: how the S&OP process could face specific uncertainty variables and how it can be integrated into scenario analysis and ‘what-if’ analysis (Singh & Lee, 2013; Warren, 2012); the lack of analysis of product demand interdependencies, suggesting the translation of the results of the demand profile to capacity profiles (Nielsen et al., 2010). Some TOC concepts would helpfully fill these gaps, for example, considering the global impact of a decision on goal achievement, using metrics built to reflect a company’s given goal, and considering constraints when building a capacity profile aiming to keep or increase flexibility.
To better understand how TOC concepts have been applied to support long-term planning, such as those associated with Sales and Operations Planning (S&OP), the 13 articles resulting from the systematic literature review were analyzed. A summary of each article’s discussed, containing its title, author, year of publication and the field in which TOC was studied and applied is shown in Table 1.
Table 1 Summary of literature review (Continuation).
| Title | Author | Year | TOC Application | Research área |
| The enhanced make-or-buy decision: The fallacy of traditional cost accounting and the theory of constraints | Coman A., Ronen B. | 1995 | Throughput accounting | Make-or-buy decision and outsourcing |
| Theory of constraints approach for integrating operations/manufacturing strategy into strategic business planning | Draman, Rexford H., Cox III, James F. | 1998 | Constraints analyzing from a strategic point of view | Business plan development |
| Comparative analysis of utilizing activity-based costing and the theory of constraints for making product-mix decisions | Kee, R., Schmidt, C. | 2000 | Throughtput accounting | Production mix decisión |
| The impact of management accounting, product structure, product mix algorithm and planning horizon on manufacturing performance | Lea, B.-R, Fredendall, L.D. | 2002 | Throughtput accounting and TOC concepts | Production mix decisions and accountability |
| Selection of management accounting systems in just-in-time and theory of constraints-based manufacturing | Lea, B.-R, Min, H. | 2003 | Throughput accounting | Accountability and planning horizon |
| Long-term decision making using throughput accounting | Pretorius, P. | 2004 | Throughtput accounting | Costing methods |
| Selecting quality improvement projects and product mix together in manufacturing: An improvement of a theory of constraints-based approach by incorporating quality loss | Köksal, G. | 2004 | Throughtput accounting and TOC concepts | Quality Improvement projects |
| Management accounting in ERP integrated MRP and TOC environments | Lea, B. | 2007 | Throughput accounting | Costing methods |
| Managing strategic and tactical constraints in the hi-tech industry | Coman, A., Ronen, B. | 2007 | Long-term constraints | Investments |
| Enhanced throughputs in foundries by constraints-based planning methodology using a special ERP | Singh, V., Mani, V.G.S. | 2008 | TOC concepts | Software development planning methodology which considers constraints |
| Moving towards agility: the contribution of a modified balanced scorecard system | Gurd, B., Ifandoudas, P. | 2014 | Throughput accounting | Performance measurement through balanced scorecard |
| The iTLS model - Integration of theory of constraints, lean manufacturing and Six Sigma: A case study to best practice of operations at a value chain of a multinational in Brazil | Carlos, I.N.M, Cleto, M.G. | 2014 | TOC philosophy and Thinking processes | Lead time reduction at a value chain on long-term |
| A simultaneous mining and mineral processing optimization and sustainability evaluation prepared during a platinum project prefeasibility study | Burks, S.F. | 2016 | Global measures of performance | Alignment of operational and strategic objectives |
Kee and Schmidt (2000) recommended focusing on the impact of using throughput accounting (TA) or activity-based costing (ABC) on labor resources and expenditures during the desired time horizon, to choose the most suitable method for optimal mix decisions rather than assuming that one method is better for a time horizon.
Lea and Frendendall (2002) studied the relationship between product mix algorithms and accounting systems (TA, traditional or ABC) to figure out which of them performs best on short and long-term horizons. The conclusion was that all methods are consistent on both time horizons and can achieve good financial and non-financial results. Further, the TOC method can be used together with any costing method that mitigates bottlenecks.
On the other hand, Lea and Min (2003) suggested that the ABC costing method generates more profit in the short and long-term, provides better service level and lower work in progress than TA. These results are in agreement with those obtained in Lea (2007), which argues that traditional accounting literature suggests TA is appropriate for short-term decisions, when income and operation expense measures don’t change significantly, and ABC is suitable for long-term decisions. Findings suggest that ABC concepts can work effectively in a TOC environment, but TA leads to lower system performance by not attributing resource consumption to product cost.
Pretorius (2004) argues that TA leads to better performance in generating short-term gains, and the method used by TA was already in many traditional accounting books. However, it is not studied in real environments and few people know of its potential. Coman and Ronen (2007) also discuss the tactical role of TOC (which is recognized for its favorable results in several fields) and studied how to exploit the constraint in long-term horizons in order to attract shareholders.
Singh and Mani (2008) describe the methodology used by ERP software based on TOC concepts to generate production plans for short and / or long-term horizons, aiming to identify the constraint to meet the plan. Also, Carlos and Cleto (2014) used TOC concepts, principles and techniques, such as thinking process together with lean manufacturing and Six Sigma to reduce long-term value chain lead time through the elimination of constraints and waste, reducing variability in a household company.
Focusing on TOC performance measurement, Draman and Cox (1998) proposes to elaborate the business case looking at constraint analysis from a strategic perspective to leverage performance which should be measured using global KPIs (key performance indicators). Burks (2016) developed a framework based on TOC principles proposing global performance measures for a marine transport system, intending to align performance at operational to strategic levels, leading to optimal short- and long-term solutions. Gurd and Ifandoudas (2014) argues that the study of the Balanced Scorecard (BSC) financial indicator is not explored in the literature and proposed a management system which suggests that a strategic performance measurement system based on TOC can lead to better delivery speed performance as a long-term goal.
Application in Quality Improvement was also studied by Köksal (2004), who proposed an improvement based on TOC’s product mix algorithm, incorporating quality loss factors to better consider customer satisfaction in long- and short-term decisions.
Coman and Ronen (1995) brings an important discussion about how outsourcing can be an important tool when market demands exceeds the shop floor capacity, although they approached this opportunity only in short-term run. They used the famous P&Q example to demonstrate the enhanced way to take make-or-buy decision when considering outsourcing.
It is important to note that until the current moment, no application of TOC concepts in the S&OP process was identified as well as long-term application of TOC has been little discussed. The main focus of these works is the limitations of TA on supporting long-term decision making, along with the use of its overall performance measures. One also can note that, although the first discussions about the TA limitations date from years 1990’s, no recent articles approached the theme with proposals to overcome its weaknesses. Critically, there is a lack of studies investigating how to structure TOC concepts in a way that supports long-term sales and operations planning. This research opportunity was identified through the literature review and has been chosen as the purpose of this paper.
Further research was carried out using Google, which returned a number of Eli Schragenheim publications about the application of TOC in long-term planning. Schragenheim (2012) criticizes some TA assumptions, arguing that they are no longer suitable for long-term planning. He also discusses the limitations of other methods in supporting long-term decisions.
Eli Schragenheim is the author of “Management Dilemmas”, “Manufacturing at Warp Speed”, “Necessary but Not Sufficient” and “Supply Chain Management at Warp Speed”. He is an international TOC expert, having been primarily responsible for the development of the Simplified Drum-Buffer-Rope system. The following proposals are based on Eli Schragenheim’s recently published book Throughput Economics: Making good management decisions (Schragenheim et al., 2019), texts published on his blog (Schragenheim, n.d.-a, n.d.-b) and a presentation by him at the TOCICO Congress in 2012 (Schragenheim, 2012).
The following proposal aims to help managers take good decisions, despite inherent environmental uncertainty, thus making them feel more confident about the context and possible results of a decision. One of its applications is in manufacturing environments, with the objective of supporting product mix decisions and long-term capacity management (Schragenheim et al., 2019).
During the decision-making process, the questions to be answered are (Schragenheim et al., 2019): will accepting certain business opportunities increase a company’s net profit? Analyzing the impact of the long-term horizon, what positive and negative consequences may arise? Is there any risk of constraint or bottleneck interaction? Also, has the company enough capacity to deliver the additional orders?
All these considerations are studied based on financial metrics proposed by throughput accounting: throughput (T), the rate in which units of organizational goal are generated, in the case of enterprises, money; Inventory (I), the money allocated in every resource the enterprise can sell, such as buildings, equipment, machines and tools; and operating expenses (OE), all the money used to transform inventory into throughput, such as salaries and utilities (Mehra et al., 2005).
Some characteristics of long-term planning can make capacity management critical. In long-term plans, it is difficult to make decisions when having to meet available capacity with long-term demands, in a scenario where demand exceeds capacity, while maintaining a system’s protective capacity. Another point is that capacity is purchased in minimum amounts. This means that it may be possible to purchase extra capacity quickly, paying a certain price, or it may just be impossible to add some amount of capacity because its cost would be unfeasible (Schragenheim et al., 2019).
And there is a third situation: where a company already has available capacity to add some tasks on the top of current activities, without necessitating purchase. The conclusion is that capacity cost is not linear, as opposed to cost per unit used in traditional cost accounting (Schragenheim, n.d.-b, 2019).
Considering the financial impact of the first case, an ΔOE that needs to be compared with ΔT would be generated. In the second case, no decision should be taken, so, nothing changes. In the third case, the ΔT generated goes straight to the bottom line, since there is no add on OE (Schragenheim et al., 2019).
Another critical point of managing capacity in the long-term is how to keep protective or excess capacity in the system. It is impossible to consume total system capacity without generating significant problems on the shop floor and leaving clients dissatisfied because of a company’s failure to deliver its products (Schragenheim, n.d.-b, 2019).
Schragenheim (2012) and Schragenheim et al. (2019) discuss the limitations of TA to deal with long-term decisions. In short-term decisions, a criterion used to analyze what opportunity should be taken is the T/cu (throughput per constraint unit rate), but there are some premises which cannot be ignored when using T/cu. First of all, to make t/cu applicable, there must be one capacity constraint resource (CCR) active (or bottleneck), in other words, when the demand is higher than a resource can process - which normally happens during peak times. Thus, if there are CCRs but they are not active, then T/cu cannot be applied. And if a company has ways to quickly purchase capacity, the CCR may not be active, which implies not using T/cu as a criterion.
Limitations also involve not considering the possibility of CCR interaction, or emerging new ones, as a long-term consequence of the additional production load from a given order. Because it supports decisions that are restricted to the short term, TA nowadays does not have mechanisms to protect against system variability, which in the long run is inevitable and must be prepared, especially when considering the uncertainties inherent in demand (Schragenheim et al., 2019).
To support a decision-making process based on TOC, Schragenheim (2012) and Schragenheim et al. (2019) propose the use of new elements:
A set of potential CCRs including current CCRs and the resources that may become constraints in a long-term run, depending on the market opportunities;
Capacity buffer: the ways a company can purchase extra capacity quickly without investing large amounts of money, although paying a premium price to acquire it. Its role is to ensure the shop floor flexibility and protective capacity of the system;
Sales Profile: expected sales and demands aggregated by t-generator families in a time bucket.
Capacity Profile: the current resources load compared with the total capacity required to produce a sales profile;
‘What if’ scenarios: to build reasonable (meaning that a very rare catastrophic situation should be ignored), optimistic and pessimistic scenarios so that planning is not based on an average value. Their function is to handle inherent uncertainty by combining potential decisions with the activities the organization is currently doing. These scenarios should also translate the intuition of managers, regarding their decisions, into numbers or logic.
One differential of the proposal is the use of three different types of information: hard data, accurate numbers or facts that can have an impact on the decision; intuitive assumptions about reality; and an assessment of uncertainty and risk. In most cases the intuition is about right, notably when the person who is the source of such intuition has experience in the area being discussed. Besides, intuition balances the lack of sufficient relevant and reliable hard data and should be translated into logical rules and/or numbers using ‘what if’ scenarios (Schragenheim et al., 2019).
The goal is to analyze what happens to financial results, if new business opportunities are taken, by analyzing the impact of adding orders/load to current sales and capacity profiles. Estimating the range variation on T and OE, caused by the opportunity, helps managers to feel more confident about decision-making. The proposal also clarifies the state of capacity within the planning horizon, verifying if the system has enough protective capacity to deliver all orders. This means that if a new business decision reaches its utilization limit, a company may choose some alternatives, such as rejecting new business, using strategies to control demand behavior, and using capacity management or purchasing strategies, either in the form of inventory or buffer. All these possibilities may be analyzed through ‘what if’ scenarios (Schragenheim et al., 2019).
4. Results
Based on the literature review, this article aims to propose a framework to suggest a sales and operations planning process which incorporates TOC concepts. This framework proposal (Figure 1) has five steps:

1. To gather data:
In this step, all necessary data is brought together. Important metrics are the latest manufacturing and financial performance. The analysis that will be done during the process is how changes on these metrics are going to impact ROI (return on investment) and NP (net profit).
Also, the difference between the t-generators and products must be identified. One product is a production result and one t-generator is a sales unit. With this difference clear, a reference table is prepared to support decisions and ensure that all managers are talking about the same thing during a meeting.
A list of all opportunities, no matter its potential, is necessary for the process. These opportunities can be directed to new manufacturing or sales strategies, or even to break into a new market or launch new products.
Besides, the capacity buffer should be known in order to keep the enterprise’s flexibility in terms of the need for rapid capacity purchase, which may involve paying a certain price, though. Managing this buffer also is required, because the more it is used, the more sales and deliveries are threatened. Another important point is the CCR set. This set consists of all the currently active CCRs, together with those which have the potential to become one, depending on the additional load charged by a new opportunity. In comparison to conventional S&OP process, important elements were added to be checked out, such as capacity buffer, the CCR set, the concept of t-generator, always in addition to the use of financial metrices based on TA.
2. Sales profile
The sales profile consists of an aggregated plan of t-generators for the planning period. Here, the families of t-generators are defined together with the sales share for each. There are two kinds of plans: the optimistic and the pessimistic. The optimistic plan considers a high client demand for a product, meaning there are more sales and thus more generated throughput can be expected. A pessimistic scenario is when the forecast is not so good, meaning the demand is lower and, hence, so is the generated throughput. Both plans may be done without considering manufacturing constraints.
In this proposal, scenario analysis is used, replacing a demand forecast based on a singular value expected, usually the mean of past performances, as it would be in conventional S&OP process (Singh & lee, 2013; Warren, 2012). Such scenario analysis better reflects managers' intuition, increasing their confidence in making decisions, since they are expecting a range of possibilities and are conscious about the risks involved. Besides, scenarios handle better the variability inherent to demand and future (Schragenheim, n.d.-b).
3. Capacity Profile
Knowing the forecast for sales, it is possible to plan the manufacturing process. In terms of operations, the most important point is to plan equipment load during the period (for both current and potential CCRs). Another view is to set a red line. A red line is a limit percentage for equipment load. When load reaches the red line, it means the system is consuming its protective capacity.
Two main differences in comparison to conventional S&OP process can be pointed out. First, the concept of analyzing the constraints is not widely used in long-term planning, nor is it specifically in S&OP conventional process. Second, the concept of setting a limit to utilization level (red line) and keeping the system’s protective capacity are not coverded by conventional S&OP, since it usually focus on the conflict between keep high asset utilization, and probably losing some clients, and the costs of idle capacity (Hahn & Kuhn, 2012; Olhager, 2001).
4. Strategic meeting
During a strategic meeting, the opportunities listed, and their consequences are analyzed one by one from financial, manufacturing and sales points of view. At least the managers of these departments must attend this meeting. The ideal would be that all department managers and perhaps key clients and suppliers attend. Using the current sales and capacity profiles attendees can understand what changes are going to happen by accepting or denying an opportunity. A decision is made by simulating the load and the throughput in pessimistic and optimistic scenarios, highlighting capacity buffer behavior.
If the bottom line (ROI and NP calculated as a function of variations in T, OE and I) are positives or propitious in both scenarios (optimistic and pessimistic), then the opportunity can be accepted and, month by month during the planning period, the strategy of manufacturing, sales and financial departments can be defined as well as all functional areas, resulting in aggregated plans for the enterprise. On the other hand, if the bottom line is negative in both scenarios, the opportunity should be denied. However, if in one scenario the result is positive and in the other negative, the decision depends on how much the enterprise can take the risk.
This step is the most important contribution of the framework: the way managers take their decision. With this proposal, they are much more prepared because they may consider the market and manufacturing constraints, pessimistic and optimistic scenarios, and the impact of their decisions on the bottom line. Besides, they can have all this information quickly using a tool to support their decision.
5.Critical Revision of the process
At the end of the process, the suggestion is to go over the process again and pick up which kinds of actions are relevant for the process and those that can be improved. This step aims to ensure continuous improvement.
A workbook tool was also developed, to support decision making using the above framework. To test the proposal, the case for a company called “Politron” - extracted from Corrêa et al. (n.d.) - was adapted to illustrate the framework and tool use. Politron’s case originally sets a goal to simulate factory operations, allowing the students to take decisions within the period chosen using the S&OP, MRP (Material Requirement Planning) and MRP II logics. It was practicable to use an existing case, avoiding the necessity of starting from the scratch. However, because the logic behind this case isn’t a TOC view, it was necessary to modify some, and invent other, data.
4.1. The case of Politron
This session aims to illustrate the use of the framework proposed. Because of space limitations, only part of the conceptual framework is reflected in the spreadsheet shown below.
Politron is a remote terminasl and printed circuit boards enterprise. The target for the coming year is to increase its market share of remote terminals for its data entry business, by producing in high volume and using national advertising. Currently, Politron markets two products lines: A and P. Product family A has two lines: A1 and A2, which are sold to fast food restaurants and small convenience stores. Product family P has three versions: P3, P4 and P5.
They are sold to manufacturing companies or wholesalers to assist with stock control.
The sales of products A and P increase when holidays or vacations are coming up. Companies or stores generally buy them two months before these periods arrive, so that when the number of clients increases, they will have flexibility and velocity to meet the demand. The prices of A1, A2, P3, P4 and P5 are: 2.000, 4.000, 2.500, 5.200 and 6.000, respectively.
The leadership wants to launch a new t-generator family, with similar technology to “Amazon Go”, in order to take the edge from its competitors. “Amazon Go” technology is known in Politron as “Go Technology”. It is a piece of equipment which allows customers to pick up the items they want to buy and just leave the store, without checkout stations. As long as the customer walks into the store and picks up items, sensors are capable of identifying the item, its price and the client profile, to add it on his package.
To understand how this idea would impact the business, the leadership called managers to a meeting. The meeting’s objective was to discuss the feasibility of marketing a new t-generator family called TG. The project and engineering teams aligned with the marketing team to prepare some information necessary for the meeting, such as what t-generators should be included in the TG family. Marketing team then explained that, for a while, the t-generator TG family should contain only one t-generator (TG1).
TG1 is a package with a turnstile, sensors, cameras and software developed with a partner. Then, the project and engineering teams could understand that sensors, cameras and software are bought parts, but the turnstile would be manufactured by Politron. So, the turnstile is a product (a manufacturing output) called G1.
Figure 2 shows the TG1 structure. Production route of t-generators A, P and TG1 is shown on Figure 3.


4.1.1. The meeting
The meeting is guided by the proposed framework (Figure 1) and supported by the workbook, which contains different spreadsheets: Optimistic Scenario, Pessimistic Scenario, Scenario Analysis, Production Module, Finance Module, Product Structure and Price of Components. The decision-making worksheets are the “Optimistic Scenario”, “Pessimistic Scenario” and “Scenario Analysis”, while the others are used to feed them.
Because of the current article’s size limitations, the figures shown refer to the Optimistic Scenario only. However, the same information was studied for the Pessimistic Scenario. In addition, the reader should not worry about the numbers presented in the figures, as their intention is to give the reader visual idea of the tool.
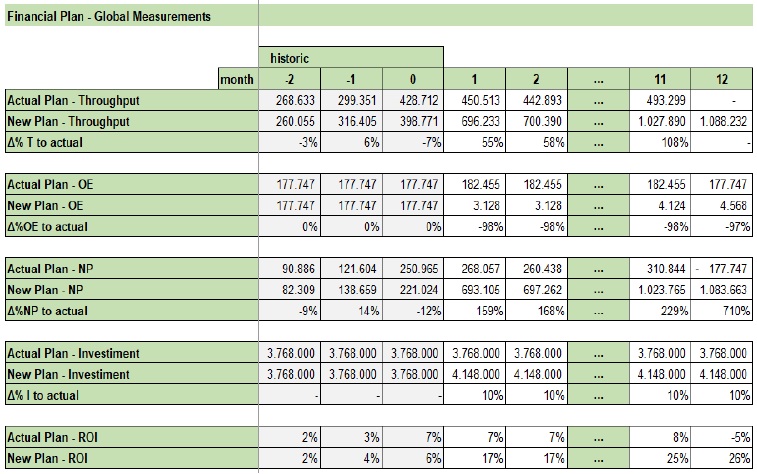
First Step - To gather data:
1.1 Actual state of throughput, inventory and operating expenses
This information is available on both “Optimistic Scenario” and “Pessimistic Scenario” modules at the end of the spreadsheet in the section “Financial Plan - Global measurements”. Financial Plan (Figure 4) includes all financial calculations generated by plans: T, OE, I and their variations for both the current and new plan. It is also possible to calculate ROI and net profit NP. These calculations are global, so they demonstrate the financial impact of all the decisions simulated. The historical data contains three months, so month “0” represents the last month’s performance. The meeting will forecast results from months 1 to 12.
1.2 T-generators and product families and what is the percentage of each product in each family, month by month:
The proposal is to market three t-generator families: A for fast-foods, P for shop floors and wholesalers, and TG - the new family with “Go Technology” - for retailers. For A and P t-generators families, the final product output is sold from manufacturing. But, the TG product family is different. The new t-generator line is made by the t-generator TG1, which contains the product G1 and bought parts. The percentage of each product in each Family is shown in module “Production module” (Figure 6). The same values were adopted for months and scenarios, but it could vary depending on the analysis.


1.3 Relationship table t-generators x products:
This is necessary to make sure that sales and manufacturing managers are discussing the same product. This relationship is shown in Table 2.
Table 2 Relationship between t-generators and product families.
| Family 1 | Family 2 | Family 3 | |
| T-generator(s) | A | P | TG1 |
| Product(s) | A | P | G1 |
1.4 Performance during the last period
During the last period, Politron’s performance goal was:
Performance closer to the optimistic scenario;
Strategy to manufacture product line A: to keep the manufacturing level as constant as possible;
Strategy to manufacture product line P: to have two levels of production driven by demand;
No use of the Capacity Buffer.
Net profit around 55% of throughput and an ROI of 6%.
1.5 What are the opportunities?
The opportunity is to market a new t-generator called TG1 which aims to help clients to be more independent in their purchases.
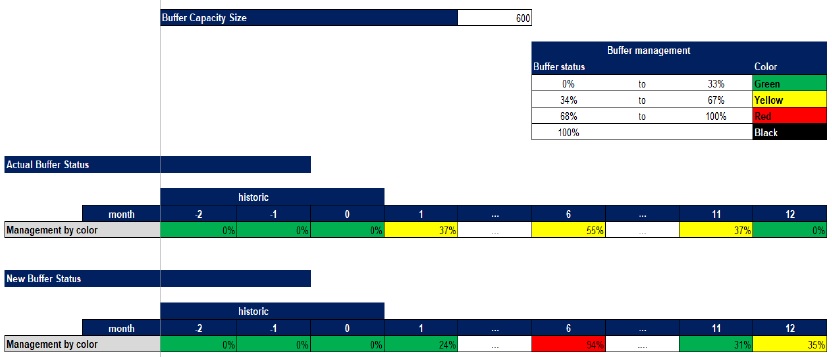
1.6 Capacity Buffer:
The capacity buffer’s size is the sum of three quick purchasing capacity possibilities: extra hours (maximum of 400 hours within a month), an extra shift (maximum of 160 hours/month) and outsourcing (40 hours/month), totaling 600 hours. An extra hour costs 18, one extra shift costs 900 and one hour of outsourcing costs 30.
1.7 Group of resources that already are, or can become, a CCR:
This information is available for both the “Optimistic Scenario” and “Pessimistic Scenario” in the “Capacity Profile” section - it will be shown in more details soon. Two operations are potential CCRs: CPU subassembly and drilling activities.
1.8 Which rate is expected to vary throughput and operational expenses between the scenarios?
A variation of 30% is expected between the pessimistic and optimistic scenarios.
Second step - Sales profile:
2.1 Elaborate an aggregated forecast of sales for t-generator families during the time bucket;
2.2 Analyze the latest performance and what the future expectation is;
2.3 Accept that no additional action will be taken; in other words, the enterprise will behave the same way during the time bucket as it did during the last month.
In this step, the team starts to work with two scenarios and tool modules: optimistic and pessimistic. These modules are the worksheets used to study the opportunities and the effects that decisions will have in the long-term. At the beginning of the spreadsheet are two text boxes. One box refers to the business opportunities that will be discussed during the meeting, for example: launching a new product family, exporting, increasing market share or just improving performance.
The other text box briefly describes some characteristics of analyzing impacts on the optimistic scenario, such as: it is considered that the business opportunity will lead to higher sales, minimal extra capacity should be purchased (low utilization of capacity buffer), maximum throughput generated, a lower increase in operating expenses and, consequently, an increase in net profit.
For each product family, two plans are developed: the sales and production plans and, consequently, the inventory plan is obtained. At the end of each family plan there are graphs illustrating the behavior of the current plan and the new plan, making it easier to analyze the differences between them. Figure 5 shows the user interface with the Optimistic Scenario worksheet. For each t-generator / product family, a section is developed as illustrated in Figure 5.
The Optimistic and Pessimistic modules start to be fed through the sales plan (Figure 5). According to market research, in an optimistic scenario a gradual increase in sales of TG1 is expected, starting at 90 units (u) and being almost the double at the end of time bucket, while the sales of t-generators A and P may decrease around 5% during the next months. The slight reduction in sales of A and P is due to the fact that small enterprises starting their businesses will purchase traditional remote terminals because of their lower price and risk.
In a pessimistic scenario, the new t-generator will not be accepted by the market, so during the first month a peak in its sales is expected, thereafter decreasing significantly every month, reaching 30 units during the last month of the time bucket. Besides, sales of t-generators A and P will decrease 10%. In this case, smaller companies are still not convinced, and the sales of TG1 refer to consolidated players that can take the risk of a new opportunity. In this scenario, initial period, t-generator sales would continue until reaching maturity, the point when big companies have already adopted this technology and now sales are beginning to decrease.
Third step - Capacity profile:
3.1 What is the red line to protective capacity?
The managerial decision was to keep 15% of protective capacity in all resources, so the red line is 85% of utilization.
3.2 Considering the actual amount of sales without the new opportunity, how much of CCR’s group capacity is already in use?
To answer this question, the “Production Module” is used. The first information available is a table of product families, showing the share of each product, month by month. In cases where the item share changes monthly over the time horizon, it is possible to set capacity and make the right calculations.
The table also contains set-up and processing times, and theoretical and real available capacity calculations, considering machines, equipment and human resources. Real available capacity depends on the efficiency ratio, i.e., the percentage of theoretical capacity that will be wasted on variability, and the scrap rate for each operation. Figure 6 illustrates the participation chart of each product, in each family, month by month, and the tables with time and capacity.
The resources utilization profile shows the load that is already committed to each. Then, the concept of red line is given. Red line is a usage limit, so if a resource is being used more than its red line, it is consuming its protective capacity zone which may decrease throughput, leading to the possibility of not meeting the demand. See Figure 7.

Considering the strategies adopted in the sales, production and inventory plans, it is possible to analyze the CCR set, those resources that are already CCR active and those that may behave in such a way in the future. This resource set is usually responsible for the costs of capacity buffer utilization. In the spreadsheet, when a resource reaches the red line its cell is colored red for easy identification. For the same purpose, graphics were created, making it easier to view load throughout the time bucket (Figure 7).
Thus, the more red-colored cells a resource has, the more overloaded it is, and therefore it is closer to becoming a CCR. These critical resources are the CCRs set that build the capacity profile. Capacity profile is then available in the “Optimistic Scenario” and “Pessimistic Scenario” worksheets in order to discuss capacity issues in long-term decision making.
The actual capacity profile (Figure 8) is the sum of the hours needed to produce product families A and P. Adding the new product G implies also adding two operations: assembly line G and assembly line TG1. This results in hiring four people, two for each line. adding two operations: assembly line G and assembly line TG1.

Fourth Step - Executive meeting:
4.1 What happens if the opportunity is accepted in an optimistic and pessimistic scenario? What is the throughput and operation expenses variation implied by the opportunity? If the balance is positive in both scenarios (or even in one and considered worth the risk), the opportunity must be accepted. Otherwise, it must be rejected. It is important to consider the impact on sales of already existing market families.
4.2 If, in analyzing all these points, the answer is that the opportunity is worthwhile, how would the amount of sales impact on the capacity profile? Would it exceed the red line? If yes, how would this situation be managed?
4.2.1 Purchase more capacity;
4.2.2 Manage the demand;
4.3 And how about the impact on manufacturing strategy? How much stock is desirable? How many products will be produced month by month?
4.4 Result expected: aggregated plans for each department in conformance with decisions taken.
4.5 Define metrics.
With the sales and capacity profiles, a forecast was made for the “new plan”. The Sales department was responsible for producing an aggregated forecast for t-generator families A, P and TG1. In an optimistic scenario, in which healthy sales of t-generator A, P and TG are expected, sales should vary between 80 to 90 units, 100 to 140 units and 85 to 170 units, respectively, considering a time bucket of 12 months. In a pessimistic scenario, for the same order, sales should vary between 40 to 55, 60 to 80 and 60 to 100 units, respectively.
Based on these forecasts, the production manager can analyze the impact on availability of the CCRs group. The new CCRs group is formed by assembly line A, P and G, sub assembly CPU and INP and the drilling operation. Using the capacity profile, it is possible to manage the capacity buffer status during the time bucket.
To know the capacity buffer status, it is necessary to calculate how much resource utilization has exceeded the red line, multiply the value obtained by the buffer size and divide it by the buffer size. Then, if the utilization is between 0 and 33%, its color is green, between 34 and 67%, yellow, and between 68 and 100%, red. More than 100%, the color is black. When the color is green, it means the client will be well satisfied, yellow means a warning status, the order needs attention, red means that nearly all resources were used, and the order may not be delivered on time. If the buffer status reaches black, then it is no longer possible to purchase extra capacity quickly and the order would not be delivered as expected.
Knowing the capacity buffer status, month by month, over the next 12 months, allows the company to know the impact on OE by purchasing extra capacity and analyzing if it pays off to invest in capacity or keep using the buffer.
If along the time horizon the buffer status is frequently yellow, a change in manufacturing strategy should be considered, for example, carrying stock costs or at least, preparing an investment plan on capacity (because it will be needed soon). On the other hand, if most cells are red it means the company doesn’t have capacity to meet all orders and therefore it is necessary to adapt the shop floor in terms of capacity, for example by acquiring equipment or machines or hiring new employees.
Lastly, if green is the most frequently color, then the company may figure out how to increase sales and better use the available capacity.
In the pessimistic scenario, there are no active CCRs and it is not necessary to use the capacity buffer., In the optimistic scenario, the 6th month is red because the sales profile had underestimated the seasonality rate, generating a peak on production to keep a reasonable stock level and meet the demand over the next months. About 25% of the capacity buffer is needed, keeping these months in red. Although hiring four employees, the capacity buffer size was not increased, keeping it at 600 hours. Figure 9 illustrates buffer management, and the costs associated with capacity buffer consumption are shown in the “Financial Module”, Figure 10.

The manufacturing strategy for product families A and P didn’t change. For product family G, the strategy adopted was to keep up with the demand - because of the uncertainty, since it is part of a new t-generator and stocking it is also undesirable - rather than pay for purchase capacity quickly.
With the sales and capacity profiles on hand, the financial department analyzed both scenarios during the time bucket. The value of investment needed for the new equipment for assembly line TG1, besides the increase in operational expenses on account of hiring and the capacity buffer, was added to the forecast. These values are shown in the “Financial Module” (Figure 11).

In the optimistic scenario, compared to the actual plan, the new plan generates 55% more throughput, about 25% more operational expenses, a minimum increase of 222% in net profit, a 10% increase in inventory and an ROI reaching 12%. In the pessimistic scenario, the new plan generates 85% more throughput, about 27% more operational expenses, a minimum increase of 202% in net profit, a 10% increase in inventory and an ROI reaching 12%.
Considering these numbers, the new product family should be launched. This decision is due to the positive balance in both scenarios. Operational expenses varied within expected values, and throughput performed better than expected. In both scenarios, the new plan’s bottom line is better than the actual plan (Figure 11).
Fifth Step - Critical Revision:
5.1 What difficulties were encountered during the process?
5.2 How could the process be improved?
5.3 Has some information been missed?
5.4 Could the process be leaner?
No difficulties were encountered during the process; all the information needed was on hand. The spreadsheet was capable of supporting the decision taken and made financial impacts easier to analyze.
Meeting summary:
Operational expenses varied 30% between actual and new plan, as expected. In the optimistic scenario, net profit is 150% better than the pessimistic scenario, although in the pessimistic scenario net profit is 205% better than actual plan;
In the optimistic scenario, the capacity buffer is low charged, which generates low operational expense, keeping the color green, with the exception of the first month;
Strategies adopted were to keep manufacturing levels constant, to set two manufacturing levels and to keep up with the demand to families A, P and G, respectively;
Four employees were hired;
A new machine to package t-generator TG1 was purchased.
5. Discussion
This research developed a tool based on a proposed framework to support long-term decision-making as a sales and operations planning (S&OP) process according to TOC philosophy and principles. There are several differences between a tool to support traditional sales and operations planning processes and the one proposed.
One of its main contributions is to propose a new way of managing capacity in the long-term. While S&OP allows high-level resource utilization in its plan (Feng et al., 2008; Grimson & Pyke, 2007; Olhager, 2013; Wallace & Stahl, 2004), the TOC-based approach keeps the protective capacity of the system, wholly necessary to dampen the uncertainty inherent with long-term. Two new key concepts were integrated into the process: red line and capacity buffer management. Using
these tools in the long-term enables a company to be ready and aware of when and how much capacity will be needed. Therefore, it can protect both sales and client satisfaction by assuring that enough capacity will be available. And if there is no way to do that, at least, a company has time to manage the situation. These parameters increase flexibility.
Besides, the TOC-based approach recommends working with ‘what-if’ scenarios, which help to make better decisions because a company is not expecting just one event (the mean forecast) (Feng et al., 2008; Lapide, 2004) and when there are surprises, a company and its people are ready for every outcome arising from a range of possibilities. So, a company’s employees can work more confidently and have better numbers to work with. It is also possible to increase top leadership accountability, supplying the meeting with intuition-based information.
Using the concept of the t-generator family is also a main contribution and differs from the conventional S&OP process. T-generators increase the possibilities of what to sell. Enterprises can use this concept to better know their clients and to boost sales. And it is also important to use this concept in the long term because it directly impacts the capacity management. Deploying sales profile to capacity profile and analyzing both in ‘what-if’ scenarios, also contributes towards filling some gaps identified in S&OP literature review analysis (Nielsen et al., 2010; Singh & Lee, 2013; Warren, 2012).
Aiming to highlight the differences or contributions of the tool proposed, further comparisons between TOC and the conventional S&OP process (Feng et al., 2008; Grimson & Pyke, 2007; Lapide, 2004, 2005; Noroozi & Wikner, 2017; Olhager, 2013; Thomé et al., 2012a, 2012b) are given in Table 3.
Table 3 Comparing the conventional S&OP process with the TOC-based approach.
| Sales and Operations Planning (S&OP) | ||
| Parameter | Conventional process (Feng et al, 2008; Grimson & Pyke, 2007; Lapide, 2004, 2005; Noroozi & Wikner, 2017; Olhager, 2013; Thomé et al, 2012a, 2012b) | TOC-based process (Schragenheim, n.d.-a., n.d.-b, 2012, Schragenheim et al., 2019) |
| Time bucket | Between 12 and 18 months | Between 12 and 18 months |
| Attendees | All top leadership or, at least, directors from sales and manufacturing. | All leadership or, at least, directors from sales and manufacturing. |
| Meetings frequency | Monthly | Monthly |
| Sales forecast | Aggregated by products family | Aggregated by t-generators family |
| Product | It means all that the company offers to the market | It means an output from the manufacturing process |
| T-generator | Inexistent concept | It means what the company sells in the market and can be the same as the product or not. T-generators are measured in financial units. |
| Time fence | Usually it is the highest sum of the parts' lead times | It is the same size as the production buffer |
| Inventory | It is a consequence of the difference between production and sales | Target inventory level: important tool management in MTA environment |
| Capacity profile | Inexistent concept | Resource utilization profile of CCR's or that may be depends on the opportunity analyzed |
| Capacity buffer | Inexistent concept | Capacity reserve for immediate use. Management of consumption is done by color. Excessive consumption denotes risks of not meeting immediate delivery commitments |
| Redline | Inexistent concept | It is the limit percentage of equipment load intending to keep a systems' protective capacity in long-term |
| Resources utilization | The plan allows for a high utilization of resources (99 to 100%). | It is restricted to the red line. Over the red line, capacity buffer is used |
| Capacity management | Actual overload is only identified in shorter time horizons There are no recommended ways of rapidly increasing available capacity. | Production and sales calculations and redesigns to solve overload capacity problems. It clearly defines the quick sources of extra capacity (capacity buffer) as well as the costs associated with using them. |
| Focus on | Integrating aggregated plans of all departments | Integrating aggregated plans of all departments so that sales increase and generate a positive impact on global financial measures |
| Decision parameter | Global financial impact | Global financial impact |
| Financial measurements |
|
|
| Bottom line forecast | It is focused on means | It works with a range of values in the optimistic and pessimistic scenarios. |
| Constraints | Planning is done for resources considered critical | It considers a group of CCR or potential CCRs, taking into account that variability and interdependencies reduce the effective capacity available. |
| Process |
|
|
It is possible to conclude that the tool developed satisfies the need to test these parameters from Table 3, as if it were capable of building new scenarios quickly to better analyze the consequences in terms of capacity and product mix, and be able to make decisions considering the expected financial results. This capability was illustrated satisfactorily by the Politron case.
Besides being a proposal for a tool to support the S&OP process guided by TOC concepts, its use has important implications in terms of data preparation, and for understanding new concepts and their practical effects, such as: to suggest new ways to manage capacity, to collect data about available capacity in manufacturing (capacity profile and buffer), to make accounting and financial calculations, and to analyze data and information from sales forecasts.
Back to the article’s question - “how can TOC support decision making, in the context of long-term horizons, in particular, within the scope of S&OP processes?” -, for the point of view of practitioners, it is possible to conclude that including TOC concepts in a long-term planning contributes by effectively considering current and future constraints, by exploring managerial intuition in generating possible scenarios, by making explicit and managing its buffers, and by supporting managers about when and how acquire capacity. Also, supported by a spreadsheet tool and by the new elements coming from TOC, the scenarios analysis facilitates understanding of the range of consequences from business opportunities. Such advances allowed for the S&OP process increase the enterprise’s flexibility and its ability to react quickly to changes.
From academic point of view, this research has a high pioneering power in expanding the knowledge base of S&OP processes and applications of TOC, in general, and throughput accounting, in particular, for long term planning. Therefore, with a strictly exploratory approach, the article fulfills the identified gap by proposing applications of TOC in long-term planning, especially in the scope of Sales and Operations Planning, without having to be supported by other methods, as suggested by the literature presented in Section 3.
6. Conclusion
The theory of constraints (TOC) is a management philosophy with well-known positive results. However, much has been discussed about its limitations in supporting decisions that are characteristic of long-term planning (Kee, 2008; Watson et al., 2007; Mehra et al., 2005; Sopariwala, 2003; Tsai et al., 2008). Thus, the objective of this research was to identify, based on the literature, the possible contributions and limitations of TOC when applied to long-term sales and operations planning, more specifically with regard to the S&OP process through the construction of a framework and a tool, developed on Excel, that integrates the concepts present in that framework.
Once developed, the tool was tested and adjusted upon application in a fictitious situation inspired by the POLITRON case study (Corrêa et al., n.d.). Such an application allowed several perceptions, such as:
Even in simple situations, such as the case used for illustration, new data and concepts become frequently necessary when the TOC perspective is introduced.
The conceptual interpretations and adaptations in relation to the conventional S&OP process brought several difficulties when incorporating the data from the original case study into the tool environment. Real practical situations will likely bring even greater difficulties, which can be seen as obstacles to overcome for its correct use.
The tool proposed is, therefore, the implementation, in spreadsheet form, of a new way of taking decisions in the scope of sales and operations planning, summarized and presented in Table 3. This Framework helps to briefly understand the main differences between approaches, as well as highlighting several new concepts derived from TOC. Thus, since a framework to guide an S&OP process based on TOC and a tool to illustrate its application were proposed, it is concluded that the goal set for this research was satisfactorily met.
One limitation of this research is that both the framework and the support tool was not tried in a real case, hence the recommendation for further research is to analyze the feasibility of implementing this new style of process and validate the results in a practical way. Future research could also design and evaluate the framework and the spreadsheet tool from a Design Science Research methodology perspective, which fits the development of technologies aimed at management problems relevant to the operations management field of knowledge (Lacerda et al., 2013).

