


 nova página do texto(beta)
 Inglês (pdf)
 Artigo em XML
 Referências do artigo
 Enviar este artigo por email
 Citado por SciELO
  Similares em
SciELO
Similares em
SciELO 
 Permalink
1. Introduction
The optical limiting phenomenon (OL) is one of the most studied optical applications today, because its main application is the protection of optical sensors. Many photonic sensors, such as a human eye, have an intensity of damage. However, the use of an optical limiter can extend the working range of the sensor (Al-Saidi & Abdulkareem, 2016; Balaji, Rekha, & Ramalingam, 2011; Mghames, Badran, & Hussain, 2018). Currently, most studies are focused on the search for materials that shows high values of the nonlinear refractive index (n2) and the non-linear absorption coefficient (β), due to its great applicability in the field of optics and photonics. With the advances in laser technology and the use of the pulsed regime, intensities much greater than with continuous laser sources have been achieved. Because of this, the optical and optoelectronic dispositive are used simultaneously with devices such as optical limiters and optical switches (Li et al., 2008; Shirk, 2000). An optical limiter is a device that manifests a transmittance dependent on the incident intensity. Ideally, the transmittance of these devices decreases as the intensity increases, so this will keep the transmittance below a specific value, independent of the input power. This phenomenon can be generated or derived from various nonlinear second and third order optical phenomena, such as multiphoton absorption, reverse saturable absorption (Li et al., 2008) and saturable absorption (Tutt & Boggess, 1993), and also by refractive effects (Kerr effect) (Krauss & Wise, 1994). OL is a non-linear optical phenomenon that generally occurs in materials that manifest large third-order optical nonlinearities (Mghames et al., 2018; Rashidian, Dorranian, Darani, Saghafi, & Ghoranneviss 2009). Among the materials reported in previous studies of the optical limiting effect, such as dyes (Al-Saidi & Abdulkareem, 2016; Balaji et al., 2011; Krishnamurthy & Alkondan, 2010), carbon nanotubes (Chin et al., 2006), graphene oxide (Zheng, Feng, & Zhan, 2013), among others. Some of the potentially applicative materials in optical devices are oils of vegetable origin, which are organic materials and also manifest great optical nonlinearities; due to its electronic structure and molecular geometry (Bredas, Adant, Tackx, Persoons, & Pierce, 1994; Dixit, Guo, & Mazumdar, 1991; Marbello, Valbuena, & Racedo, 2019). In the present work, the behavior and performance of two vegetable type oils, extra virgin olive oil (EVOO) and virgin avocado oil (VAVO) were analyzed, as devices of optical limiting by dispersion (originated by the Kerr Effect), reporting the OL threshold of each samples using a wavelength of 532 nm. These materials were chosen due to its high nonlinear optical response, manifested when they were studied by means of the Z-scan technique (Marbello et al., 2019; Marbello, Valbuena, & Racedo, 2020).
2. Materials and methods
Vegetable oils have in their chemical structure a considerable number of organic molecules, that are mostly responsible for the high non-linear response of these materials (Dixit et al., 1991; Marbello et al., 2020).
2.1. General chemical structure of a vegetable oil
Most essential fats and oils of vegetable origin have their own chemical structure, which varies according to the degree of refinement, the quality of the product and even the manufacturer; according to this, it is more effective to show the fats overall structure.
In principle, fats and oils can be broken apart into two fractions, a lipid or saponifiable fraction (where components such as triglycerides are found) and an unsaponifiable fraction. The lipid fraction constitutes almost 95% oil weight; this fraction consists of fatty acids, classified according to the single bond’s presence (saturated acids) or double bonds (monounsaturated acids and polyunsaturated acids) between carbons. Each of the oils in question complies with this chemical composition, the only parameter that varies between each is the percentage of each compound (Gunstone, 2013).
The non-linear response of these materials depends largely on the percentage of unsaturated fatty acids, in olive oil and avocado oil predominates palmitic acid (C16:0;4.6-20.0%), oleic acid (C18:1;6.2-71.1%) and linoleic acid (C18:2;1.6-79%) (Orsavova, Misurcova, Ambrozova, Vicha, & Mlcek 2015; Yanty, Marikkar, & Long, 2011).
2.2. Optical limiting effect
The optical limiters have been widely studied due to their potential use in the conformation and compression of optical pulses, however the greatest interest in the study of these devices is the protection of optical sensors for high powers. Various nonlinear optical phenomena can generate the effect of optical limitation passively; as main examples are the materials that have saturable and reverse saturable absorption, which have the best behavior in this type of phenomena (Band, Harter, & Bavli, 1986; Perry et al., 1994; Sreekumar et al., 2009).
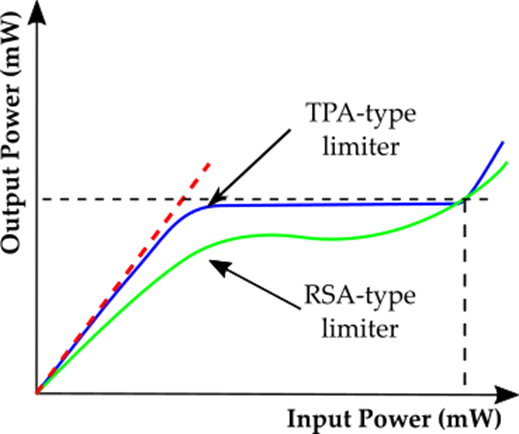
The optical limiter transmittance shows a dependence with the incident beam intensity, ideally the transmittance response of an optical limiter for low input powers is linear. As the power increases, the device acts so that, it maintains the transmittance below a specific value called saturation power. The Figure 1 shows how is the behavior and the input-output power relation.

In the Figure 1, the red trace shows the ideal behavior that a limiter should have, while the blue trace shows the general behavior. Both effects, the non-linear absorption and non-linear refraction can generate the optical limiting effect. But, in the real field, the transition from the linear regime to the limitation threshold may be different, depending on the nonlinear phenomenon that causes the optical limitation. For a material with two photon absorption (TPA), the behavior is closer to an ideal limiter, whereas for a material with saturable absorption and reverse saturable (RSA), the slope and transition is less pronounced having a directed limitation threshold more damage than limitation as illustrated in Figure 2.
Because of it, is necessary to observe the non-linear optical behavior of samples in study. In this work, the optical limiting effect by transmission was studied, which is generated for the variation in the non-linear refraction index spatial distribution (Kerr effect) (Boyd, 2008; Sutherland, McLean, & Kirkpatrick 2003).
The Figure 3 shows the experimental setup used in the study of optical limiting by dispersion, this consist in a sample positioned close to the lens focus, specifically where the transmittance shows a valley, which means, a high light scattering produced by the Kerr effect. The optical limiting effect was studied employing a converging lens of 100 mm focal length, and also a Nd-YAG CW laser, emitting in 532 nm.

2.3. Measurement of linear parameters
The measurement of linear refractive index and linear absorption coefficient of each oil was realized, due to is necessary to know how is the behavior of the samples studied with the source of excitation that is being used. For the linear refractive index n 0 measurement an ABBE refractometer was used, while for the linear absorption coefficient β measurement the UV-visible absorption spectrum of each sample was taken using a UV-VIS Evolution 60s spectrophotometer, Figure 4.

The Figure 4 shows that olive and avocado oil have a greater absorbance between 300 and 450 nm. On the other hand, at 532 nm both oils show a partial absorption, which allows the use of the Z-scan technique. The data obtained from these parameters are shown in the table 1.
2.4. Measurement of nonlinear parameters
The Z-scan technique allows isolated measurement and observation of the nonlinear refraction and nonlinear absorption effects, analyzing the variation of transmittance as a function of the incident beam intensity and its consequent variation with the position in the focal plane. To measure n2 and b, the configuration called closed cell and open cell, respectively, are used, which experimentally correspond to the same assembly illustrated in Figure 3, with the difference that in the Z-scan technique the sample is transferred through the focal plane.
Each of the optical parameters, as the refractive index and absorption coefficient are proportional to the incident beam intensity (n(I) and α(I)), so when this intensity is high enough, the contribution of non-linear parameters arises, each with direct proportionality with intensity.
Being
The sign of the nonlinear refractive index is determined by the maximum-minimum variance of the transmittance (Tp - Tv); if the sample has an n 2 < 0, it will present a peak to valley transition in the transmittance (blue trace) and in the case of a positive n2 the opposite transition will be given (red trace), as shown in Figure 5a. In other hand, for the open cell Z-scan, the transmittance graph as a function of position is a Lorentz distribution with symmetry in the origin (Sheik-Bahae et al., 1990; Stryland & Sheik-Bahae, 1997), and depending on the kind of material absorption, it could be oriented to a minimal transmittance; like in two photon absorption (Tp - Abs), for a maximal transmittance, like when saturable absorption takes place (Sat - Abs) or for a minimal transmittance at the origin with a combined effect, as is presented in saturable reverse absorption (Rsat Abs) materials. The specific way of the previous mentioned Phenomena was shown in Figure 5b.

Figure 5 Trace of the transmittance curve (a) closed-cell configuration and the (b) open cell configuration in the Z-scan technique (Sheik-Bahae et al., 1990; Stryland & Sheik-Bahae, 1997).
3. Results and discussions
3.1. Optical limiting measures
In previous works, for the Z-scan analysis the sample was displaced 60 mm symmetrically with respect to the focus lens (- 30 mm to 30 mm) (Marbello et al., 2019; 2020). The results show that both oils have a third-order nonlinearity with a negative nonlinear refractive index and a transitive absorption effect oriented to reverse saturable absorption (Marbello et al., 2020); nevertheless, phenomena such as the absorption of multiple photons and others, generally require intensities that can only be achieved with a pulsed light source. Therefore, in the case of a CW laser source, the nonlinear refraction effects are predominant over absorption effects, the latter being produced due to a saturation in the material caused by continuous absorption (Marbello et al., 2020); For this reason, the measurement of the optical limiting effect by dispersion was performed, that is caused by the nonlinear refraction effects of the sample.
Optical limiting devices are initially classified as active or passive according to the limiting method, with optical limiters of an active nature being those that base their operation on the induced scattering of incident laser light and passive limiters, as in our case, are the ones that carry out the limitation process through the effects of nonlinear refraction and absorption. However, the behavior of an ideal optical limiter, in practice is different, a material that shows a simultaneous effect of non-linear absorption and refraction will generate an optical limitation effect characterized by having three regions depending on the input/output power ratio (Aithal, Aithal, & Bhat, 2016). The limiting curves obtained for each oil are shown in Figure 6.

The output power increases linearly for low input powers, but as the incident power increase to average value each of the oils reaches a saturation power. For olive oil, the transition from the linear regime to the limiting region is closer to that of an ideal limiter, showing a broader region of limitation, starting its optical limiting threshold around 22 mW with a saturation power of at least 1.2 mW, and continuing at powers beyond 50 mW, which it's a notable characteristic at the moment of making this devices.
On the other hand, avocado oil the oil has a behavior more similar to that passive optical limiter with reverse saturable absorption (Figure 2), since its transition is much less noticeable that of olive oil and the limiting effect is beginning to be noticed after powers of 10 - 12 mW. On the other hand, this oil manifests a saturation power of approximately 0.6 mW, a power lower than extra virgin olive oil. However, due to the heating caused by the continuous incidence of the beam laser, the avocado oil degraded in such a way that, its damage threshold began at a power of approximately 30 mW; which is not a great property for high intensity work systems. Specifically, the table 2 shows the powers in which the optical limiting threshold was presented for each oils studied.
Table 2 Parameters obtained from the optical limiting curves.
| Oil | Saturation Power (mW) | Power limiting threshold (mW) | Damage power (mW) |
|---|---|---|---|
| EVOO | 1.2 | 20-22 | >50 |
| VAVO | 0.6 | 10-12 | 32 |
If a comparison is made of the two previous graphs, which shows the behavior as optical limiters of each oils, we can clarify the advantages that each has with respect to the other. Based mainly on the results obtained and the characteristics that an ideal optical limiter must show; for example, a low limitation level or threshold, a rapid response (for a CW or pulsed source) and also a wide limitation band (Balaji et al., 2011; Rashidian et al., 2009). As is evident, extra virgin olive oil offers a much wider region of limitation than avocado oil, but the latter has a saturation power of just 06. mW; a characteristic with great potential for systems with high work intensities.
4.Conclusions
The optical limiting effect caused by non-linear refraction (by dispersion) in two oils of vegetable origin was studied. During the study, the oils behavior exposed to a CW laser light source was taken into account, both in the linear regime (low intensities), and in the non-linear regime; analyzed by means of the Z-scan technique. On the other hand, the effect of optical limiting is caused by a set of thermo-optical effects due to the simultaneous presence of the refraction and non-linear absorption effects. With respect to the properties and characteristics observed in the limitation curves, both oils show a good behavior even at low powers, such as a good saturation power and a low limit threshold. However, olive oil has a much wider region of limitation than avocado oil, placing it in a better position to consider the application of this type of materials in the electro-optical element’s protection.

