


 nueva página del texto (beta)
 Inglés (pdf)
 Artículo en XML
 Referencias del artículo
 Enviar artículo por email
 Citado por SciELO
  Similares en
SciELO
Similares en
SciELO 
 Permalink
1. Introduction
Energy expenditure profile and behavior are the main factors to study the worker's durability related to their performance. The energy expenditure graph (Groover, 2007) consists of three major phases which is rest, activity, and recovery. The tradeoff between recovery speed and heart rate increase speed during the activity phase will be used as a key for assessing a person's physical level to display work performance. The faster the recovery speed and the slower the heart increase speed indicates the good physical condition. A person's physical condition becomes a basic input in assessing energy expenditure performance. Human physical properties can be described as height, weight, heart rate, blood pressure, and other measurable factors. Many methods to describe the human physical condition are available, one that is approved is the body mass index (BMI). BMI is a quantitative technique to classify the body weight index category of our body whether classified as thin, normal, overweight, or obese. It is a statistical calculation that can be used to control our body weight to reach a normal weight according to body height. BMI can be employed to a group of people or individuals to estimate the human health trend and human risk for weight-related diseases.
There have been many studies that worked on the BMI method as the basis of the research analysis. Dietrich et al. (2008) examined the effect of BMI and physical activity on the value of heart rate variability (HRV) in Switzerland. Nuttall (2015) reported a review of BMI on human health, BMI can be used as a reference about a person's health condition and even as a basis for taking government policy to improve public health. Yazdanirad, Dehghan, Rahimi, Zeinodini, and Shakeriyan (2015) conducted a study on the effects of obesity and hot air conditions on 70 respondents in the climate room to see changes in heart rate during activities. Based on the measurement results it is found that respondents with obesity produce an average higher heart rate. She, Nakamura, Makino, Ohyama, and Hashimoto (2014) studied the effect of body weight measured by BMI to select the maximum heart rate formula. A greater BMI value will have a lower sensitivity to an increase in workload. Shaw, Tveito, Woiszwillo, and Pransky (2012) examined the effect of BMI on recovery and return to work after the onset of back pain related to the work done. The results of the study suggest that BMI is not a useful estimation factor during acute back pain. This study also utilizes the classification of human physical conditions by using BMI as a function of weight to height to assess the increase in heart rate acceleration during activity and also to assess the rates of decrease in heart rate during recovery. The profile of the recovery rate is an important aspect associated with the ability to return to work or activities.
Office workers who have less physical activities (low energy requirements and limited physical movement) such as working in front of the computer, front office, and the other desk work have higher health risks. The most common health complaint is obesity, which often leads to the emergence of other types of diseases. This study investigates the impact of the office workers' physical conditions described in body mass index (BMI) related to the Time to Recovery (TTR) and heart rate increase during activity.
2. Research materials
Several scientific theories underlie this research including the definition of BMI, the metabolic system in the human body, and the energy expenditure.
2.1. Body mass index (BMI)
Body mass index (BMI) is a measure of body proportionality based on a person's weight to height ratio. BMI applicable for adult men and women aged 20 years old and over. Bedogni et al. (2005) defines BMI as a comparison between weight and squared height. BMI is a quantitative technique to determine the obesity level of a person. BMI widely used because it is simple, inexpensive, and non-invasive. BMI can be used to control the bodyweight of a person to reach a normal weight according to height. BMI is a statistical calculation that is intended as a means of carrying out estimates. BMI can be applied to a group of people to determine trends, or it can also be applied individually. BMI can be formulated as follows:
where:
w = body weight (kg)
h = body height (m)
Several studies show a positive correlation between BMI scores and health risks. Rantanen et al. (2000) uses BMI to predict long-term mortality in men. Oberle, Samaghabadi, and Hughes (2017) utilizes the value of BMI to predict orthorexia Nervosa which is characterized by the fixation of obesity in healthy eating in the form of healthy eating behaviors, problems resulting from these behaviors, and positive feelings associated with these behaviors. Tomiyama, Hunger, Nguyen-Cuu, and Wells (2016) in her research explained that The United States Equal Employment Opportunity Commission advised companies to give penalties to employees who did not meet healthy criteria based on BMI scores. Employees are required to pay an additional 30% health insurance fee. Several factors such as age, sex, ethnicity, and muscle weight can affect the relationship between BMI and obesity levels. A world health organization (WHO) classified BMI values into four categories:
2.2. Human metabolism
Simply stated, breathing is the most important part of living things activity. The main function of breathing is to obtain O2 to be used by the body's cells and eliminate the CO2 produced by cells. O2 will be taken by red blood cells to enter the heart. The cardiovascular system is a link between the external environment and the body's internal fluid environment. This system carries nutrients and gases to all cells, tissues, organs, and organ systems, and also responsible for metabolic wastes disposal. This system is a transportation system in the body and part of the circulation system. The function of the cardiovascular system is to supply oxygen and nutrients throughout tissues and organs during the metabolic process. Normally, every tissue and organ of the body will receive enough blood flow so that the tissues and organs receive adequate nutrition. The cardiovascular system functions as a regulatory system that carries out various mechanisms in response to all biochemical and biomechanical activities. In brief, the relationship between the respiratory system, circulatory system, and metabolic processes in the human body is based on the graph below in Figure 1.
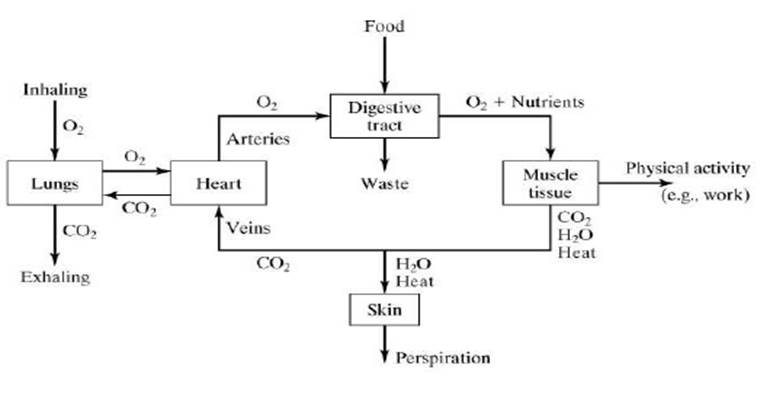
Source: Groover (2007)
Figure 1 The relationship between the respiratory system, circulatory system, and metabolic processes in the human body.
Many studies have investigated the human metabolism process. Groover (2007) in his book defines metabolism as the amount of muscle contraction caused by the chemical to mechanical energy conversion. Metabolism is the total of energy expenditure in the basal metabolic process (the amount of energy expended at total rest), the thermal effect of food (the energy used to digest and absorb food), and the energy expended in physical activity. The commonly used energy units are in the form of kilocalorie (kcal), kilojoules (kJ), NewtonMeter (Nm), and British thermal units (Btu). There are three types of metabolism, namely basal metabolism, activity metabolism, and digestive metabolism. Basal metabolism should only be calculated when the other metabolism halted. Therefore, basal metabolism is measured when the body is at rest and 12 hours after eating. Basal metabolism is energy allocated to circulating blood and for respiratory energy. The amount of energy for basal metabolism depends on body weight, sex, heredity, obesity, and so forth. The rate of energy release in basal metabolism is defined as the basal metabolic rate (BMR). For 20 years old male, the BMR is 1 Kcal / Kg of body weight, while for a 20 years old female the BMR is 0.9 Kcal / Kg from her body weight. Therefore, BMR is the minimum amount of energy needed to operate the body. Additional energy is required when a person doing an activity. The energy needed in physical activity such as sports and work is defined as activity metabolism. While digestive metabolism is the energy needed to digest food. As a person gets older the energy needed to digest food is reduced by 2% for every 10-year additional age. The equation in formula 2 is to calculate the digestive metabolism which can be written as follows (Groover, 2007):
Then the total daily metabolic needs can be calculated based on the following formulation 3:
where:
TMRd = Total daily metabolic rate, kcal/day
BMRd = Daily basal metabolic rate, kcal/day
AMRd = Daily activity metabolic rate, kcal/day
DMRd = Daily digestive metabolic rate, kcal/day
The metabolic rate in the human body is influenced by several factors as follows (Johnstone, Murison, Duncan, Rance, & Speakman, 2005):
1.- Muscle mass.
The amount of muscle tissue in the human body determines the weight of the Beard. Muscles need more energy to function properly. Strength training is the most effective way to build and maintain muscle mass.
2.- Age.
Increasing age (getting older) can reduce the metabolic rate. This is due to the loss of muscle tissue and changes in hormonal and neurological processes. During development, children go through periods of growth with extreme metabolic rates.
3.- Body size.
People who have a bigger body will have a bigger BMR because they have a greater number of body organs and fluid volumes to maintain.
4.- Gender.
Generally, men have a faster metabolism than women.
5.- Genetics.
Some people have genetic disorders that also affect metabolism.
6.- Physical activity.
Exercise increases muscle mass and increases calorie burning at a faster pace, even at rest.
7.- Hormonal factors.
Hormonal imbalances such as hypo & hyperthyroidism can affect human metabolism.
8.- Environmental factors.
Environmental changes such as increasing heat or cold force the body to work harder to maintain its normal temperature and increase BMR.
9.- Medicines, caffeine, and nicotine can increase human BMR, while antidepressants and steroids can increase body weight regardless of what humans eat.
10.- Diet.
Types of food intake will change human metabolism. What and how humans eat has a big influence on BMR.
2.3. Energy expenditure
Based on indirect physical workload measurement methods, the volume of oxygen needed while doing work can be used as a basis for determining the number of calories needed during work, 1 liter of oxygen equals 4.7-5 Kcal (Howley & Thompson, 2017). Another opinion says, in 1 liter of oxygen consumption the body will get 4.8 Kcal of energy equal to the caloric value of oxygen (Cavagna, 2019). The volume of oxygen consumed is calculated by measuring the volume of expiratory air and measuring the oxygen content determined by the sampling method. By knowing the temperature and air pressure, the volume of oxygen used can be calculated.
The human respiratory system requires a duration of time to fulfill oxygen needs throughout the human body. The difference between oxygen demand and oxygen availability is called oxygen debt. While the amount of oxygen needed for the recovery process after performing activities to stabilize the heart rate is called oxygen recovery. An illustration of both oxygen debt and oxygen recovery during the activity transition relative to energy expenditure can be seen in Figure 2.

Lunde et al. (2016) determines the classification of physical workload based on a comparison of the increase in work pulse rate with the maximum pulse rate due to cardiovascular load (% CVL) calculated by the Equation 4:
The maximum pulse rate for each person will vary depending on the physical conditions and age of each person. The maximum pulse formulation can be seen in Equation 5 (Tanaka, Monahan, & Seals, 2001):
Based on the results of the calculation of% CVL is then used to classify the working conditions experienced, as follows:
CVL ≤ 30% = no fatigue
30% <CVL ≤ 60% = improvement needed
60% <CVL ≤ 80% = short-time work
80% <CVL ≤ 100% = immediate action is needed
CVL> 100% = not allowed to move
Furthermore, cardiovascular strain (CVS) is determined as the ratio of changes in heart rate between working heart rate and resting heart rate as stated in Equation 6 (Ismaila, Oriolowo, & Akanbi, 2013).
where:
HRW = Activity heart rate (bpm)
HRR = Rest heart rate (bpm)
Based on the percentage value, workloads with CVS measurement values can be classified as follows: 0% -50% = acceptable, no need for action; 51% -80% = moderate, action is required within a few months; 81% -120% = high, action is needed in a few weeks; 121% -150% = very high, action is needed within a few days and 151% -180% = cannot be tolerated, immediate action is needed
3. Research methodology
Research methodology describes the grand design of research for experiments, data collection, research stages, and the equipment used. The purpose of this study was to determine differences in heart rate behavior due to different physical conditions of workers depicted by BMI. The changes in heart rate behavior are illustrated in the energy expenditure graph which consists of three phases, namely rest, activity, and recovery. The experiment was carried out by preparing a worksheet consists of the identities of the respondents of prospective research objects including name (optional), age, weight, height, and daily habits such as sports activities, smoking, and the number of meal times each day. The respondent's heart rate then measured at rest in three replications, followed by the heart rate measurement at work in the form of a leisurely walk for 10 minutes while the heart rate data were recorded every 2 minutes. Then continued by recovery time measurement. The recovery time was measured in the form of the respondent's heart rate decrease after rest from one minute of walking. The recovery time data recorded intermittently every minute of the continuous walk for 5 minutes.
Figure 3 explains the stages of research to measure the behavior of energy expenditure represented by changes in respondents' heart rates. Literature reviews include the basic definition of the BMI determination and its categories and risks to health, an understanding of the body's metabolic processes, energy expenditure, recovery time, and physical endurance/physiology ergonomics. The total number of respondents for research correlational from 30 to 500 each category (Roscoe, 1975). Mellis, Ingle, and Carroll (2014) worked on 97 respondents in their research of heart rate recovery conducted to exercises. Mitchelmore (2014) employed 70 healthy students in his research of BMI related to resting heart rate. The research worked on 126 (50% both man and woman) respondents with the ages between 20 to 40 years old from various office workers at East Java, Indonesia. Selected respondents are healthy workers with no prior illness and disease. The equipment used are worksheets, mi band heart rate gauges, stopwatches, mobile phones that are used as heart rate monitors using the Mi Fit application, and cameras.

4. Results and discussions
The results obtained by orderly following the results methodology. The first step is the measurement of BMI based on the respondent's body weight. The complete collection of the respondent’s BMI provided in table 1. The way to obtain individual BMI in Table 1 is by using Equation 1. For example, the first respondent BMI can be calculated as follows:
Table 1 Respondent BMI measurement data.
| No | Respondents | Age | Weight (Kg) | Height (cm) | BMI |
|---|---|---|---|---|---|
| 1 | Respondent 1 | 28 | 65 | 160 | 25.4 |
| 2 | Respondent 2 | 32 | 84 | 172 | 28.4 |
| 3 | Respondent 3 | 33 | 76 | 168 | 22 |
| 4 | Respondent 4 | 31 | 78 | 170 | 27 |
| 5 | Respondent 5 | 32 | 68 | 172 | 23 |
| 6 | Respondent 6 | 35 | 78 | 174 | 25.8 |
| 7 | Respondent 7 | 32 | 80 | 170 | 27.7 |
| … | … | … | … | … | … |
| … | … | … | … | … | … |
| 126 | Respondent 126 | 29 | 76 | 176 | 24.5 |
Based on the above calculation, the first respondent with 25.4 kg / m2 BMI belongs to the tourist condition category which includes medium obesity (25 BMI≤ 29.9). Within that range, BMI indicates high health risks and reduced lifespan (Wang et al., 2017). The respondents BMI data are clustered with the composition of 4% underweight with 17.1 kg / m2 average BMI, 34.1% healthy weight with 21.0 kg / m2 average BMI, 23% light obesity with 24.1 kg / m2 average BMI, 29.4% medium obesity with 26.4 kg / m2 average BMI, and 9.5% medium obesity with 34.9 kg / m2 average BMI. In general, the BMI increases concomitantly with the age which indicates riskier to gain health problems. This is due to the static work activities with a major portion of the work done in a sitting position without regular physical exercise.
The heart rate measurement results written sequentially for each BMI class. The average resting heart rate of the underweight class is 78.0 bpm, the healthy weight class 81.0 bpm, the light obesity class 76.0 bpm, the medium obesity class 78.0 bpm, and the weight obesity class 84.6 bpm. Hence, the increase in the BMI followed by the increase of the heart rate at rest. The weight obesity class resting heart rate is 17.8% faster than the healthy weight class. The heart rate measured during activity is significantly faster than the resting heart rate. Based on the respondent's data, the heart rate increase during walking varies for each BMI class. The heart rate increase for the underweight class is 11.9%, healthy weight class is 17.5%, light obesity class is 16.0%, medium obesity class is 19.0%, and weight obesity class is 10.2%. While the average heart rate at the activity for each class is: underweight = 88.4 bpm, healthy weight = 95.2 bpm, light obesity = 94.0 bpm, medium obesity = 95.2 bpm, and weight obesity = 98.6.
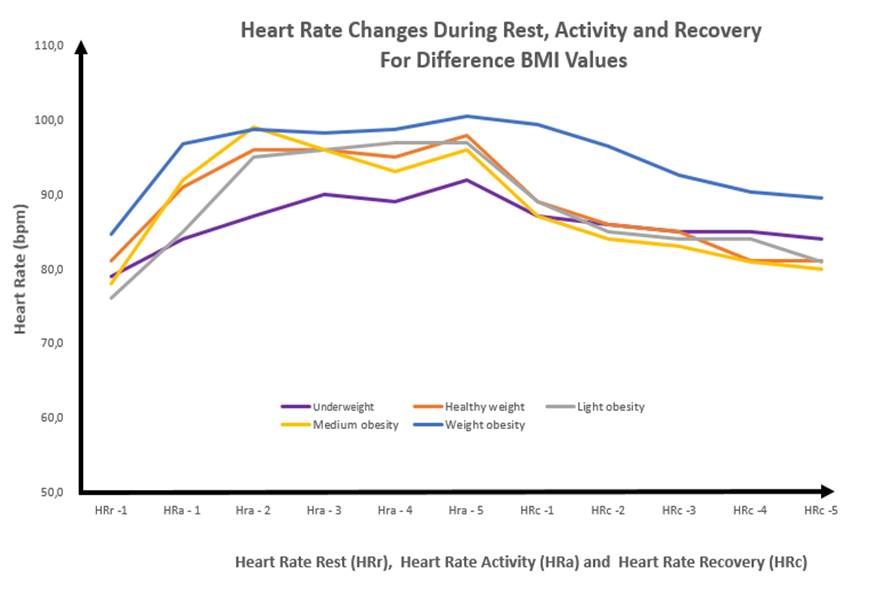
The energy expenditure behavior can be indicated by the change in the heart rate. A significant change of heart rate at rest, during activity, and when recovery for each BMI category is shown in Figure 4. Overall, the heart rate of the weight obesity respondents is the highest among all other classes and the underweight respondents have the lowest heart rates. A healthy weight, light obesity, and medium obesity class have a comparable heart rate. Although, the healthy weight class has a more stable heart rate. Recovery time is an important factor for workers and sportsmen to regain the energy that has been a loss. The work by Dwyer, Sallis, Blizzard, Lazarus, and Dean (2001), Groeneveld, de Boer, and Frings-Dresen (2013), Schwarb et al. (2017), Wasley, Taylor, Backx, and Williamon (2012), support each other results that the physical condition of a person will affect the performance of the work and mental condition. Based on the graph in Figure 4, the recovery rate o the healthy weight, light obesity, and medium obesity class is better than the underweight and weight obesity class. The recovery rate of each class measured from the average heart rate at the activity with the last heart rate at recovery is: underweight = 0.9 bpm, healthy weight = 2.84 bpm, light obesity = 2.6 bpm, medium obesity = 3.0 bpm, and weight obesity = 1.9 bpm.
Cardiovascular strains (CVS) for each BMI group are measured to get more insights into the heart health problem risks of each class. The calculation of CVS using Equation 6 is provided below this sentence. Based on CVS calculation, the respondents have an acceptable average, meaning that they do not need improvements. Weight obesity respondents only experience low cardiovascular strains because they already have a high average heart rate at rest, meaning that they do not experience a happy surge when doing their activities. Individual CVS from 126 respondents were calculated, the 72nd respondent has the highest CVS with an average resting heart rate of 69bpm, and when doing an activity rose sharply to 102 or CVS = 47.1%.
5. Conclusions
This study has successfully demonstrated the relationship between the physical conditions of a person's body which defined by the BMI to the energy expenditure behavior defined in the pattern of heart rate changes. Overall, the weight obesity respondents are more likely to develop health problems due to a higher heart rate, even at rest condition. The weight obesity and underweight class need a longer time to recovery. The recovery rate of each category is measured by the average heart rate during activity with the last heart rate at recovery is: underweight = 0.9 bpm, healthy weight = 2.84 bpm, light obesity = 2.6 bpm, medium obesity = 3.0 bpm, and weight obesity = 1.9 bpm. This is not beneficial to increase productivity or durability of workers.

