


 nueva página del texto (beta)
 Inglés (pdf)
 Artículo en XML
 Referencias del artículo
 Enviar artículo por email
 Citado por SciELO
  Similares en
SciELO
Similares en
SciELO 
 Permalink
1. Introduction
Nowadays, having inconsistent data is a major impediment to business competitiveness. Many businesses suffer from duplicate records. For instance, information about the same provider, customer or product appears in multiple systems and in multiple formats across the company and data values from the same entity simply does not tally from system to system. This situation seriously impedes managers to make well informed decisions. This issue is not derived from a lack of technology investment; technology investment; on the contrary, organisations spend millions of dollars on enterprise resource planning (ERP) systems in order to obtain a unique and consistent set of enterprise data. But, the vast majority of businesses actually need to implement additional software products, and each new system has its own database, its own data format and, frequently, its own version of data that appears elsewhere.
For instance, in the case of a customer address has changed, such update must be reflected not only in a company's customer relationship management (CRM) system but also into other databases that also use that information, such as the logistics system with obvious repercussions when it comes to the delivery of ordered goods.
The financial industry has faced several frauds caused by duplicate data. For instance, frauds originated by theft identity or non-valid substitute checks. All financial institutions are interested in decreasing the already existing number of duplicates today and implement a more efficiently data handling in order to avoid future duplicate data. The handling of duplicates is in many ways related to some legal considerations including the warranty against duplicate presentment (a check is deposited via mobile device, then the paper check is deposited in a different bank as well). The challenge is how to do so in today’s image exchange environment. Duplicates can originate from various sources and through numerous channels, and being able to prevent the duplicate item at the source or detect the duplicate prior to posting is key to minimizing customer impact and financial institution risk.
In the case of duplicate medical records, when the system is unable to find a reliable patient record the risk of wrong medical treatment, or over-immunization, is present, along with the corresponding cost of unnecessary immunizations, or the risk of adverse effects on patients, etc. Therefore, solving problems around duplicate medical records improves the quality of patient care and represents significant cost-savings.
The existence of duplicate records has strong implications on the use and scope of data. Low data quality affects making decisions. Therefore, there has been a significant research in the area of data quality and data matching during the last decade.
The present research approach is aimed to the development of a free prototype called Universal Evaluation System Data Quality (SEUCAD) (Angeles et al., 2014) on the basis of the Freely Extensible Biomedical Record Linkage software (Febrl), which was part of a project directed by Dr. Peter Christen, with funds from the National University of Australia (Christen, 2008, 2012). Record linkage will be referred in the present document as data matching.
We have compared, added and improved a number of data matching methods. Our prototype allows end users to assess density, coverage, completeness (Angeles & García-Ugalde, 2009; Angeles et al., 2014; Naumann, Freytag, & Leser, 2004) and perform a complete data matching process in order to identify duplicate records.
This paper is focused on the development of a new classification method within the data matching process. The remainder of this paper is presented as follows: Section II introduces the data matching process. Section III discusses the related work on some unsupervised classification methods. Section IV proposes the Attribute-based classification by threshold. Section V presents how the quality of data matching shall be evaluated, a set of experiments has carried out in order to compare the existing classification algorithms, and how these algorithms impact the performance of the data matching. Finally, Section VI provides the conclusion and statement of future work.
2. The data matching process
In the health sector, for example, many public and private organizations collect, store, process, and analyse increasing amounts of data related to patients and their medical records. The detection of medical records that refer to the same patient is becoming increasingly important. Data matching can help improving health policies, detect fraud, reduce costs, detect adverse drug reactions, and may be used in place of the expensive survey process in epidemiological studies. (Christen, 2008; Clark, 2004).
The data matching process in general terms is focused on identifying records from different data sources that describe the same entity. This process requires the following tasks: data standardization; indexing possible matching data in order to reduce the number of comparisons; data comparison and classification of pairs of records in possible match, not match, and match. These steps are briefly explained in this section (Christen, 2012).
Since real-world data are usually incomplete, dirty, or incorrect, cleanliness and standardization of such data are part of the first step within the data matching to deliver satisfactory results (Christen, 2008).
The second step is indexing the data. This task is aimed at reducing the computational complexity inherent in the process of Linking Records. This complexity is quadratic and can make prohibitive or impractical the analysis of large data sources. Indexing occurs by sorting records according to the value of one or more fields and inserting these records with the same value of an index into a specific block (Baxter, Christen, & Churches, 2003).
The third step of data matching is record pairs comparison. Thus, the same fields of two different records are compared through specific similarity functions according to their data type and characteristics in order to determine how similar they are. This operation is performed for all the fields that have been selected for this purpose to obtain a comparison vector between two records. This process is repeated for all the elements contained within the indexed block and then repeated for the remaining blocks.
The fourth step is record pairs classification, which classifies records according to the comparison vectors generated from the previous step. If the classification allows only two states, the vectors are then classified into “match” (records correspond to the same entity) and “non-match” (records refer to different entities). If the classification allows three states, then the vectors are classified as “match”, “non-match” and “potential match”. The latter will require further analysis to determine the final status of a record.
The fifth step corresponds to clerical review. In the case of record pairs classified as “potential match”, further analysis is required in order to determine the final classification. The clerical review has the following disadvantages (Christen, 2008).
a) It is difficult to determine whether a pair of records (ri, rj) corresponds to the same entity or not. Therefore, having experience with similar records is required. This implies that manual review is difficult even for an expert in data matching.
b) Manual classification depends on human appreciation, which is sensitive to factors such as boredom, stress, concentration level, and the number of records to be manually sorted.
Finally, once the classification has been completed, the quality of data matching is evaluated. This includes for instance, determining how many vector comparisons were correctly classified. The process of evaluation of data matching is covered in Section V.
3. The classification process
The prototype implements three unsupervised classification methods: K-means, Farthest First, and Threshold base-classification.
3.1 K-means
The K-means clustering algorithm (Lloyd, 1982) is a search algorithm that partitions a set X of n input vectors into k clusters. The number of clusters is a parameter of the algorithm, so the number of clusters must be specified before running the algorithm. The algorithm is based on the calculation of each vector whose centre is closer located to the cluster. Then, after addition of a new vector, the mean or centroid of each cluster is recalculated. This is repeated until the centroids and clusters are unchanged.
The K-Means algorithm (Vattani, 2011) is as follows:
Chose arbitrarily the k centres of the clusters ci = {c1, c2,…, ck}
For each 1 ≤ i ≤ k , set the cluster Ci as the set of points in X that are closer to ci than any cj for i ≠ j
For each 1 ≤ i ≤ k , set the position of each cluster to the mean of all data points belonging to that cluster ci=1|ci|∑x∈cix,∀i
Repeat steps ii and iii until the clusters Ci and centres ci do not change.
The result will be the set X partitioned into C1, C2,. . . ,Ck clusters. The main advantage of this algorithm is that in practice the number of iterations of the algorithm is usually less than the number of samples the algorithm will classify. However, the algorithm has an exponential theoretical lower bound 2Ω(n) for data with two or more dimensions (Christen, 2012). Furthermore, as the data grow in number of dimensions, it is increasingly difficult to obtain a significant distance when calculating the distance between the centroids and the vectors due to the complexity of a d-dimensional space (Navarro, 2001). The main advantages of the K-means algorithm are that is simple, flexible, easy to understand, and implement. However, the number of clusters (k) to be obtained must be known before running the algorithm and the clusters obtained depend on the chosen initial centroids, so there is no guarantee of an optimal solution (Christen 2012).
3.2 Farthest First
The Farthest First algorithm (Gonzalez, 1985) is a variant of the K-means algorithm. The difference occurs when the centroids are computed, the first centroid is assigned randomly, then, each cluster centre, in turn, is placed at the point furthest from the existing cluster centre, and this point must lie within the data area. This greatly speeds up the clustering in most of the cases since less reassignment and adjustment is needed (Aher & Lobo, 2012).
The above classification records have been extensively used and compared (Sehgal & Garg, 2014) the farthest first algorithm has proven been faster than K-means, number of clusters formed by K-means algorithm and Farthest First algorithm is same for all the datasets, the number of clusters increases as size of dataset increases.
3.3 Threshold-based classification
The simplest form of classifying candidate record pairs (ri, rj) is to sum the similarity values in their comparison vectors into a single total similarity value called SimSum (ri, rj), then to assign a threshold T to rank the comparison vectors as “match” or “non-match” (Christen, 2012).
SimSum (ri, rj) ≥ T → (ri, rj) “match”
SimSum (ri, rj) <T → (ri, rj) “no match”
Alternatively, two thresholds can be assigned, Tl as the lower threshold and Tu as the upper threshold, SimSum (ri, rj) is the similarity value added compared to the vector corresponding to ri and rj records. Thus, the comparison vectors can be labelled as “match”, “no match”, or “potential match”.
a) SimSum (ri, rj) ≥ Tu→ (ri, rj) “match”
b) Tl <SimSum (ri, rj) < Tu → (ri, rj) “potential match”
c) SimSum (ri, rj) < Tl → (ri, rj) “no match”
The values assigned to the thresholds have a direct impact on the quality of the classification. On the one hand, if a single threshold is set to a very high value, it is highly likely that pairs of matching records will be classified as “no match”. On the other hand, if the value of the single threshold is very low, it is very likely that vectors corresponding to mismatched records will be misclassified as “match”.
In the case of two thresholds, if the lower threshold has been assigned with a very low value, and the upper threshold has been assigned with a high value, then it is highly likely that most of the records are classified as “potential match”, which implies that clerical review will be required, with the consequent investment in time and resources this process requires.
If the comparison vectors contain normalized values, then all the similarities contribute with the same weight to the total similarity value (SimSum). Consequently, the detailed information on similarity values is lost when performing the total addition.
The first disadvantage is that all the attributes will have the same importance in order to determine if the records are duplicates or not. However, depending on the characteristics of the data, some attributes may be more significant than others when determining the classification status of the records.
The second disadvantage is that the detailed values from the comparison vector are lost when adding the similarity values. Therefore, there is a possibility that highly dissimilar records and highly similar records can have the same SimSum value. This problem will be addressed within our proposal of an enhanced classification algorithm.
The main advantages of this classification method are its simplicity and its low computational cost.
4. Proposal: The attribute classification by threshold
We propose to implement a threshold-based classification method that is meant to prevent information loss from the similarity values of the comparison vector and eliminates the disadvantages mentioned in the previous section.
The proposed classification method will consider the importance of each attribute within the record and the similarity value of each attribute. The proposed new method is described below:
a) Upper and lower thresholds for each comparison attribute shall be determined by user. Such thresholds shall be entered as two vectors; one corresponding to the upper thresholds and other corresponding to the lower thresholds. In case of a classification where one threshold is desired, the upper and lower vectors will be the same.
b) Weight values for each of the comparison attributes shall be determined. These values correspond to the level of relevance each attribute has to distinguish two different records. Such values shall be entered as a weight vector.
c) The thresholds and weight vectors will be validated by the algorithm in order to ensure that vectors do not contain invalid characters or the lower threshold values are greater than the upper threshold values.
d) The initialization of three variables is required in order to assign the scores corresponding to the “match”, “non-match”, and “potential match” statuses. The above-referenced score is calculated from the thresholds vectors and the weight vector.
e) The attribute similarity value will be compared to the upper and lower thresholds. If the similarity value of the attribute is less than the lower threshold, the weight associated with that attribute is added to score contained in the “non-match” variable, in order to imply a classification state of mismatched records. Likewise, if the similarity value is between the upper and lower thresholds, the score of such an attribute is added to value contained in the “potential match” variable. Finally, if the similarity value is greater than or equal to the upper threshold, the attribute weight is added to the score contained in the “match” variable.
f) Repeat step e) for all attributes contained within the comparison vector.
g) The variable with the highest score will determine the classification result. For instance, if the highest score corresponds to the “match” variable, the classification result for that record pair will be “match”. The algorithm proceeds similarly in the case of the two other possible states of classification; if there is not a single maximum value, then the record pair is classified as “potential match”.
h) Steps d) to g) are repeated for all comparison vectors.
Figure 1 shows the algorithm described above in the form of flow chart.

4.1 Illustrative test
In this section we present an illustrative test that shows the Attribute-Based Classification by Threshold basic operation and demonstrates how the disadvantages of the Threshold-Based Classifier have been overcome. The disadvantages of the threshold-based classification are shown in Table 1 (Christen, 2012), which presents two record pairs with their corresponding similarities per attribute, the similarity values have been computed by the Levenshtein distance string metric (Levenshtein, 1966). Note that the column called "SimSum" is not part of the record pair but indicates the sum of the similarity values of the comparison vectors.
Table 1. Similarity values for record pairs (a1, b1) and (a2, b2).
| RecID | GivenName | Surname | StrNum | StrName | Suburb | BDay | BMonth | BYear | SimSum |
|---|---|---|---|---|---|---|---|---|---|
|
|
|
|
|
|
|
|
|
|
|
According to Table 1, we can observe that records (a1, b1) are highly similar. Thus, there is a high probability that they refer to the same person. Furthermore, records (a2, b2) are highly dissimilar. However, both record pairs have a total similarity value of 5.0. Therefore, if a threshold of 5.0 is set, both record pairs would be classified as “match”. Although, (a2, b2) correspond to different entities. Similarly, if a threshold of 4.9 is used, both pairs would be classified as “non-match”. Even though there is a high probability that (a1, b1) are “match”.
These records presented in Table 1 can be correctly classified by the Attribute-Based classification by threshold. Table 2 shows the vectors of thresholds and weights to be used by the new algorithm.
Table 2. Thresholds and weights assigned for classification.
| GivenName | Surname | StrNum | StrName | Suburb | BDay | BMonth | BYear | |
|---|---|---|---|---|---|---|---|---|
| Upper Threshold | 0.8 | 0.8 | 0.7 | 0.8 | 0.8 | 0.6 | 0.6 | 0.75 |
| Lower Threshold | 0.6 | 0.6 | 0.5 | 0.6 | 0.6 | 0.5 | 0.5 | 0.75 |
| Weight-per attribute | 3 | 5 | 1 | 2 | 2 | 1 | 1 | 4 |
Table 3 illustrates the use of thresholds and weights from Table 2 for the attribute-based classification by threshold of the records presented in Table 1.
Table 3. The use of similarity values per attributes with their thresholds and weights for an attribute-based classification.
| RecID | GivenName | Surname | StrNum | StrName | Suburb | BDay | BMonth | BYear |
|---|---|---|---|---|---|---|---|---|
| a1 | john | smith | 18 | miller st | dickson | 12 | 11 | 1970 |
| b1 | jonny | smyth | 73 | miller st | dixon | 11 | 12 | 1970 |
| (a1,b1) | 0.6 | 0.8 | 0.0 | 1.0 | 0.6 | 0.5 | 0.5 | 1.0 |
| Upper Threshold | 0.8 | 0.8 | 0.7 | 0.8 | 0.8 | 0.6 | 0.6 | 0.75 |
| Lower Threshold | 0.6 | 0.6 | 0.5 | 0.6 | 0.6 | 0.5 | 0.5 | 0.75 |
| Weight per attribute | 3 | 5 | 1 | 2 | 2 | 1 | 1 | 4 |
| Score per attribute | +3 to potential match | +5 to match | +1 to non-match | +2 to match | +2 to potential match | +1 to potential match. | +1 to potential match. | +4 to match |
| a2 | Mary | Harris | 42 | swamp rd | sydney | 21 | 4 | 1918 |
| b2 | Mandy | garrett | 42 | smither pl | sydneyham | 27 | 4 | 1979 |
| (a2,b2) | 0.6 | 0.4 | 1.0 | 0.4 | 0.6 | 0.5 | 1.0 | 0.5 |
| Upper Threshold | 0.8 | 0.8 | 0.7 | 0.8 | 0.8 | 0.6 | 0.6 | 0.75 |
| Lower Threshold | 0.6 | 0.6 | 0.5 | 0.6 | 0.6 | 0.5 | 0.5 | 0.75 |
| Weight per attribute | 3 | 5 | 1 | 2 | 2 | 1 | 1 | 4 |
| Score per attribute | +3 to potential match | +5 to non-match | +1 to match | +2 to non-match | +2 to potential match | +1 to potential match. | +1 to match | +4 to non-match |
Table 4 shows the total scores per record pairs along with the final classification. We can observe from such Table that the pair of records (a1, b1) has been classified as “match”, while the pair of records (a2, b2) has been classified as “non-match”, demonstrating that the Attribute-Based Classification by Threshold has overcome the disadvantages of the threshold-based classification.
5. Experiments
● Evaluation of quality of the data matching process.
Once all vectors have been classified, the quality of the data matching process is determined by computing a number of metrics, this task requires knowing which duplicate records are and which are not. The matching quality refers to how many of the classified matches correspond to true real-world entities, while matching completeness is concerned with how many of the real-world entities that appear in both databases were correctly matched (Barone, Maurino, Stella, & Batini, 2009; Christen, 2012). Each of the record pairs corresponds to one of the following categories:
a) True Positive (TP): These record pairs were correctly classified as “match”.
b) False Positives (FP): These record pairs were misclassified as “match”.
c) True Negatives (TN): These record pairs were correctly classified as “non-match”.
d) False negatives (FN): These record pairs were misclassified as “non-match”.
An ideal outcome of a data matching project is to correctly classify as many of the true matches as true positives, while keeping both the number of false positives and false negatives small. Based on the number of true positives (TP), true negatives (TN), false positives (FP), and false negatives (FN), the metrics precision, recall can be calculated.
Precision. This metric evaluates the quality of search in terms of the proportion of how many of the classified matches (TP+FP) have been correctly classified as true matches. Precision= TP/(TP+FP).
Recall. This metric evaluates how many of the record pairs effectively correspond to matching records and have been classified as such. Recall=TP/(TP+FN).
These metrics will be taken into account to assess the quality of data matching by comparing the classification methods.
6. Experiments
We have designed and conducted an experimentation plan to evaluate the functionality of the Attribute-Based Classification by Threshold. Furthermore, we present two case studies in order to make a comparative analysis between the Attribute-Based Classification by Threshold and the unsupervised classification methods existing in SEUCAD. These case studies will allow the performance assessment of the classification methods within the data matching process. Consequently, synthetic data by the Data Set Generator tool (Christen, 2012) has been generated and utilized. Table 5 shows the characteristics of the input data set for experiment 1.
Table 5. Characteristics of the synthetic data generated for comparing the unsupervised classifiers
| Total number of records | 2000 |
| Number of original records | 1800 |
| Number of duplicated records | 200 |
| Maximum number of duplicate records per original record | 3 |
| Maximum number of differences between the duplicate record and the original record per attribute | 2 |
| Maximum number of differences between the original record and the duplicate record | 8 |
| Record attributes | “rec_id”, “given_name”, “surname”, “street_number”, “address_1”, “address_2”, “suburb”, “postcode”, “state”, “date_of_birth”, “age”, “phone_number”, “soc_sec_id” |
Table 6 presents the comparison attributes, thresholds, and weights to be utilized in the first case study
In order to execute the experimentation plan, the process of data matching as described in Section II has to be executed according to the following configuration parameters:
● Indexing and Encoding
The “Blocking index” method was selected. The "surname" attribute has been chosen because is highly relevant to identify the entity, such attribute will be encoded by the phonetic function "Double Metaphone".
● Comparison
The field comparison function chosen was Levenshtein distance. Figure 2 shows the parameters required for comparison corresponding to given_name, street_number, address_1, and suburb fields. The attribute "surname" has not been considered due to that column was previously selected for indexing.
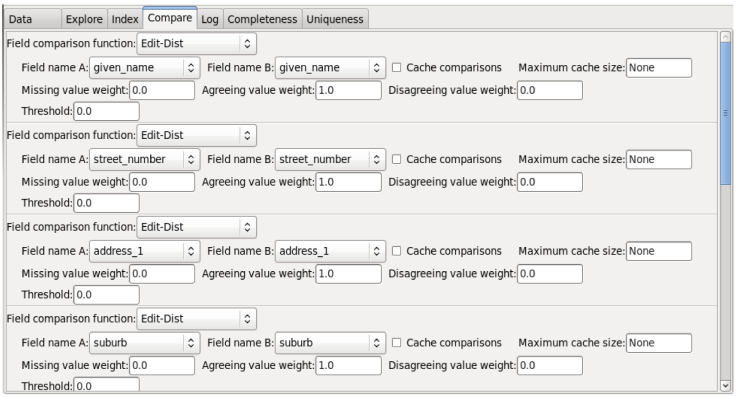
Fig. 2. Parameters assigned to compute the Levenshtein Distance to obtain the similarity during the comparison phase.
According to the experimentation plan, the entire data matching process has been executed three times, one per each classification method available in the prototype. The classification methods and their parameters used for comparative testing volume are:
-
a) Threshold-Base Classification: with a lower threshold set to 15 and an upper threshold set to 17.5.
The weight vector contained no-normalized values, as in the case of the Attribute-Base Classification by threshold.
b) K-means: Euclidean distance was used, initialization vectors in maximum and minimum values. Also, a maximum of 10,000 iterations was assigned to this method.
c) Farthest First: Euclidean distance and a maximum of 10,000 iterations were used.
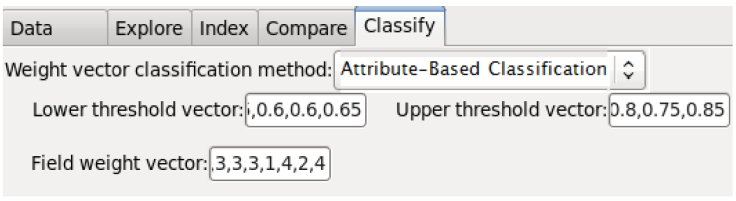
Figure 3 shows the vectors of thresholds and weights presented in Table 6 required for the Attribute-Based Classification by Threshold.
The outcome of the Data matching process is written to a flat file containing the input data and a column indicating the final records classification. Figure 4 shows a portion of the output file "Input-match.csv". Note that the last column corresponds to the attribute "match_id" which does not correspond to the original data, but indicates the final classification status.
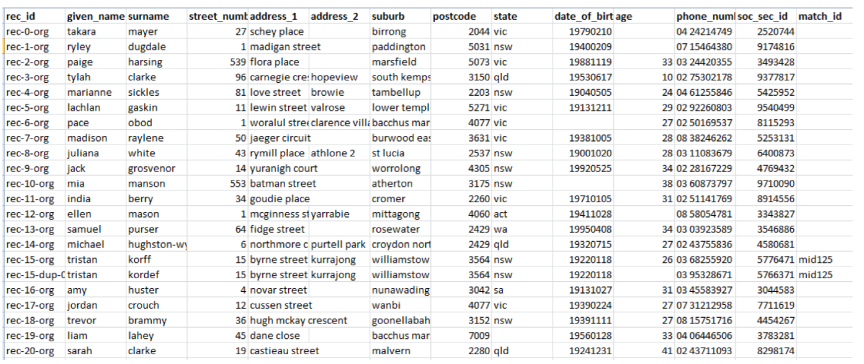
In order to obtain the number of duplicate records detected, we have analysed the values of the "match_id" column. Since the test data contain in some cases up to three duplicates per original record, such analysis has been an extensive job, and is not included in this document. However, the complete details of the performance of the classification methods are presented.
● Comparative Analysis of results
Table 7 and the corresponding histogram in Fig. 5 show the performance obtained from the execution of the Threshold-based, K-means, Farthest First and Attribute-Based Classification methods.
Table 7. Results of the Experiment 1 with unsupervised classification methods.
| Classification method | True Positives (T.P.) | True positives by clerical review (T.P.C.R) | Total true positives (T.T.P.) | False Positives (F.P.) | False Negatives (F.N.) | Precision | Recall | F-measure |
|---|---|---|---|---|---|---|---|---|
| Threshold-based | 182 | 11 | 193 | 0 | 7 | 1 | 0.965 | 0.9821883 |
| K-means | 199 | 1 | 200 | 2 | 0 | 0.99009901 | 1 | 0.99502488 |
| Farthest First | 199 | 1 | 200 | 1 | 0 | 0.995024876 | 1 | 0.99750623 |
| Attribute-Based | 199 | 1 | 200 | 0 | 0 | 1 | 1 | 1 |
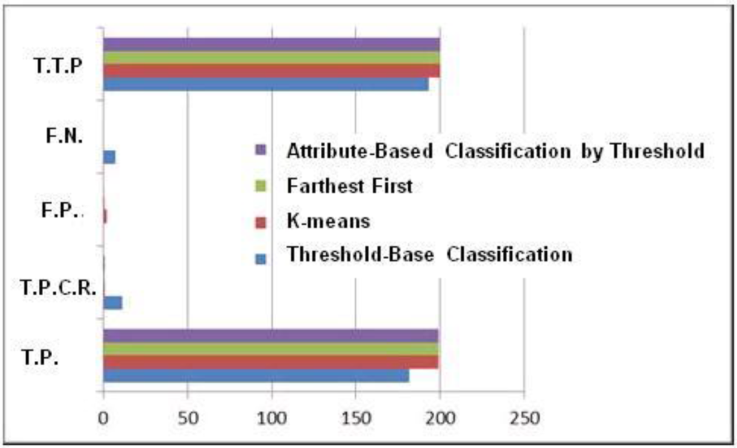
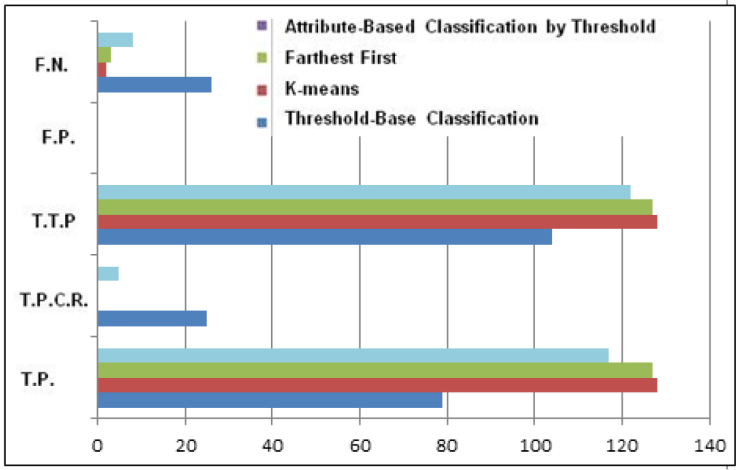
Fig. 5. Histogram of the results obtained from Experiment 1 (T.T.P.) Total True Positives, (F.N) False negatives, ( F.P.) False Positives, (T.P.C.R) True Positives by Clerical Review, (T.P.) true Positives.
According to the results presented in Table 7 and Fig. 5, we can observe that the Threshold-based Classifier could not detect seven duplicate records, and eleven records required clerical review. The K-means classifier detected 199 duplicate records out of 200. Thus, only one was detected by clerical review. However, an original record was misclassified as duplicate. The Attribute-based Classification by Threshold detected as K-means and Farthest First, 199 duplicate records out of 200 and, only one required clerical review. But there were neither false positives nor false negatives, having a better performance than the rest of the unsupervised classifiers.
The already presented experiment shows that our proposed classification algorithm performs better than the rest of classification methods. However, we have carried out a several number of experiments where there is a slight variation on the outcomes. For instance, Table 8 show K-medias and Farthest First algorithms having a better performance with higher values of recall and f-measure, and Fig. 6 shows the corresponding histogram. From our experience, we can say that our proposed Attribute-based Classification by Threshold method performs better than the Threshold-based Classifier most of the time.
Table 8. Results of the Experiment 2.
| Classification method | True Positives (T.P.) | True positives by clerical review (T.P.C.R) | Total true positives (T.T.P.) | True Negatives (T.N.) | False Positives (F.P.) | False Negatives (F.N.) | Preci-sion | Recall | F-measure |
|---|---|---|---|---|---|---|---|---|---|
| Threshold-based | 79 | 25 | 104 | 10132 | 0 | 26 | 1 | 0.8 | 0.8888888 |
| K means | 128 | 0 | 128 | 10132 | 0 | 2 | 1 | 0.984 | 0.9922480 |
| Farthest First | 127 | 0 | 127 | 10132 | 0 | 3 | 1 | 0.976 | 0.9883268 |
| Attribute-Based | 117 | 5 | 122 | 10132 | 0 | 8 | 1 | 0.938 | 0.9682539 |
7. Conclusion and future work
Duplicate records highly increase data cleaning process. Depending on the functional area (marketing, sales, finance, customer service, healthcare, etc.) and the business activities undertaken, high levels of duplicate customer data can cause hundreds of hours of manual reconciliation of data, sending information to wrong addresses, and decrease confidence in the company, increase mailing costs, increase resistance to implementation of new systems result in multiple sales people, sales teams or collectors calling on the same customer.
We have proposed and tested a new classification method called Attribute-based Classification by Threshold on the basis of a Threshold-Base Classifier (Christen, 2012) in order to improve the quality of the data matching process in terms of efficiency and performance against K-means and Farthest First algorithms.
The new method takes into account the specific relevance of each attribute (weights) during the classification process, avoiding such disadvantage within the Threshold-Based Classification.
The Attribute-based Classification by Threshold had a better performance than the threshold-based classifier, but a lower performance than K-means and Farthest First but a lower performance than K-means and Farthest First, and in some experiments our proposed method had the best outcomes of the four unsupervised classification methods evaluated.
The performance of the new method depends on the thresholds and weights determined by the user, as any other threshold-based classifier.
The thresholds and weights values can be specified after visually analysing data by end-users already familiarised with the corresponding comparison method. Therefore, the Attribute-based Classification by Threshold method can give good results even for relatively inexperienced user.
Extensive additional experimentation is required to determine the circumstances and parameters that could be implemented for further analysis of data with the Attribute-based Classification by Threshold.
Developing a module that enables the automatic count the number of records classified as duplicates and potential duplicates is part of future work, along with the development of new algorithms that can enhance comparison, coding and classification.

