1. INTRODUCTION
Bearings are one of the prominent components in most of the machines in process industries. They establish free rotational or linear movement, by reducing friction. Bearings may turn faulty due to heavy loading, insufficient lubrication and ineffective sealing. Several studies have stated that the major cause of failure of rotating machines is due to bearing failure (Li, Jiang, Hu. k Peng, 2016; Li, Jiang, Wang, k Peng, 2016). Unexpected failure of the bearings may damage other parts of the machines also and may increase downtime costs. Conventional methods for monitoring bearing health include motor current analysis, wear debris analysis, noise monitoring, temperature monitoring, vibration monitoring, chemical analysis, Laser displacement measurement, etc., (Jiang & Zhu,2016). The misalignment of the bearing produces vibration and acoustic noise (Glowacz, 2016; Glowacz & Glowacz, 2016; Glowacz, & Glowacz, 2017). From the characteristics of the vibration (Safizadeh & Latifi, 2014), faults can be detected, faulty bearings can be preciously located from a distributed network and the fault type can be identified to a great extent. Signal processing techniques are the most vital part of the systems meant for the automated analysis and interpretation of bearing vibration. Feature extraction techniques used in these automated systems generally belong to time domain, spectral domain (Amar, Gondal. & Wilson, 2015; Carson, Mulholland, Nordon, Gachagan. & Hayward 2009) or Time-Frequency (TF) domain. Peak/peak to peak and Root Mean Square (RMS) amplitude of vibration, skewness, kurtosis, crest factor (Tuncay & Nizami, 2009) measures of Central Tendency (CT) (Tahir, Khan, Iqbal , Hussain, & Badshah, 2016), impulse factor, shape factor and clearance factor (Kiral & Karagülle 2006) are few of such time domain features usually employed.
Frequency domain features, available in literature used for the automated analysis of vibration includes its dominant frequency (Harmouche, Delpha, & Diallo, 2015), Intermediate Frequency (IF) (Van & Kang, 2015a; Yu, Yu, & Cheng, 2006), features of the spectral envelope extracted via Hilbert Huang Transform (HHT) (Mouroutsos & Chatzisavvas, 2009), spectral kurtosis (Tian, Morillo, Azarian, & Pecht, 2016) etc. Vibration being non-stationary, time domain as well as spectral features cannot account for its behavioral pattern. Wavelet Transform (WT) (Eren & Devaney, 2004; Qiu. Lee, Lin, & Yu, 2006; Teotrakool, Devaney, & Eren, 2009; Wang, Zhang, Zhang, & Su, 2011; Li, Chen, & Wang. 2012; Van & Kang, 2015b; Wang & He, 2016) was suggested to be a viable choice for vibration analysis in many studies. Even though the WT is a TF domain feature extraction technique, arbitrary selection of mother wavelet and level of decomposition is troublesome in wavelet based vibration analysis and may produce error prone conclusions. Most simple TF technique that can be employed to characterize the features of vibration data is spectrogram. Another attraction of spectrogram over WT is that it visualizes the auditory information in TF space.
Czarnecki, (2016) suggested that energy density estimated via ordinary spectrogram or Instantaneous Frequency Rate Spectrogram (IFRS) is a reliable feature as far as mechanical vibrations are concerned. The author (Klein, 2013) demonstrated that faults in turbofan engine can be detected from the spectrogram of its vibrations, computed via Wigner-Ville, wavelets or Short Time Fourier Transform (STFT). Spectrogram of the vibrations produced in gear units was used (Belssak & Prezelj, 2011) for monitoring their condition. In another approach the spectrogram of vibration has the potential to detect faults in single cylinder four stroke IC engine (Yadav & Kaka. 2010). The damaged bearings in highly sophisticated systems like aircraft engines can be identified just via simple visual inspection of spectrograms of vibration data (Griffaton, Picheral & Tenenhaus, 2015). For analyzing the vibrations in rolling bearings, a modified version of the ordinary spectrogram, termed as 'adaptive gaussian chirplet spectrogram' was introduced (Yu, Guo, Hu, & Xu, 2006).
However, manual interpretation of spectrogram is tedious as it depends on the expertise of the observer. Moreover, the subjectivity inherent in its manual judgement is an ill posed issue. Image processing methods can be employed for the automated evaluation and comparative interpretation of spectrograms. As a base to such efforts, the images of spectrum of vibration data was introduced (Li, Qiu, Zhu, Wu, & Zhou, 2016) for diagnosing faults in bearings. Another method, Quaternion invariable moment to account for color features of the vibration spectrograms was employed (Hua et al., 2015). To interpret the spectrogram the ridge information was utilized (Klein, Masad, Rudyk, & Winkler, 2014).
In the spectrogram image, the variation of pseudo colors or grey levels in a particular column reflects how different the spectral power of a particular frequency component is, between distinct epochs. Thus, the variation of pseudo color or grey level in each column accounts for the variation of spectral power of a particular frequency component over time ie; the non-stationarity of the signal. Similarly, the variation of pseudo color or grey level in each raw accounts for the relative distribution of spectral power over different frequency components within a single epoch itself. Quaternion invariable moment of the spectrogram image (Hua et al., 2015) does not seem to be sufficient to characterize the non-stationarity behavior of vibration data. Likewise, the ridges (Klein et al., 2014), alone cannot express continuous variation in the pseudo colors or grey levels in the spectrogram image which in turn reflects the time varying spectral features of the vibration data.
A non-intrusive method for health monitoring and fault diagnosis of bearing system based on pattern matching of spectrogram images is proposed in this paper. The spectrogram images of the baseline or reference vibration data which belongs to a normal bearing and contextual vibration data whose underlying bearing state is unknown, are compared for their mutual resemblance in terms of the variation in pseudo color or grey level with the help of Structural Similarity Index Metric (SSIM). It is hypothesized that when the bearing is faulty, the grey level distribution of the spectrogram image of its vibration would be completely different from that of the baseline image. In this particular context, the SSIM between them would be comparatively less. Manual comparison of the spectrogram images is always subjective and error prone. The major contribution of this paper is an automated method based on image processing techniques for matching the color distribution in baseline and contextual spectrogram images. Rest of the paper is organized as follows. The details of vibration data used in the analysis and mathematical formulation of images of spectrogram and SSIM are furnished in section 2. The statistical significance of SSIM between spectrogram images of base line and contextual vibration data to yield an accurate classification of faulty and normal bearings is analyzed in section 3.
2. METHODOLOGY
In the proposed method the spectrogram image of the contextual vibration has to be compared with a baseline spectrogram image of the vibration data from a healthy bearing, in terms of similarity in color or grey level distribution to identify whether the state of the bearing from which the contextual vibration is recorded is faulty or healthy. As pointed out earlier, it is expected that the similarity would be less if the bearing pertaining to the contextual vibration is faulty.
The bearing vibration data used for developing the automated method is availed from Prognostics Center of Excellence, National Aeronautics and Space Administration (NASA). This data repository is contributed by the Intelligent Maintenance System, University of Cincinnati, US (Lee, Qiu, Yu, & Lin, 2007). In their vibration test rig, four Rexnord ZA-2115 double row bearings are fixed to a shaft, driven by an AC motor. All bearings are coercively lubricated. Each bearing has 16 rollers in it, with dimensions, pitch diameter of 2.815 inches, roller diameter of 0.331 inches, and tapered contact angle of 15.17 degree.
Bearing vibration is captured with PCB 353B33, high sensitivity quartz ICP® accelerometer, mounted on the bearing housing. Data is recorded by Lab VIEW, via an acquisition card, DAQCarde-6062E, configured at a sampling rate of 20 KHz. During the acquisition, the shaft and bearing assembly is provided with a uniform radial load of 6000 lbs. and its speed of rotation is maintained steady at a rate of 2000 rpm. Consequently, the characteristics of the vibration signal will account for the state of the bearing rather than changing with respect to fluctuating load or shaft speed. The photograph (Fig. 1 (a)) as well as the schematic of the vibration acquisition set up (Fig. 1 (b)) is given in Fig. 1.
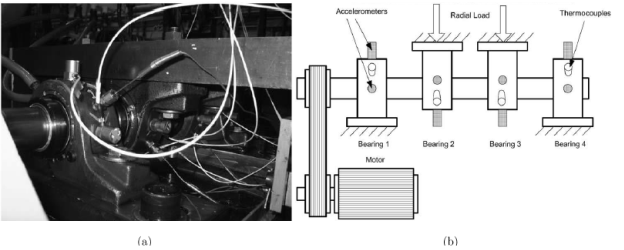
Fig. 1 Test rig used for recording vibration data (a) Photograph (b) Schematic (Courtesy: Prognostics Center of Excellence, NASA & Intelligent Maintenance System, University of Cincinnati).
The vibration data used in this paper are from two states of bearing, healthy and faulty. Three kinds of faults are primarily considered. They are IRF, ORF and RED. The photographs of bearings from these fault categories are provided in Fig. 2. Each vibration data is of one second duration comprising 20480 samples. The total data set contains 120 recordings, 30 recordings from each category as healthy, Inner Race Failure (IRF), Roller Element Defect (RED) and Outer Race Failure (ORF). That means total data set comprises 30 recordings from healthy bearings and 90 recordings from faulty bearings.
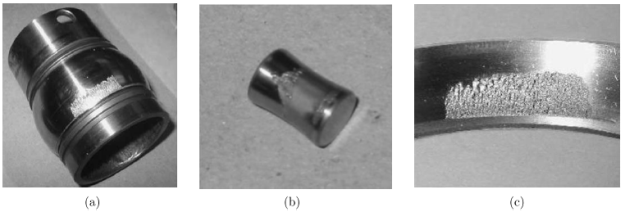
Fig. 2 Photographs of different bearing faults (a) IRF (b) RED (c) ORF. (Courtesy: Prognostics Center of Excellence, NASA & Intelligent Maintenance System, University of Cincinnati).
To make the base line spectrogram image more reliable, the spectrograms of 8 consecutive vibrations, recorded at 10 minutes interval, from a healthy bearing, are averaged before color mapping. The spectrogram is converted to image or visual form through color or grey scale mapping. For computing the spectrogram, the vibration signal 'x(n)' sampled at a rate of 'FS', is split into 'Q' segments of length 'M' samples each, given M<N (Oppenheim, Schafer, & Buck, 1989). The Discrete Fourier Transform (DFT) of the ith segment,
where W(l) is the window function. The power spectrum of each segment,
Discrete spectrogram ‘S’ of the vibration data,
As vibration data is highly non-stationary, Hamming window is used for computing the spectrogram in this paper. Number of samples in each segment is set to 4550 following the usual practice of setting M=N/4.5. The total number of samples, 'N' in each vibration recording is 20480 and the sampling frequency, 'FS' is equal to 20 KHz. The segments have 50% overlap. In summary, the short time power spectral density of the individual signal segments are cascaded to form the spectrogram. The similarity between the spectrogram image of the contextual vibration data and baseline spectrogram image is objectively quantified using SSIM. The SSIM between the base line spectrogram image 'X' and the spectrogram image 'Y' of the contextual vibration data is computed as (Wang, Bovik, Sheikh, & Simoncelli, 2004),
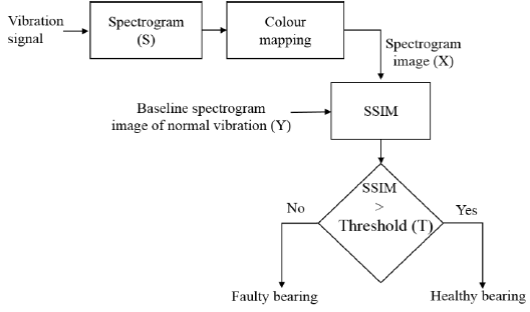
where C1= (K1L)2 & C2= (K2L)2, K1־K2«1. K1 and K2 are two arbitrary constants with values 0.01 and 0.03 respectively. μχ, μ γ , σχ 2, σy 2 and σχγ are the mean brightness of the baseline spectrogram image, mean brightness of the contextual spectrogram image, global variance of the baseline spectrogram image, global variance of the contextual spectrogram image and covariance between baseline and contextual spectrogram images, respectively. The attraction of the proposed method of spectrogram matching is, the colour mapped form of the spectrogram are blindly considered as images. So that the magnitude of the values in the 2D vector corresponding to the spectrogram and the scale of colour mapping become insignificant. The computation of spectrogram, color mapping, comparative evaluation of the spectrogram images with SSIM and the statistical evaluation of the SSIM values are performed in Matlab®. The statistical significance of SSIM between the spectrogram images of the contextual vibration data and baseline spectrogram image is tested for their ability to distinguish healthy, IRF, ORF and RED via Kruskal-Wallis. The schematic of the automated system for detecting bearing faults from the spectrogram image is furnished in Fig.3.
3. RESULT AND DISCUSSIONS
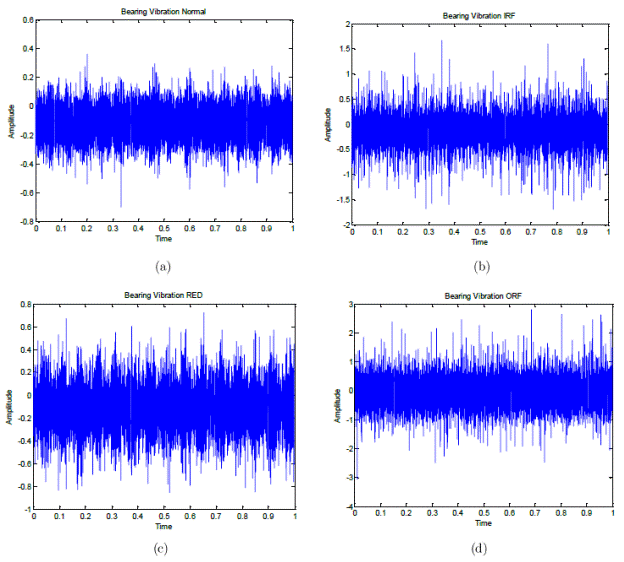
The wave shape of vibration corresponding to healthy, IRF, RED and ORF bearings are shown in Fig. 4 (a) - Fig. 4. (d). The wave patterns of vibrations corresponding to healthy, IRF, RED and ORF bearings are entirely different from each other. They differ in terms of the amplitude and randomness characteristics. For example, the vibration signal corresponding to RED is more random and its average amplitude is comparatively higher than other classes. The amplitude of vibrations produced by healthy bearings are comparatively less than the amplitude of vibrations produced by faulty bearings.
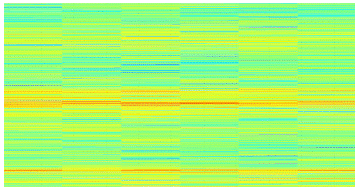
Spectrogram images of the vibration data corresponding to healthy, IRF, ORF and RED bearings are furnished in Fig. 5(a) - Fig. 5(d). The baseline spectrogram image of vibration data is shown in Fig. 6. The color distribution of the spectrogram images corresponding to the faulty bearings are completely different from the baseline in Fig. 6. It can be noted that the baseline spectrogram image (Fig. 6.) is similar to the spectrogram image of healthy class (Fig. 5(a)) than the spectrogram image of the fault classes (Fig. 5 (b) - Fig. 5. (d)).This is a clear indication that the color distribution of spectrogram images is a reliable feature to distinguish normal and faulty bearings.
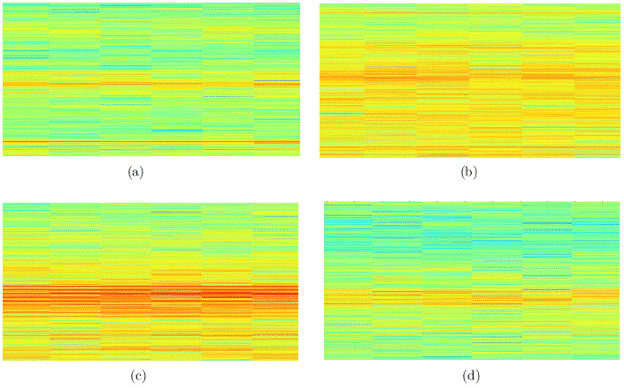
Fig. 5 Spectrogram images of bearing vibrations of normal and faulty cases (a) healthy bearing (b) IRF (c) ORF (d) RED.
From Table 1, the SSIM between spectrogram images of vibration data corresponding to healthy, IRF, ORF and RED and the baseline are 0.9997±4.49x10 5, 0.9967±0.0025, 0.9933±0.0067 and 0.9977+0.0013, respectively. It can be noted that, the SSIM between baseline and spectrogram images of vibration data corresponding to faulty bearings are significantly less than SSIM between baseline and spectrogram images of vibration data corresponding to healthy bearings. As far as numerical values of SSIM between baseline and spectrogram images of vibration data corresponding to healthy bearings are concerned, they are confined to a narrow range compared to numerical values of the SSIM between baseline and spectrogram images of vibration data corresponding to faulty bearings.
Table 1 Numerical values of SSIM between spectrogram images of vibration data corresponding to four classes of bearings, healthy, IRF, RED and ORF and the baseline.
| Sl No: | Healthy | IRF | RED | ORF |
|---|---|---|---|---|
| 1 | 0.9997 | 0.9997 | 0.9974 | 0.9988 |
| 2 | 0.9997 | 0.9992 | 0.9973 | 0.9990 |
| 3 | 0.9997 | 0.9994 | 0.9975 | 0.9987 |
| 4 | 0.9997 | 0.9993 | 0.9973 | 0.9945 |
| 5 | 0.9996 | 0.9997 | 0.9977 | 0.9948 |
| 6 | 0. 9996 | 0.9996 | 0.9974 | 0.9987 |
| 7 | 0. 9997 | 0.9994 | 0.9980 | 0.9992 |
| 8 | 0- 9997 | 0.9996 | 0.9983 | 0.9990 |
| 9 | 0- 9997 | 0.9993 | 0.9988 | 0.9989 |
| 10 | 0- 9996 | 0.9990 | 0.9987 | 0.9991 |
| 11 | 0.9997 | 0.9994 | 0.9989 | 0.9992 |
| 12 | 0.9997 | 0.9994 | 0.9992 | 0.9979 |
| 13 | 0.9997 | 0.9993 | 0.9990 | 0.9959 |
| 14 | 0.9997 | 0.9993 | 0.9987 | 0.9951 |
| 15 | 0.9997 | 0.9992 | 0.9985 | 0.9962 |
| 16 | 0.9997 | 0.9991 | 0.9988 | 0.9981 |
| 17 | 0.9997 | 0.9990 | 0.9989 | 0.9938 |
| 18 | 0.9996 | 0.9991 | 0.9985 | 0.9937 |
| 19 | 0.9997 | 0.9994 | 0.9983 | 0.9959 |
| 20 | 0.9996 | 0.9992 | 0.9979 | 0.9936 |
| 21 | 0.9997 | 0.9972 | 0.9975 | 0.9946 |
| 22 | 0.9997 | 0.9966 | 0.9970 | 0.9898 |
| 23 | 0.9997 | 0.9950 | 0.9974 | 0.9917 |
| 24 | 0.9997 | 0.9948 | 0.9972 | 0.9893 |
| 25 | 0.9997 | 0.9938 | 0.9972 | 0.9875 |
| 26 | 0.9997 | 0.9932 | 0.9972 | 0.9818 |
| 27 | 0.9997 | 0.9930 | 0.9970 | 0.9717 |
| 28 | 0.9996 | 0.9926 | 0.9963 | 0.9852 |
| 29 | 0.9996 | 0.9920 | 0.9957 | 0.9880 |
| 30 | 0.9996 | 0.9974 | 0.9927 | 0.9795 |
The ranges of the SSIM between the base line spectrogram image and a spectrogram image of the vibration data of different bearing states are as follows; healthy: 0.9996 - 0.9997, IRF: 0.9920 - 0.9997, ORF: 0.9717 - 0.9992 and RED: 0.9927 - 0.9992, respectively. If the SSIM between the base line spectrogram image and a spectrogram image of the vibration data to be analyzed is within the range of 0.9992 to 0.9996, it can be concluded that the bearing exhibit IRF. If the SSIM is specifically above 0.9997, it is a clear indication that the bearing is healthy. For SSIM values between 0.9996 and 0.9997 there can be a slight uncertainty that the bearing could be either healthy or of IRF. But only negligible number of training data exhibit this uncertainty. So that it does not hamper the accuracy of the fault detection. If the SSIM is below 0.9927, the underlying fault can be either IRF or ORF. An SSIM value below 0.9717 clearly represents IRF. This reveals that, from the SSIM values, faulty and healthy bearings can be distinguished easily.
The Box-Whisker plot of SSIM between spectrogram images of vibration data corresponding to four classes of bearings, healthy, IRF, ORF and RED and the baseline is illustrated in Fig. 7. The box whisker plot confirms the intuitions made from the numerical values of SSIM. The box of SSIM between baseline and spectrogram images of vibration data corresponding to healthy bearings is lying sufficiently apart spatially from the boxes of SSIM between baseline and spectrogram images of vibration data corresponding to faulty bearings.
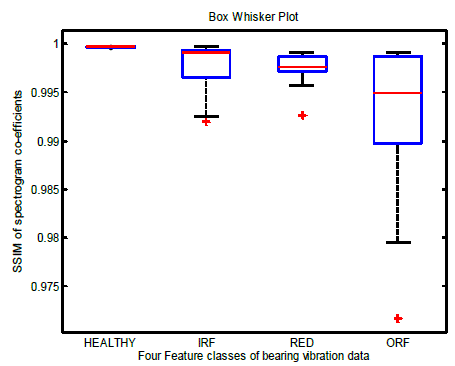
Fig. 7 Box-Whisker plot of SSIM between spectrogram images of vibration data corresponding to four classes of bearings, healthy, IRF, ORF and RED and the baseline.
The statistical significance of SSIM to distinguish healthy, IRF, ORF and RED is tested via Kruskal-Wallis. ANOVA table of the test is furnished in Table 2. The Chi-Square value (H) obtained from the Kruskal-Wallis test is 74.59, which is greater than the critical value 12.838, for a level of significance 0.05. The Chi-Square is outside the critical region and it denotes that the SSIM values corresponding to at least one of the bearing conditions could be different from others. From box whisker it has already been concluded that the class which differ from others in terms of SSIM is healthy bearings.
Table 2 Kruskal-Wallis ANOVA table.
| Source | Sum of Squares (SS) |
Degree of Freedom (DF) |
Mean Square (MS) |
Chi-Square value (H) |
Probability value (p) |
|---|---|---|---|---|---|
| Columns | 89438.1 | 3 | 29812.7 | 74.59 | 4.43693x10⁻¹⁶ |
| Error | 53251.4 | 116 | 459.1 | ||
| Total | 142689.5 | 119 |
The SSIM corresponding to the vibrations acquired from normal and faulty bearings differ with a 'P' value of 4.43693x10⁻¹⁶.
The feasibility of the proposed method to distinguish faulty bearings is tested on one more data set also. The second set of vibration data is taken from the Case Western Reserve University Bearing Data Center Website (Lei, Long, Junfeng, & Guoliang, 2016). In their test set up, 6203-2RS JEM SKF, deep groove ball bearing was fixed to a shaft, driven by Reliance Electric motor. The bearing has a pitch diameter of 1.122 inches, roller diameter of 0.2656 inches, thickness of 0.4724 inches, fault diameter of 0.021 inches and inner and outer diameter of 0.6693 and 1.5748 inches, respectively. During the acquisition, the shaft and bearing assembly was run with varying load/RPM. The RPM was 1730, 1750, 1772 and 1797 for a motor load of OHP, 1HP, 2HP and 3HP, respectively. Data was collected at above RPMs for normal bearings and bearing with fan end defects at a sampling frequency of 12 KHz. Each vibration data is of one second duration consisting 12000 samples. The total data set contains 16 recordings, 4 recordings from each category as healthy, IRF, RED and ORF. That means, total data set comprises 4 recordings from healthy bearings and 12 recordings from faulty bearings.
The numerical values of SSIM between spectrogram images of vibration data corresponding to four classes of bearings, healthy, IRF, RED and ORF and the baseline of the above data set is given in Table 3.
Table 3 SSIM between spectrogram images of vibration data corresponding to four classes of bearings, healthy, IRF, RED and ORF and the baseline.
| Sl No: | Healthy | IRF | RED | ORF |
|---|---|---|---|---|
| 1 | 0.9960 | 0.9887 | 0.9954 | 0.9964 |
| 2 | 0.9985 | 0.9866 | 0.9946 | 0.9973 |
| 3 | 0.9986 | 0.9882 | 0.9951 | 0.9959 |
| 4 | 1.0000 | 0.9864 | 0.9953 | 0.9958 |
The sensitivity, specificity and accuracy obtained for the proposed method on the above data set is 85.71%, 100% and 87.50 %, respectively. However the number of data set available in the second repository is less. It is found that the observation on the data set provided by NASA holds good for the second data set as well.
4. CONCLUSIONS
A non-intrusive method for the fault diagnosis of bearing systems, based on pattern matching of spectrogram images of the contextual vibration data, whose underlying bearing status is unknown, with spectrogram images of the baseline or reference vibration data which belongs to a normal bearing, making use of SSIM was proposed in this paper.
It was observed that, if the SSIM between the spectrogram image of the contextual vibration and baseline is specifically above 0.9996, it is a clear indication that the bearing is healthy. The SSIM corresponding to the vibrations acquired from normal and faulty bearings differ with a 'P' value of 4.43693xl0-16. The proposed method is able to detect faulty bearing with 95.74% sensitivity, 96% accuracy and 100% specificity. Through the proposed method, subjectivity in comparative interpretation of spectrogram was fully avoided. The method can be employed for non-intrusive inspection of bearing systems, their fault diagnosis and condition monitoring. The system can be modified by incorporating reference spectrogram images from each fault category. So that, the spectrogram image of the contextual vibration can be compared with multiple references. The contextual vibration can be categorized as the class of the reference spectrogram with which, the spectrogram of the contextual vibration exhibited maximum similarity. Perhaps, the wavelet based feature extraction may help to identify the type of bearing faults as well.


 nueva página del texto (beta)

