


 nova página do texto(beta)
 Inglês (pdf)
 Artigo em XML
 Referências do artigo
 Enviar este artigo por email
 Citado por SciELO
  Similares em
SciELO
Similares em
SciELO 
 Permalink
1.INTRODUCTION
Developing nation such as Nigeria often suffer from discharge of heavy metal ions into fresh water, soil and marine environment causing serious pollution problems.
Example of this is the Zamfara (a state in Nigeria) lead poisoning, which is the worst heavy metal incidence in the Nigerian records that claimed the lives of over 500 children within seven months in 2010 (Galadima Garba, Leke, Almustapha, & Adam 2011; Galadima & Garba, 2012). Several efforts have been made in time past to treat polluted or waste water but most of these efforts have suffered from different drawbacks (Adewuyi & Pereira, 2016; Basra, Iqbal, Ur-Rehman, & Ejaz, 2014) suffered from different drawbacks (Adewuyi & Pereira, 2016; Basra, Iqbal, Ur-Rehman, & Ejaz, 2014), mainly cost ineffectiveness and inability to setup and maintain such efforts in poor developing countries of which Nigeria is inclusive.
The choice of method for wastewater treatment is important (Mirbolooki, Amirnezhad, & Pendashteh, 2017) which may have to depend on the concentration, type, and nature of the pollutants present in the wastewater. Among all the methods that have been reported in the past, adsorption still remains less expensive; it can be easily setup and maintained and capable of averting large amount of sludge usually formed during waste water treatment (Bhattacharyya & Gupta, 2006). These properties have made adsorption more promising and attractive in developing nations which are much more affected by water pollution. The type of adsorbent used during adsorption process plays a key role in making the process a success (Pouya, Abolghasemi, Fatoorehchi, Rasem, & Hashemi, 2016). Such adsorbent is expected to be efficient, highly selective, non-toxic, regenerative, readily available and easily recovered from the treated water system. Clay such as kaolinite is a potential material that can function in this regard as an adsorbent for treating waste water (Fan et al., 2009; Nishikiori et al., 2009). Most neat clay have been reported not to be as efficient as activated carbon and zeolite due to their low surface area, low regeneration tendency and poor particle recovery after being spent (Borisover, Gerstl, Burshtein, Yariv, & Mingelgrin, 2008; Laouchedi, Bezzazi, & Aribi, 2017; Unuabonah & Taubert, 2014). However, when modified, the neat clay has the potential of being more efficient than activated carbon and zeolite.
Kaolinite clay is an abundant resource in Nigeria which has received little attention as an adsorbent because of its low cation exchange capacity (3-15 meq/100 g) and its small surface area which is ≤ 20.0 m2/g (Bhattacharyya & Gupta, 2008; Guerra, Airoldi, & de Sousa, 2008; Manohar, Noeline, & Anirudhan, 2006). There has been report that these challenges may be improved via modification such as activation, intercalation and or chemical surface grafting (Frost, Van Der Gaast, Zbik, Kloprogge, & Paroz, 2002; Kho & Dixon, 200: Sidheswara, Bhat, & Ganguli, 1990). Preferably, modification of kaolinite clay can be achieved by either intercalation or surface grafting (Guerra et al., 2008). Although there has been a number of studies on kaolinite clay for the removal of heavy metals (Bhattacharyya & Gupta, 2008; Gupta & Bhattacharyya, 2008), there is still need to improve on its adsorption capacity via simple and green methods.
The present study investigated the surface modification of KC as a low-cost adsorbent for the treatment of aqueous solution containing Pb2+ and Cd2+ ions. The effects of adsorbent weight, change in temperature, pH, initial concentration of Pb2+ and Cd2+ ions and contact time on the removal of Pb2+ and Cd2+ ions from the aqueous solution by KC and MKC were investigated as well as the mechanism of uptake of these heavy metal ions.
2. MATERIALS AND METHODS
2.1 MATERIALS
KC used was collected from the Redemption Camp at Mowe, Ogun state, Nigeria. After collection, particulate matters such as stones and other metal particles were separated from KC which was further purified using method described by Moore and Reynolds. All chemicals used in this study were purchased from Sigma-Aldrich (Brazil). Experimental solutions containing heavy metal ions were prepared by dissolving appropriate amount of nitrates (Cd(NO3)2 and Pb(NO3)2) in deionized water to desired concentrations.
2.2 MODIFICATION OF KC
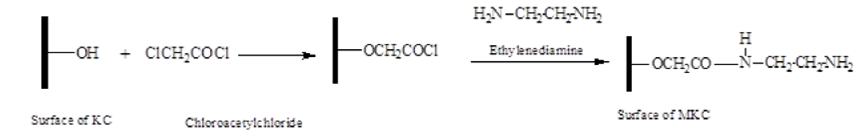
Mixture of chloroacetic acid (0.06 mole), thionylchloride (0.08 mole) and chloroform (50 mL) was heated to 75oC for 30 min to form chloroacetylchloride (Scheme 1). A 20 g of KC was added to the chloroacetylchloride (after the removal of excess thionylchloride under reduced pressure) which was allowed to react for 6 h under constant stirring at 90oC and finally cooled in ice. Ethylenediamine (100 mL) was added to the solid mass left and stirred for 12 h at 100oC under reflux. The unreacted ethylenediamine was gently removed; cold deionized water was added to the product left and centrifuged thrice for 10 min at 8,500 rpm to remove excess ethylenediamine. The MKC obtained was oven dried at 60oC for 48 h (Scheme 2) with about 98% yield.

2.3 CHARACTERIZATION
The functional groups in KC and MKC were determined using FTIR (Perkin Elmer, spectrum RXI 83303). KC and MKC were blended with KBr, pressed into pellets and analyzed in the range of 400 - 4500 cm−1.
Elemental analysis was achieved using Perkin Elmer series II CHNS/O analyzer (Perkin Elmer, 2400, USA) while information of the surface morphology was obtained using SEM-EDS (FEI quanta 200 3D, dual beam FEG, model EDAX EDS brand, Bruker) with powdered samples being coated with gold using the sputtering technique in order to increase electrical conductivity and the quality of the micrographs. The surface area of KC and MKC was determined by nitrogen adsorption using the BET method in a Quantachrome Autosorb IQ2 instrument. X-ray diffractometer (XRD-7000X-Ray diffractometer, Shimadzu) with filtered Cu Kα radiation operated at 40 kV and 40 mA was used to obtain the X-ray diffraction pattern. The XRD pattern was recorded from 10 to 80° (2θ), with a scanning speed of 2.00°/min. Particle size distribution and zeta potential were recorded using a zeta potential analyzer (DT1200, Dispersion technology) at 25oC while observing general calculation model for irregular particles. Several measurements were taken using Dispersion technology-AcoustoPhor Zeta size 1201 software (version 5.6.16).
2.4 EQUILIBRIUM STUDY
Batch adsorption equilibrium study was carried out by contacting 0.5 g of KC and MKC separately with 250 mL varying concentration of Cd2+ and Pb2+ (10 - 100 mg/L) solutions in different 500 mL beaker at 298 K and 200 rpm for 3 h. Several agitations at 298 K and 200 rpm were repeated in order to establish the equilibrium time. Equilibrium concentration of Cd and Pb were determined by withdrawing clear samples at different interval and analyzing using Atomic Absorption Spectrometer (Varian AA240FS).
2.5 EFFECT OF KC AND MKC WEIGHT ON ADSORPTION OF Cd 2+ AND Pb 2+ IONS
Effect of KC and MKC weight was evaluated by varying the weight of KC and MKC from 0.1-1.0 g in 250 mL of 100 mg/L solution for 3 h. Concentrations of Cd2+ and Pb2+ were established after several equilibrium studies. Clear supernatant were withdrawn at different time interval and analyzed using Atomic Absorption Spectrometer (Varian AA240FS).
2.6 EFFECT OF PH ON ADSORPTION OF Cd 2+ AND Pb 2+ IONS BY KC AND MKC
A 0.5 g of KC and MKC was separately agitated with 100 mg/L solution of Cd2+ and Pb2+ ions. This was adjusted over a pH range of 1.70 - 6.60 using 0.1 M HCl and 0.1 M NaOH and stirred at 200 rpm in a 500 mL beaker for 3 h. Clear samples were withdrawn at different intervals and analyzed using Atomic Absorption Spectrometer (Varian AA240FS).
2.7 THERMODYNAMIC STUDY
Thermodynamics of the adsorption of Cd2+ and Pb2+ on KC and MKC was carried out at different initial concentrations (10 to 100 mg/L) and temperatures ranging from 298 to 333 K. The solutions were stirred at 200 rpm in a 500 mL beaker for 3 h. Clear samples were withdrawn at different intervals and analyzed using Atomic Absorption Spectrometer (Varian AA240FS).
3. RESULT AND DISCUSSION
3.1 CHARACTERIZATION
The XRD results in Fig. 1 reveals prominent peaks at 7.19 Å, 4.11 Å, 3.58 Å, 3.35 Å, 2.98 Å, 2.29Å, 1.82 Å, and 1.49 Å which correspond to kaolinite, quartz, tridymite, kaolinite, quartz, quartz + alunite, quart and kaolinite.

Both spectra of KC and MKC looks similar suggesting that the d-spacing of the crystal lattice of KC was not significantly altered as similar peaks were found in both KC and MKC. This observation suggests the modification to be a surface phenomenon.
Structure of kaolinite minerals is expected to have a sheet of corner-sharing tetrahedral linked with a plane of oxygen and hydroxyl groups which are referred to as inner hydroxyls (Saikia & Parthasarathy, 2010). The OH stretching for kaolinite were seen in both KC and MKC at 3697, 3620 and 3452 cm-1 as reported by Farmer (1974); this is presented in Fig. 2. Band at around 3620 cm-1 was attributed to the inner hydroxyls while band at 3697 cm-1 was considered to be vibrational frequencies of the external hydroxyls. The band observed at 3452 cm-1 in KC was taken to be the OH vibrational mode for natural hydrous silicates (Saikia & Parthasarathy, 2010). This peak at 3452 cm-1 in KC became broader in MKC which appeared at 3439 cm-1 suggesting an overlap of the hydroxyl peak with the amine peak formed in MKC. The peaks at 1033 cm-1 in KC and MKC may be due to the interference from alunite and or quartz while peak at 914 cm-1 could be due to Al-OH vibrational bending. The doublet at 792-777 cm-1 in KC and MKC may be due to Si-O-Si inter tetrahedral bridging bonds (McMillan, Wolf, & Poe, 1992). The Al-O-Si and Si-O-Si deformations were seen at 536 and 466 cm-1; respectively while the Si-O frequency was seen at 694 cm-1 in both KC and MKC. The CHN analysis results showed the hydrogen content to increase from 2.90 % in KC to 3.96% in MKC. Carbon and nitrogen were found to be 8.88 and 1.20 %; respectively in MKC. The increase in hydrogen content and the presence of carbon and nitrogen in MKC suggests that modification had taken place.

The surface morphology and EDS results of KC and MKC are presented in Fig. 3 and Fig. 4; respectively. The surface morphology of KC is different from that of MKC according to the SEM images in Fig. 3. The flaky-like crystal and fluffy appearance of KC was seen in the micrograph while MKC appears to be fluffier with a more consistent texture than KC. The EDX results for KC and MKC are presented in Fig. 4 which reveals their composition. The BET surface area reveals the surface area of KC to be 16 m2/g while that of MKC was found to be 13 m2/g. The particle size distribution is shown in Fig. 5; this was found to be bimodal for KC and monomodal for MKC. The zeta potential for KC and MKC are presented in Fig. 6. As previously reported (Adewuyi & Pereira, 2017), values obtained for zeta potential helped in quantifying the charges at the surfaces of KC and MKC which suggested the degree of stability of KC and MKC and their electrostatic repulsion with other charged particles (Hanaor, Michelazzi, Leonelli, & Sorrell, 2012). In this study, the zeta potential reduced as pH values increased below the pH of 6. In the case of KC, the zeta potential increased as pH increased above 6 but later dropped at pH above 9. In MKC, the zeta potential only slightly increased above pH 6 but dropped immediately. As pH further increased, the zeta potential of MKC kept reducing until pH of 12 when the zeta potential began to increase again. This observation may be due to the presence of the amine groups at the surface of MKC. The distribution of the zeta potential at various pH along the surfaces of KC and MKC has revealed that both KC and MKC are stable in liquid medium, mainly where solid-liquid interaction exists. Moreover, materials with high zeta potential (negative or positive) are known to be better electrically stabilized than materials with low zeta potentials which tend to coagulate or flocculate (Hanaor et al., 2012).


3.2 ADSORPTION
The effect of contact time on the amount of Cd2+ and Pb2+ ions adsorbed is presented in Fig. 7. The adsorption capacity was seen to increase with time. The amount of Cd2+ and Pb2+ ions adsorbed in mg/g by KC and MKC were calculated using equation:

Fig. 7 Adsorption capacity of KC and MKC towards Cd and Pb at different concentration (25-100 mg/L) and time (298 K).
Where qe is the amount adsorbed in mg/g,
Pseudo-first-order model was given as:
On rearrangement Eq. 2 becomes
The linearized form of the kinetic rate expression for a pseudo-second-order model is given as:
where qe is the amount of Pb2+ or Cd2+ adsorbed at equilibrium (mg/g), qt is the amount of Pb2+ or Cd2+ (mg/g) adsorbed at time t (min) and k1 (min-1) and k2 (g/mg/min) are the rate constants of the pseudo-first-order and pseudo-second-order models, respectively; for sorption of Pb2+ and Cd2+ ions. Plot of log (qe-qt) against time t, gave a linear relationship for pseudo-first-order model from which k1 and equilibrium sorption capacity (qe), were calculated from the slope and intercept respectively. For the pseudo-second-order, the parameters ho which is the initial sorption rate and k2 were determined from the slope and intercept of a plot of
Table 1 compares the Kad, ho, qe and r2 associated with pseudo-first-order and pseudo-second-order equations for sorption of Cd2+ ions on KC and MKC. Kad, ho and qe increased with increase in concentration of Cd2+ ions. In both KC and MKC pseudo-second-order exhibited a better r2 value indicating that the order of the adsorption of Cd2+ on KC and MKC follows a pseudo-second-order. Moreover, the qe, calculated values for pseudo-second-order agreed better with the experimental qe values which further supported the claim that the present adsorption process follows pseudo-second-order.
The adsorption capacity of KC and MKC was found higher for Pb2+ than Cd2+ which may be due to the higher ionic radius of Pb2+ (119 pm) than that of Cd2+ (95 pm).
Since the ionic radius of Pb2+ is higher, the outermost electrons are more freely available for interaction with KC and MKC unlike in the case of Cd2+ where the inward pull from the nucleus on the outermost electrons is higher. The adsorption capacity for Cd2+ ions increased from 8.01 mg/g in KC to 24.41 mg/g in MKC. The present adsorption capacity by MKC towards Cd2+ is higher than values reported for Trichoderma viride biomass (Singh et al., 2010), modified corn stalk (Zheng, Dang, Yi, & Zhang, 2010), and Lentinus edodes (Zhang, Zeng, Ma, He, & Falandysz, 2012) but lower than value reported by Yuan et al (2016) for biogenic selenium nanoparticles (59.7 mg/g). The results for Pb2+ ions are presented in Table 2. The qe and ho increased with increase in concentrations. The r2 values were also better for pseudo-second-order than pseudo-first-order.
Table 1 Comparison between Kad, qe and r2 associated with pseudo-first -order and pseudo-second-order equations for sorption of Cd2+ ions on KC and MKC.
| Initial Cd2+ (mg/L) |
Pseudo-first-order (KC) | Pseudo-second-order (KC) | ||||||
| K1 (min-1) | qe, cal (mg/g) | r2 | K2 (g/mg/min) | qe, cal (mg/g) | r2 | ho (mg/g/min) | qe, Exp (mg/g) | |
| 25 | 0.0083 | 1.08 | 0.968 | 0.0370 | 1.84 | 0.9851 | 0.1256 | 1.75 |
| 50 | 0.0064 | 2.53 | 0.9573 | 0.0104 | 4.19 | 0.9639 | 0.1815 | 4.00 |
| 100 | 0.0085 | 4.01 | 0.9521 | 0.0116 | 8.38 | 0.9935 | 0.8127 | 8.01 |
| Initial Cd2+ (mg/L) |
Pseudo-first-order (MKC) | Pseudo-second-order (MKC) | ||||||
| K1 (min-1) | qe, cal (mg/g) | r2 | K2 (g/mg/min) | qe, cal (mg/g) | r2 | ho (mg/g/min) | qe, Exp (mg/g) | |
| 25 | 0.0042 | 2.69 | 0.9266 | 0.0062 | 6.68 | 0.9580 | 0.5295 | 6.17 |
| 50 | 0.0066 | 5.85 | 0.9813 | 0.0063 | 13.02 | 0.9720 | 1.0717 | 12.14 |
| 100 | 0.0091 | 6.64 | 0.8000 | 0.0122 | 25.00 | 0.9980 | 7.6104 | 24.41 |
Table 2 Comparison between Kad, qe and r2 associated with pseudo-first -order and pseudo-second-order equations for sorption of Pb2+ ions on KC and MKC.
| Initial Pb2+ (mg/L) |
Pseudo-first-order (KC) | Pseudo-second-order (KC) | ||||||
| K1 (min-1) | qe, cal (mg/g) | r2 | K2 (g/mg/min) | qe, cal (mg/g) | r2 | ho (mg/g/min) | qe, Exp (mg/g) | |
| 25 | 0.0221 | 2.26 | 0.8644 | 0.0327 | 2.70 | 0.9918 | 0.2388 | 2.45 |
| 50 | 0.0046 | 6.76 | 0.9754 | 0.0082 | 7.29 | 0.9675 | 0.4371 | 7.00 |
| 100 | 0.0045 | 17.60 | 0.9579 | 0.0027 | 21.00 | 0.9426 | 1.1779 | 24.75 |
| Initial Pb2+ (mg/L) |
Pseudo-first-order (MKC) | Pseudo-second-order (MKC) | ||||||
| K1 (min-1) | qe, cal (mg/g) | r2 | K2 (g/mg/min) | qe, cal (mg/g) | r2 | ho (mg/g/min | qe, Exp (mg/g) | |
| 25 | 0.0056 | 4.03 | 0.9687 | 0.0075 | 9.17 | 0.9888 | 0.6265 | 8.58 |
| 50 | 0.0055 | 4.55 | 0.9273 | 0.0093 | 22.12 | 0.9984 | 4.5620 | 22.00 |
| 100 | 0.0021 | 6.90 | 0.8383 | 0.0039 | 35.59 | 0.9888 | 4.9358 | 36.41 |
The adsorption capacity also increased from 24.75 mg/g in KC to 36.41 mg/g in MKC. The value obtained for MKC towards Pb2+ is higher than values reported for Walnut (Bulut & Tez, 2007), CuO nanostructures (Farghali, Bahgat, Allah, & Khedr, 2013) and Sugar cane saw dust (Putra et al., 2014) but lower than that of Cassia fistula seed carbon (Senniappan, Palanisamy, Shanmugam, & Gobalsamy, 2017). This observed increase in the adsorption capacity after functionalization may be attributed to the presence of the amide function group. This suggests that the amide group may have participated in the adsorption process via cation exchange mechanism as proposed in Scheme 3. It was observed that the BET surface area reduced after surface functionalization whereas the adsorption capacity towards Cd2+ and Pb2+ increased. This observation revealed that the surface functionalization of KC played an important role in the adsorption process. However, the surface functionalization was effective enough to cover up for the reduction in BET surface area which is about 18.75% (from 16 m2/g to 13 m2/g).
Moreover, the reduction in surface area may not have seriously affected or reduced the amounts of specific active sites on KC which were involved in the adsorption process.
The data were further subjected to the Elovich model equation has expressed below:

where α is the initial adsorption rate (mg/g min) and β is the adsorption constant (g/mg). A plot of qt versus ln t gave a linear trace with a slope of (1/β) and an intercept of 1/β ln(αβ). The values of α and β are presented in Table 3.
Table 3 Kinetic model parameters for the sorption of Pb2+ and Cd2+ on KC and MKC.
| Model | Parameter | KC (Cd) | MKC (Cd) | KC (Pb) | MKC (Pb) |
| Liquid film diffusion |
Kid (g/mg/min) r2 |
0.0040 0.9411 |
0.0029 0.9095 |
0.0088 0.9276 |
0.0017 0.8000 |
| Elovich | β (g/mg) α (mg/g/min) r2 |
0.8171 6.4115 0.9823 |
0.3427 21.6890 0.8031 |
0.6930 32.2813 0.9161 |
0.6744 41.4188 0.9734 |
| Intra-particle diffusion |
Kid (mg/g/min1/2) r2 |
0.4465 0.9036 |
1.3350 0.9406 |
0.6173 0.9589 |
0.5142 0.9000 |
The diffusion distribution of Cd2+ and Pb2+ ions on KC and MKC was evaluated using intraparticle diffusion model; this was considered in term of the total surface area of KC and MKC which may be taken to be made up of both external and internal surfaces. The intraparticle diffusion model was estimated as described by Srivastava et al (Srivastava, Swamy, Mall, Prasad, & Mishra, 2006):
From equation 6, kid is the intraparticle diffusion rate constant (mg/g/min0.5) and C (mg/g) is a constant that describes the thickness of the boundary layer. On plotting qt versus T0.5, a linear plot was obtained indicating that sorption process was controlled by intra-particle diffusion. The respective Kid and r2 values are shown in Table 3. Liquid film diffusion model was also used to study the movement of Cd2+ and Pb2+ ions from the liquid phase up to the solid phase boundary during the adsorption process.
Where F is defined as:
Kid is the adsorption rate constant and t is time. A linear plot of -In (1-F) versus t was obtained which suggests that the kinetics of the sorption process may also be influenced by diffusion through the liquid surrounding KC and MKC (Ekpete, Horsfall & Spiff, 2012a). The effect of adsorbent weight on the sorption of Cd2+ and Pb2+ ions are presented in Fig. 8; it was noticed that the adsorption capacity of KC and MKC decreased as their weight increases.
Fig. 9 shows the effect of pH on adsorption process. It was observed that the capacity of KC and MKC to remove Cd2+ and Pb2+ ions from solution increased with increase in pH.

Fig. 8 Effect of weight of KC and MKC on adsorption of CD2+ and Pb2+ from aqueous solution (100 mg/g) at 298 K.

3.3 ADSORPTION ISOTHERM
It is paramount to establish the most suitable correlation for the equilibrium adsorption curve for the sorption of Cd2+ and Pb2+ ions on KC and MKC. To this effect, data obtained were subjected to some isotherm equations, namely; Langmuir, Freundlich and Temkin. Of the three equations, Freundlich and Temkin fitted well for the isotherm plots. The Freundlich isotherm is characteristic of heterogeneous surface, this is expressed as:
The linearized form is given as:
K f (mg/g) is the Freundlich isotherm constant which indicates adsorption capacity, Ce (mg/L) is the equilibrium concentration of Cd2+ and Pb2+, qe (mg/g) is the amount of Cd2+ and Pb2+ adsorbed at equilibrium and n is the adsorption intensity. Parameters K f and n play important role in understanding the adsorption process. When n = 1, then the partition between the liquid and solid phases are independent of the concentration; If 1/n = <1, it indicates a normal adsorption but when 1/n = >1, it indicates cooperative adsorption (Goldberg, Tabatabai, Sparks, Al-Amoodi, & Dick, 2005). The results obtained for the Freundlich parameters are presented in Table 4 indicating the values of 1/n for Cd2+ and Pb2+ ions to be 1 suggesting a linear adsorption isotherm.
The Temkin isotherm contains a parameter that explicitly takes the adsorbate-adsorbent interaction into consideration. This is expressed as:
Note that:
From equations 12 and 13, B (J/mol) is the constant related to heat of adsorption, A (L/g) is the Temkin isotherm equilibrium binding constant, b is the Temkin isotherm constant, R is the gas constant (8.314 J/mol/K) and T is the absolute temperature (K). The parameters were determined from the slope and intercept of a linear plot of qe against ln Ce. The values of B, A and b are shown in Table 4. MKC had higher heat of adsorption than KC which is higher for Pb2+ than Cd2+ ions.
Table 4 Freundlich and Temkin isotherm constants for the sorption of Pb2+ and Cd2+ ions by KC and MKC.
| Freundlich model | ||||
| Kf(mg/g) | KC (Cd) | MKC (Cd) | KC (Pb) | MKC (Pb) |
| 1.9997 | 2.0002 | 2.0000 | 1.9981 | |
| n | 1.0000 | 0.9999 | 0.9999 | 1.0002 |
| r2 | 0.9998 | 1.0000 | 0.9998 | 1.0000 |
| Temkin | ||||
| KC (Cd) | MKC (Cd) | KC (Pb) | MKC (Pb) | |
| A | 5.8892 | 61.3400 | 69.225 | 98.314 |
| B | 4.8731 | 22.041 | 29.759 | 31.361 |
| b | 508.4181 | 112.4074 | 83.2545 | 79.0017 |
| r2 | 0.9598 | 0.9984 | 0.9732 | 0.9960 |
3.4 SORPTION THERMODYNAMICS
Experimental data obtained from the effect of temperature on the sorption of Cd2+ and Pb2+ ions on KC and MKC were analyzed to determine some thermodynamic parameters such as Gibb’s free energy change (∆Go), enthalpy change (∆Ho) and entropy change (∆So). The adsorption equilibrium constant bo was estimated from the expression (Ekpete, Horsfall, & Spiff, 2012b):
where Co and Ce are the initial and equilibrium concentrations of Cd2+ and Pb2+ ions, R is universal gas constant (8.314 J mol-1 K-1) and T is the absolute temperature in K. The values of ∆Ho and ∆So were calculated from the slope and intercept of the linear plot of ln bo against reciprocal of temperature (1/T). The values obtained for ∆Go was positive nature which shows that energy is required to promote the adsorption of these metal ions on KC and MKC. The values of ∆Go for KC and MKC are presented in Table 5 and Table 6 respectively. In the case of KC the value of ∆Go increased with increase in temperature for Cd2+ ions while for Pb2+ ions, the value obtained decrease with increase in temperature. Values of ∆Ho and ∆So for KC and MKC are shown in Table 7. ∆So is negative for the sorption of Cd2+ ion on KC (-0.0055 KJ mol-1K-1) and MKC (-0.0001 KJ mol-1K-1) whereas in the case of Pb2+ ion, the value was positive for KC (0.0016 KJ mol-1K-1) and MKC (0.0081 KJ mol-1K-1).
∆Ho was found positive for Cd2+ ion suggesting an endothermic process while the process was negative in the case of Pb2+ ion suggesting exothermic process.
Table 5 ΔG and qe obtained at various temperatures for KC.
| Cd | ||||
|---|---|---|---|---|
| T (K) | 298 | 313 | 323 | 333 |
| qe (mg/g) | 8.008 | 12.845 | 16.180 | 19.618 |
| ∆G (kJ mol-1K-1) | 0.4323 | 0.7726 | 1.0497 | 1.3793 |
| Pb | ||||
| T (K) | 298 | 313 | 323 | 333 |
| qe (mg/g) | 24.746 | 17.115 | 11.013 | 7.160 |
| ∆G (kJ mol-1K-1) | 1.6922 | 1.0904 | 0.6679 | 0.4280 |
Table 6 ΔG and qe obtained at various temperatures for MKC.
| Cd | ||||
|---|---|---|---|---|
| T (K) | 298 | 313 | 323 | 333 |
| qe (mg/g) | 23.569 | 18.138 | 15.745 | 11.146 |
| ∆G (kJ mol-1K-1) | 1.6595 | 1.1723 | 1.0156 | 0.6982 |
| Pb | ||||
| T (K) | 298 | 313 | 323 | 333 |
| qe (mg/g) | 36.410 | 6.250 | 5.370 | 4.980 |
| ∆G (kJ mol-1K-1) | 3.2265 | 0.3474 | 0.3051 | 0.2904 |
4. CONCLUSION
The present study evaluated the surface modification of kaolinite clay as a low-cost adsorbent for the removal of Pb2+ and Cd2+ ions from aqueous solution. Adsorption of these metals was found to be monolayer, second-order-kinetic and controlled by both intra-particle diffusion and liquid film diffusion. The adsorption capacity of the kaolinite clay towards Pb2+ and Cd2+ increased after modification with ethylenediamine. This presents MKC as a suitable adsorbent for the removal of Pb2+ and Cd2+ from aqueous solution of waste water.

