


 nueva página del texto (beta)
 Inglés (pdf)
 Artículo en XML
 Referencias del artículo
 Enviar artículo por email
 Citado por SciELO
  Similares en
SciELO
Similares en
SciELO 
 Permalink
1. INTRODUCTION
Voice activity detection (VAD) tries to detect speech segments from background noises. It is an important speech processing technique which is used in various applications such as automatic speech recognition (ASR) (Hernández-Mena, Meza-Ruiz, & Herrera-Camacho, 2017; Karray & Martin, 2003), mobile communications (Freeman, Cosier, Southcott, & Boyd, 1991), VoIP (Sangwan et al., 2002; Zhang, Gao, Bian, & Lu, 2005), and noise suppression in digital hearing aids (Itoh & Mizushima, 1997). The outcome of VAD is usually binary decisive, which indicate absence of speech (noise only segments indicated as HRns) or presence of speech (noisy speech segments, indicated as HRs). The challenge to the VAD is to detect speech under low signal-to- noise ratio (SNR) scenarios and also under the influence of nonstationary noises. During the past few decades, researchers have tried many approaches to improve the VAD performance under low SNRs and for various types of noises. Still there is no unique feature or set of features and algorithms.
The performance of the VAD algorithm relies on two key stages namely, features to VAD and HRs and HRns classification. Simple features such as short-term energy (Hsieh, Feng, & Huang, 2009), zero crossing rate (Kotnik, Kacic, & Horvat, 2001) were considered in early days. But the performance lacks at low SNR levels as well as with non-stationary noises. These drawbacks are overcome by robust features like spectrum (Davis, Nordholm, & Togneri, 2006), autocorrelation (Shi, Zou, & Liu, 2014), power in the bandlimited region (Marzinzik & Kollmeier, 2002), wavelet coefficients (LEE, 2006), higher-order statistics(Nemer, Goubran, & Mahmoud, 2001), etc. These robust features shows better performance when the SNR levels are above 10dB assuming that the background noise is stationary for certain period but still lacking at low SNR levels, because at low SNR levels the structural and spectral properties of the speech signals get distorted (Khoa, 2012). Few algorithms improve VAD performance by estimating noise during this stationary period which is computationally expensive. So in order to improve the performance of VAD, entropy based features were considered. Entropy is a powerful tool to detect speech from noisy signal which was first introduced by Shannon to estimate the uncertainty in a signal (Wu & Wang, 2005). This can be used in both time and frequency domain called spectral entropy. Similarly fuzzy entropy (FuzzyEn) which is a modified algorithm of sample entropy (SampEn) (Chen, Wang, Xie, & Yu, 2007; Chen, Zhuang, Yu, & Wang, 2009; Richman, & Moorman, 2000) is based on fuzzy set theory and is used to measure the complexity of the time series data. FuzzyEn retains certain characteristics of SampEn like excluding self-matches and also it overcomes the limitations of SampEn by using an exponential function to select or discard the similarities between the two vectors rather using a Heaviside function. Additionally, by inheriting the similarity measurement using fuzzy sets, the limitations cited by SampEn which uses the Heaviside function as the tolerance to select or discard the similarities between the two vectors was overcome by FuzzyEn, as FuzzyEn transits smoothly through varying parameters with the use of the exponential function.
Finally, to classify for HRs and HRns, an adaptive threshold based on the features extracted from the speech signals can be used or with the use of machine learning algorithms (MLA). Different classifiers based on machine learning algorithms (MLA) are also invoked for HRs and HRns classification. Neural networks have been widely used, but its training procedures are cost expensive. Another popularly used MLA is the support vector machine (SVM) (Shabat & Tapamo, 2017; Nazir, Majid-Mirza, & Ali-Khan, 2014). It is a powerful tool used in classification because of its convergence speed in training phase which is faster than that of other classifiers. In this paper, SVM (Cortes & Vapnik, 1995) proposed by Vapnik is used to classify HRs and HRns because of its applications in audio classification (Guo & Li, 2003), pattern recognition (Ganapathiraju, Hamaker, & Picone, 2004), etc. The FuzzyEn feature is computed over the short term analysis frames (usually 20 - 40 ms). Instead of using noisy FuzzyEn feature directly as an input to SVM, the obtained FuzzyEn features are smoothed to attenuate the noisy features using two filters namely, total variation (TV) filter and Savitzky - Golay (SG) filter. Total variation (TV) filtering introduced by Rudin, Osher, and Fatemi (1992) and Chan, Osher, and Shen (2001), produces nonlinear function of the data, which is defined by the minimizing a non-quadratic cost function. Even though the output of the TV filter produces “staircase effect”, it flattens out the rapid fluctuations that’s available in the data. This is mainly due to the regularization parameter (lambda) present in the cost function. The larger the (lambda) value the staircase effect is obtained which removes major noisy information in the data. SG filter (Savitzky & Golay, 1964) which was proposed by Savitzky and Golay, can be generalized as a least-squares smoothing filter, where the filter coefficients are obtained using least-squares fit using a polynomial degree. The effects of smoothing is controlled by two parameters namely the size of the window and the degree of the polynomial. The advantages with SG filter is that it smooths the data to reduce the noisy information by preserving the shape and height of the waveforms.
In this paper, the feature vector consists of TV-filter smoothed FuzzyEn feature, SG filter smoothed FuzzyEn feature and convolution of first order difference and FuzzyEn. This feature vector is fed as the input into the SVM for VAD, and its performance was investigated under various noisy conditions (airport, babble, car, and train) at different SNR levels (−10 dB, −5 dB, 0 dB, 5 dB, and 10 dB). The structure of the rest of this article is arranged as follows. Section 2 discusses the various stages of proposed algorithm which includes feature extraction, feature vector formation, etc and Section 3 presents the speech and noise database and metrics used in the evaluation along with the experimental results. Finally, a conclusion of this work is given in Section 4.
2. PROPOSED METHODOLOGY
Voice activity detection usually addresses a binary decision to detect the presence of speech for each frame of the noisy speech signal. The noisy speech signal s(𝑛) is obtained by corrupting the clean speech signal x(𝑛) by the additive noise v(𝑛), as in (1),
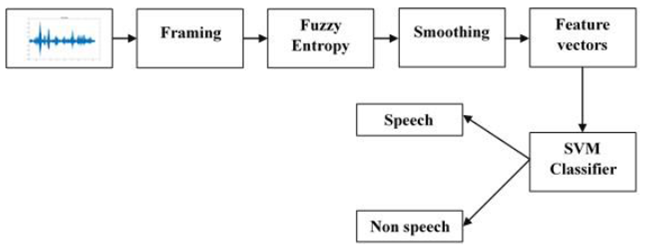
The proposed smFVAD block diagram is shown in Fig.1. The motivation for the proposal is to identify robust feature vectors that would improve the accuracy of the VAD and speech detection under low SNR conditions. Since speech signal is nonstationary in nature, the obtained noisy signal is divided into sequence of small frames of size ranging between 20 - 40 ms. In this paper, the size of each frame is 32ms with a frame shift of 10 ms which is windowed by Hanning window. Therefore each frame consists of 512 samples each and the total number of frames varies depending on the size of the speech signal. The major blocks of the proposed VAD are explained in detail in the following subsections.
2.1 FEATURE EXTRACTION - FUZZY ENTROPY (FuzzyEn)
Let 𝑠k(𝑖) be a N sample noisy speech sequence of kth frame, where i
= 1, 2, 3, …, N, which is reconstructed by phase-space with an embedded
dimension m, and the reconstructed phase-space speech vector
and is generalized by removing the baseline as in (3),
For given vector
and
Here
where n and r are the gradient and width of the fuzzy membership function.
For each
Now construct (8) and (9),
and
From this, FuzzyEn(𝑚,𝑟) of the speech, is defined by, given in (10),
In this work, the embedding dimension, m is 2 and the exponential function parameters n and r are set as 2 and 0.2 times standard deviation, respectively. Note, FuzzyEn in (10) will be denoted as nFE hereafter.
2.2 TOTAL VARIATION (TV) FILTER
The total variation (TV) of the fuzzy entropy feature (
where LL is the length of
Where
is a matrix of size (LL - 1) x LL. The notation ||.||1 denotes the l1 norm. Given noisy fuzzy entropy feature (nFE) from equation (10), the output of TV filter is defined as the solution 𝑛̂𝐹𝐸 to the minimization problem,
where 𝜆 is a parameter that controls the trade-off between denoising and signal distortion.
2.3 SAVITZKY - GOLAY (SG) FILTER
The FuzzyEn features (nFE) obtained using (10) are further smoothed using Savitzky-Golay (SG) filter. SG filter can be generalized as a least-squares smoothing filter, where the filter coefficients are obtained using least-squares fit using a polynomial. This filter depends on two main parameters, window size and degree of the polynomial, M. If M is too high, redundancies of data is obtained and when M is too low, the signal gets distorted. Similarly, when the size of the window is larger, valid information may be lost and when the window is smaller, poor denoised signal is obtained. Smoothing the obtained noisy features through SG filter is given by,
where 𝑛𝐹𝐸𝑘 is the noisy FE features and 𝐹𝐸𝑆𝑘 is the smoothed output of the SG filter, ci is the coefficient for the i-th smoothing, NN is the number of data points in the smoothing window and is equal to 2m + 1, where m is the half-width of the smoothing window. The essence of SG filtering is adopting a polynomial in a sliding window to fit the original signal piece-by-piece depending on the least-squares estimation algorithm. The polynomial can be modelled as:
2.4 CONVOLUTION OF ABSOLUTE FIRST ORDER DIFFERENCE OF TV FILTER (conFETV')
The output of the TV filter (FETV) is further optimized by computing the absolute first order difference of the TV filter which is given by,
where, 𝜇𝐹𝐸𝑇𝑉′=
The absolute first order difference (𝐹𝐸𝑇𝑉′) obtained in equation (16) is further refined by replacing with zeros for values of 𝐹𝐸𝑇𝑉′ less than average of 𝐹𝐸𝑇𝑉′ (𝜇𝐹𝐸𝑇𝑉′) and the resultant obtained is convoluted with the Fuzzy entropy, FE obtained in equation (10) which is given by,
where * is a convolution operator.
2.5 FORMATION OF FEATURE VECTOR
The nFE obtained using (10) is further processed as explained in section 2.2 to 2.4 to form the feature vector of dimension J x K, where J is the number of frames in the noisy speech signal and K to be 3. The first feature vector is obtained as the output of TV filter which flattens out the rapid changes in the signal due to “staircase-effect” while preserving the slow changes in the signal. The second feature vector obtained as a result of SG filtering preserves the peak information in the signal. The third feature vector which was obtained as a result of convolution shows better discrimination between HRs and HRns regions. The significance of the feature vectors considered is explained in Figure 2.
2.6 FEATURE SCALING - minmax
This minmax scaling method, rescales the given feature vectors from one range of values to a new range of values. More often, the feature vectors are rescaled to lie within a range of [0, 1] or [-1, +1], depending on the output classes. This rescaling is accomplished by using a linear interpretation equation given in (20),
where smFE is the smoothed feature vectors obtained using TV filter, SG filter and 𝑐𝑜𝑛𝐹𝐸𝑇𝑉′ and 𝑠𝐹𝐸′ is the normalized feature vector which is rescaled to fit the range [0, 1].
2.7 CLASSIFIER - SUPPORT VECTOR MACHINE
In this work, SVM is used as a classifier, because of its effectiveness in classification accuracy and computational time than other conventional nonparametric classifiers such neural networks, kNN, etc. SVM constructs an optimal hyperplane [〈𝑤,〉+𝑏=0] that maximizes the margin using a known kernel function that accurately predicts the unknown data into two classes, where 𝑤 and 𝑏, shall be derived based on the classification accuracy of the linear problems. Let (𝑥𝑖,𝑦𝑖)𝑖=1𝑁 be the training set samples, where 𝑦𝑖 𝜖 𝑅𝑚 is the corresponding target classes for the input data 𝑥𝑖 𝜖 𝑅𝑚. This is achieved by minimizing the error function shown in (21),
where 𝜑(𝑥𝑖) is a mapping function to map 𝑥𝑖 to its higher dimensional feature space, 𝜉𝑖 is the misclassification error and 𝐶 controls the trade off between the cost of classification and the margin. The classification of the new data as +1 or −1 is obtained by minimizing the error function in (21) based on the decision function, Class i = 𝑠𝑖𝑔𝑛 (〈𝑤,〉+𝑏), yields 1 or 0 respectively. The mapping of the input training set into a higher dimensional space is done through a kernel function 𝐾 ( ,). In this work, the RBF kernel function is used for its excellent generalization and low computational cost (Hariharan, Fook, Sindhu, Adom, & Yaacob, 2013). The RBF kernel function is given by (22),
where, the parameter 𝜎 is the width of the Gaussian function. For this given kernel function, the error function of the classifier is given by (23),
3. RESULTS AND DISCUSSION
The actual speech signals which is collected from TIMIT database (Garofolo et al., 1993) is contaminated by adding nonstationary noises collected from AURORA2 database (Hirsch & Pearse, 2000) of different SNR levels (-10 dB to 10 dB). TIMIT signals were preferred because it provides transcriptions down to word and phoneme levels. Each TIMIT sentence is almost around 3.5s long, out of which 90% is the actual speech signal and 10% contains silence (non-speech) regions. To change this ratio of speech and non-speech regions to 40 % and 60 % (Beritelli, Casale, Ruggeri, & Serrano, 2002) respectively, silence is added to the original speech of the TIMIT corpus. Five types of nonstationary noises such as airport, babble, car, subway and train noises are considered for the experiment which is resampled to 16 kHz depending on the need.
3.1 PERFORMANCE EVALUATION
Performance evaluation of VAD algorithm can be performed both subjectively and objectively. In subjective evaluation, a human listener evaluates for VAD errors, whereas, numerical computations are carried out for objective evaluation. However, subjective evaluation alone is insufficient to examine the VAD performance because listening tests like ABC fail to consider the effects of false alarm (Beritelli et al., 2002; Ghosh, Tsiartas, & Narayanan, 2011). Hence numerical computations through objective evaluation help in reporting the performance of the proposed VAD algorithm.
VAD performance is calculated using (24) and (25)
And
where, HRns and HRs, non-speech frames and speech frames correctly detected among non-speech and speech frames respectively. NSns and NSs, refers to the number of non-speech and speech frames in the whole database, respectively, while NSns, ns and NSs, s, refers to the number of frames classified correctly as non-speech and speech frames. The overall accuracy rate is given by (26),
The best performance is achieved when three parameters referred in the equations (24), (25) and (26) become maximum.
Feature vector performance metrics:
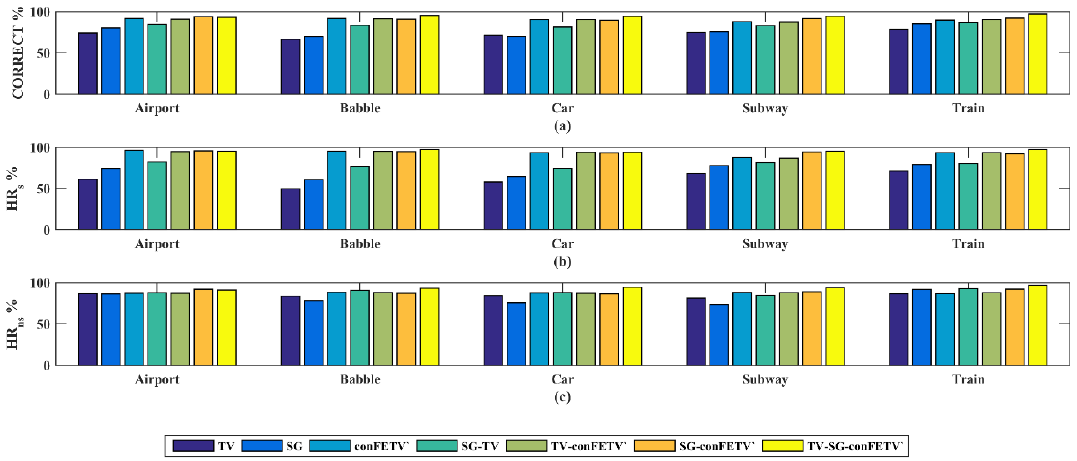
The performance metrics (CORRECT, HRs, HRns) for the proposed TV - SG - 𝑐𝑜𝑛𝐹𝐸𝑇𝑉′ feature vector averaged for overall noises considered (Airport, Babble, Car, Subway and Train) for different SNR levels is shown in Table 1. The table clearly shows that the feature proposed 𝑐𝑜𝑛𝐹𝐸𝑇𝑉′ achieves better performance measures except for HRns. It also detects speech regions (HRs) in an effective way. But when combining all the three features namely TV, SG and 𝑐𝑜𝑛𝐹𝐸𝑇𝑉′, the performance increases for all three metrics giving better detection of HRs and HRns of about 90% and above when compared to that of features considered as a single one. Figure 2 (a) - (c) shows the performance evaluation metrics averaged over the five SNRs (-10 to 10) for the five nonstationary noises computed for the feature vectors TV, SG, 𝑐𝑜𝑛𝐹𝐸𝑇𝑉′, TV - SG, TV - 𝑐𝑜𝑛𝐹𝐸𝑇𝑉′, SG - 𝑐𝑜𝑛𝐹𝐸𝑇𝑉′, TV - SG - 𝑐𝑜𝑛𝐹𝐸𝑇𝑉′ (proposed feature vector) considered. From the Figure 2, it is clear that the proposed TV - SG - 𝑐𝑜𝑛𝐹𝐸𝑇𝑉′ feature vector is the best for all the performance metrics considered for CORRECT, HRs and HRns. The significance of the feature vector formed is misclassification rate of classifying HRs and HRns. The figure clearly shows that the error rate is minimal while forming the feature vector (TV - SG - 𝑐𝑜𝑛𝐹𝐸𝑇??′), because the proposed feature 𝑐𝑜𝑛𝐹𝐸𝑇𝑉′ detects speech regions (HRs) well when compared to that of -the non-speech regions (HRns) but when combining improves the overall efficiency of detecting HRs and HRns effectively.
Table 1 Feature vector performance metrics averaged for overall noises.
| SNR | TV | SG | conFETV’ | SG-TV | TV-conFETV’ | SG-conFETV’ | TV-SG-conFETV’ | |
|---|---|---|---|---|---|---|---|---|
| correct | -10 | 71.07 | 74.14 | 91.03 | 84.42 | 92.85 | 91.42 | 94.55 |
| -5 | 70.10 | 75.91 | 92.47 | 81.33 | 90.27 | 92.59 | 93.49 | |
| 0 | 72.83 | 74.49 | 89.54 | 83.66 | 89.45 | 91.75 | 92.88 | |
| 5 | 72.40 | 76.89 | 89.56 | 83.04 | 88.31 | 91.59 | 94.26 | |
| 10 | 78.96 | 79.16 | 88.96 | 86.65 | 89.69 | 90.86 | 94.24 | |
| HRs | -10 | 66.61 | 71.54 | 93.57 | 81.03 | 96.41 | 95.04 | 97.42 |
| -5 | 61.61 | 74.30 | 95.64 | 79.25 | 92.91 | 93.08 | 96.42 | |
| 0 | 61.69 | 71.54 | 91.46 | 81.25 | 90.62 | 93.37 | 95.14 | |
| 5 | 55.62 | 68.97 | 91.87 | 75.70 | 91.73 | 94.69 | 95.14 | |
| 10 | 62.99 | 69.72 | 93.01 | 77.28 | 91.99 | 93.87 | 94.68 | |
| HRns | -10 | 75.54 | 76.74 | 88.49 | 87.81 | 89.28 | 87.80 | 91.95 |
| -5 | 78.60 | 77.52 | 89.31 | 83.41 | 87.63 | 92.10 | 92.63 | |
| 0 | 83.97 | 77.44 | 87.63 | 86.06 | 88.28 | 89.53 | 92.27 | |
| 5 | 89.18 | 84.81 | 87.26 | 90.38 | 84.89 | 88.50 | 92.16 | |
| 10 | 94.42 | 88.60 | 84.91 | 96.03 | 87.39 | 87.85 | 94.66 |
Performance metrics comparison with other VADs (G.729B, VAD-SOHN, VAD-RAMIREZ)
The efficiency of the proposed smFESVM based VAD is examined by comparing the performance metrics with existing VAD algorithms which is explained below:
- G.729B VAD (ITU, 1995) is a standard VAD method which utilizes several traditional features and is used in speech communication systems to improve the bandwidth.
-VAD-SOHN (Sohn, 1999) is based on statistical modelling which estimates spectral SNR and Gaussian model distribution for speech and noise assuming that the Gaussian distribution for speech and noise in Fourier domain are independent.
- VAD-RAMIREZ (Ramı́rez, Segura, Benı́tez, De la Torre, & Rubio, 2004) combines multiple-observation technique and statistical models VAD and the False Alarm Rate (FAR) is controlled by the use of contextual global hypothesis.
Figure 4 show the comparison of CORRECT rate performance metrics of the proposed smFESVM based VAD with G.729B, VAD-SOHN and VAD-RAMIREZ for different SNR levels (−10,-5, 0, 5 and 10 dB) for airport noise, babble noise, car noise, subway noise, and train noise. It is inferred from the figure that the smFESVM based VAD outperforms the rest of the VAD algorithms by obtaining best performance in CORRECT rate especially under low SNR levels (< 0 dB). There is a noticeable lag in car noise scenario, because a complex event has been encountered in the car noise scenario which is treated as valuable speech thereby increasing misclassification error.

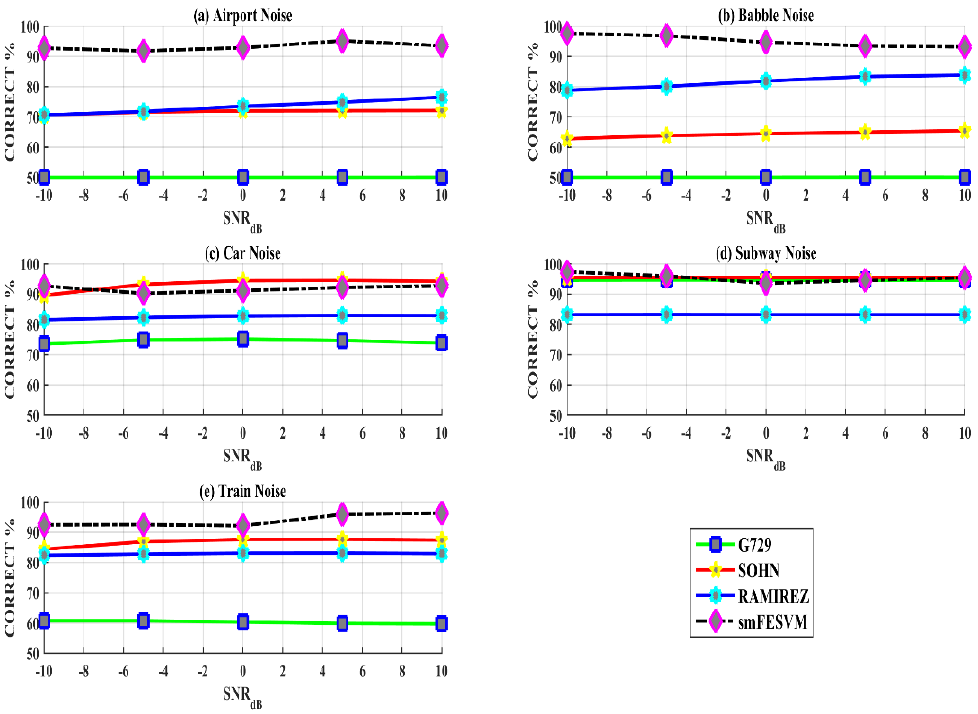
Fig. 4 CORRECT comparisons for G.729B (ITU, 1995), VAD-SOHN (Sohn, 1999), VAD-RAMIREZ (Ramı́rez et al., 2004) and smFESVM based VAD for SNR values ranging between -10 and 10 dB (a) Airport (b) Babble (c) Car (d) Subway and (e) Train noises.
Figure 5 and Figure 6 show hit rate performance evaluation metrics (HRs and HRns) with five SNRs for different kinds of noises computed for G.729B, VAD-SOHN, VAD-RAMIREZ, and the smFESVM based VAD. It is clear that the VAD methods used in comparison yields very high speech detection rates (HRs) for different SNR levels and for various noises, especially G.729B and VAD-RAMIREZ. But this performance behaviour degrades in non-speech detection (HRns) rates when the noise level increases which makes it less conservative in practical speech processing schemes. This is due to the effect of hangover scheme (Aneeja & Yegnanarayana, 2015; Davis et al., 2006) used in these methods. As the energy towards the end of speech is relatively low, to control the risk of false alarm rates (FAR), hangover schemes are used. On the other hand, the proposed smFESVM based VAD yields better detection rates for speech (HRs) and non-speech (HRns) regions when compared to that of the other VAD algorithms. Its detection rate for non-speech regions is relatively higher and exhibits a very low marginal decay in performance while detection speech regions for certain noisy conditions. Table 2 shows the performance metrics averaged for all the noises with various SNR levels. The table clearly illustrates the consistency of the smFESVM based VAD in detecting HRs and HRns with different SNR levels. The challenge of VAD is to detect speech under low SNR levels (<0dB) and from the table it is clear that the smFESVM based VAD algorithm outperforms the rest of the VAD algorithms in detecting speech as well as non-speech regions under low SNR levels.
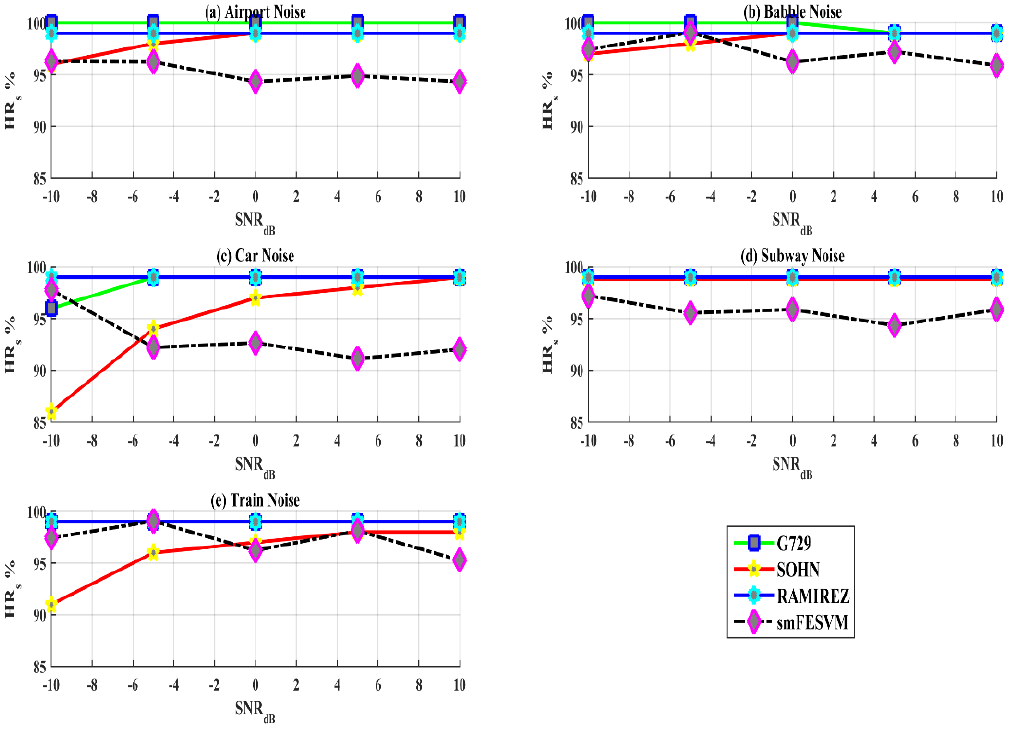
Fig. 5 HRs comparisons for G.729B (ITU, 1995), VAD-SOHN (Sohn, 1999), VAD-RAMIREZ (Ramı́rez et al., 2004) and smFESVM based VAD for SNR values ranging between -10 and 10 dB (a) Airport (b) Babble (c) Car (d) Subway and (e) Train noises.
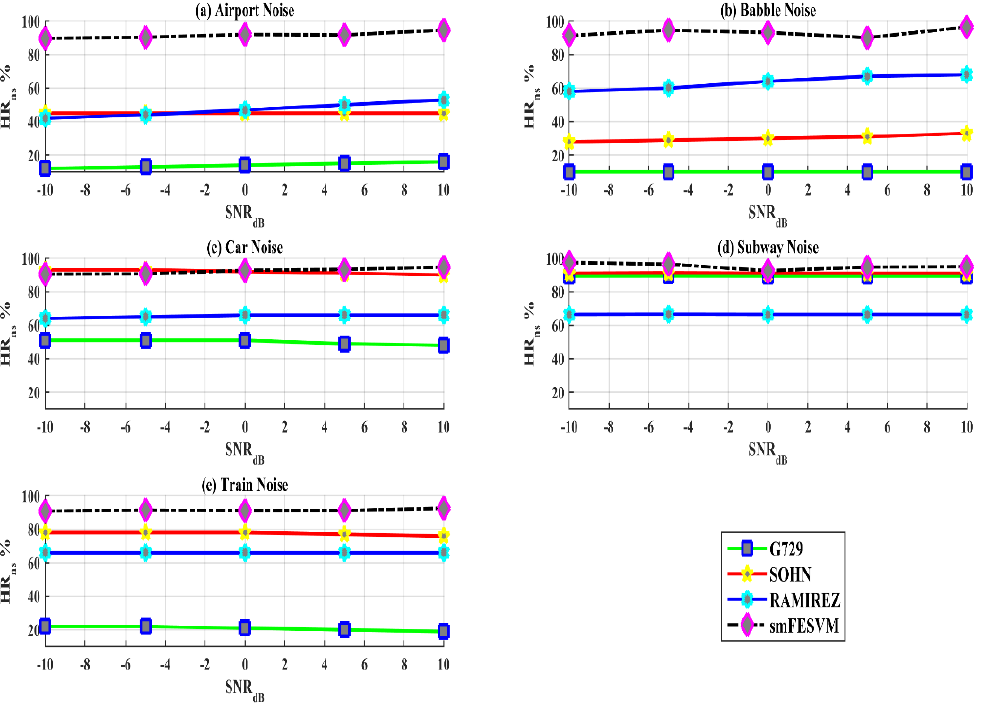
Fig. 6 HRns comparisons for G.729 (ITU, 1995), VAD-SOHN (Sohn, 1999), VAD-RAMIREZ (Ramı́rez et al., 2004) and smFESVM based VAD for SNR values ranging between -10 and 10 dB (a) Airport (b) Babble (c) Car (d) Subway and (e) Train noises.
Table 2 Performance metrics comparison for VAD-SOHN (Sohn, 1999), VAD-RAMIREZ (Ramı́rez et al., 2004), G.729B (ITU, 1995) and smFESVM averaged over 5 noises for 5 SNR levels.
| SNR | SOHN | RAMIREZ | G.729B | smFESVM | ||||||||
|---|---|---|---|---|---|---|---|---|---|---|---|---|
| COR | HRs | HRns | COR | HRs | HRns | COR | HRs | HRns | COR | HRs | HRns | |
| -10 | 80.56 | 93.77 | 67.00 | 79.31 | 99.00 | 59.28 | 65.79 | 98.80 | 36.85 | 94.55 | 97.24 | 91.95 |
| -5 | 82.20 | 96.97 | 67.25 | 80.03 | 99.00 | 60.30 | 66.07 | 99.40 | 37.07 | 93.49 | 96.42 | 92.63 |
| 0 | 82.78 | 98.17 | 67.20 | 80.88 | 99.00 | 61.88 | 66.04 | 99.40 | 37.05 | 92.88 | 95.07 | 92.27 |
| 5 | 82.92 | 98.57 | 67.00 | 81.49 | 99.00 | 63.08 | 65.85 | 99.20 | 36.65 | 94.26 | 95.14 | 92.16 |
| 10 | 82.92 | 98.77 | 67.00 | 81.87 | 99.00 | 63.88 | 65.57 | 99.20 | 36.45 | 94.24 | 94.68 | 94.66 |
Table 3 shows the comparison of performance metrics under clean conditions, averaged for all noisy scenarios and averaged over both clean and noisy conditions with different SNR levels. It is clearly observed from the table that the smFESVM based VAD excels rest of VAD in every performance metrics especially for non-stationary noisy scenarios. There is a noticeable lag in speech detection rate when compared with other VADs, but the proportion of non-speech detection rate confirms that the proposed smFESVM based VAD is well suited in detecting both speech and non-speech regions effectively. Also, the detection of non-speech regions is very much higher for the smFESVM based VAD which is very useful in major speech applications like speech compression, VoIP, speech enhancement, etc. Therefore, based on these performance metrics, the smFESVM based VAD detects speech and non-speech regions effectively especially under low SNR conditions. noisy scenarios. There is a noticeable lag in speech detection rate when compared with other VADs, but the proportion of non-speech detection rate confirms that the proposed smFESVM based VAD is well suited in detecting both speech and non-speech regions effectively. Also, the detection of non-speech regions is very much higher for the smFESVM based VAD which is very useful in major speech applications like speech compression, VoIP, speech enhancement, etc. Therefore, based on these performance metrics, the smFESVM based VAD detects speech and non-speech regions effectively especially under low SNR conditions.
Table 3 Overall VAD performance comparison for VAD-SOHN (Sohn, 1999), VAD-RAMIREZ (Ramı́rez et al., 2004), G.729B (ITU, 1995) and smFESVM averaged for all noises over 5 SNR levels [-10, -5, 0, 5 and 10 dB].
| VAD | SOHN | RAMIREZ | G.729B | smFESVM |
|---|---|---|---|---|
| NOISES | ||||
| CORRECT | 78.99 | 80.09 | 58.69 | 93.88 |
| HRs | 96.85 | 99 | 99.25 | 95.71 |
| HRns | 61.1 | 60.5 | 17.78 | 92.73 |
| CLEAN | ||||
| CORRECT | 95.75 | 83.74 | 94.98 | 98.28 |
| HRs | 99.78 | 100 | 100 | 97.84 |
| HRns | 91.7 | 67.49 | 89.97 | 100 |
| OVERALL | ||||
| CORRECT | 87.37 | 81.92 | 76.84 | 96.08 |
| HRs | 98.32 | 99.5 | 99.63 | 96.78 |
| HRns | 76.4 | 63.99 | 53.88 | 96.37 |
4. CONCLUSIONS
In this paper, the smFESVM based VAD is presented. The significance of the feature 𝑐𝑜𝑛𝐹𝐸𝑇𝑉′ is discussed experimentally under various non-stationary noises at different SNR levels. The efficacy of the 𝑐𝑜𝑛𝐹𝐸𝑇𝑉′ feature is compared against the smoothing features considered and the feature vector formed was also analysed, which proved to be efficient in distinguishing HRs and HRns. The performance of the classifier is analyzed by 10-fold cross validation scheme. The results show that the proposed smFESVM based VAD outperforms the other VAD algorithms considered based on performance metrics. performance of the classifier is analyzed by 10-fold cross validation scheme. The results show that the proposed smFESVM based VAD outperforms the other VAD algorithms considered based on performance metrics. Similarly, for babble noises and for other non-stationary noises at lower SNRs around -5 dB and -10 dB, the proposed algorithm proves its robustness under noisy conditions.

