


 text new page (beta)
 English (pdf)
 Article in xml format
 Article references
 Send this article by e-mail
 Cited by SciELO
  Similars in
SciELO
Similars in
SciELO 
 Permalink
1. Introduction
Software testing is the most important part of quality assurance in SDLC Sommerville (2009), Mathur (2007). Nowadays, the increasing size of software and complexity require more manpower and time for testing the software systems. Manual testing is very much labor-intensive and error-prone. In the current scenario, all the experts agreed that manual test case generation is a common cause of project delays, especially for large projects. Test scenarios generation contributes major role in minimizing the cost. Therefore, automatic test scenarios generation has ensured the software quality and manages software cost. Source code based test scenarios generation is a very typical task, but a substitute approach is to generate test scenarios based on UML models during the design phase in software development. UML Michel and Rumbaugh (2005) is a widely accepted language for designing object-oriented software. UML diagrams show the behavior of the object or combination of objects. Test scenarios generation at design level has several rewards. Model-based test scenario generation technique can detect sealed categories of faults Aichernig et al. (2015) that are not easily recognized by source code based testing. It also allows test cases to be available much earlier in the software development process, thus making test planning more efficient, and reducing the rescue time and usage of resources Michel and Rumbaugh (2005). Optimal and prioritized test scenarios generation is still a challenging task. So, we use Firefly optimization algorithm Surafel and Hong (2012), Yang (2009) for prioritizing the test scenarios. Firefly algorithm is becoming powerful in solving the modern numerical optimization problems, in particular for the NP- hard problem. We can also apply this algorithm on Control Flow Graph for test scenarios generation which is also an optimization problem. As compared to PSO and GA techniques Tilahun, Kassa, and Ong (2012), Firefly Algorithm (FA) reduces the overall computational effort by 86% and 74%, respectively Yang (2009). The intention of this research is to generate test scenarios for concurrent and composite states in state machines using our proposed algorithm SMToTSG (State Machine To Test Scenarios Generation). After test scenarios generation, we apply Firefly optimization algorithm Surafel and Hong (2012), Yang (2009) for prioritizing the test scenarios. We consider composite states in the State Machine Diagram (SMD) to generate test scenarios and to verify the behavior of software systems. After prioritization, we apply Average Percent- age Fault Detection (APFD) metric to determine the efficiency of the prioritized test scenarios. This paper generates all feasible test scenarios for the System Under Test (SUT) and employs Firefly Algorithm to prioritize the generated test scenarios.
To the best of our knowledge, there exists no such technique that generates test scenarios by considering the composite states. In such a scenario, the generated test scenarios are prioritized. Redundant exploration of the State Machine Diagram and the iteration over the state loops are avoided by the construction of the Feasible Control Flow Graph. The use of Firefly Algorithm, results in efficient prioritization of the generated test scenarios.
The remaining part of the paper is structured as follows: Section 2 provides the basic concepts such as the overview of the state machine diagram, inter- mediate graph, state-based coverage criterion, Firefly optimization algorithm, objective function, and Average Percentage Fault Detection (APFD) metric. Section 3 presents the proposed approach for prioritizing the test scenarios generated from the state machine diagram using FA. Section 4 describes the working of our approach by taking the case study Bank ATM system. In Section 5, we discuss the experimental studies and present the corresponding result analysis. Section 6 describes the comparison of our work with some related work. Section 7 concludes the paper and provides some insight into our future work.
2. Basic concepts
In this section, we discuss some basic concepts, notations, and definitions, which are relevant to our approach. In rest of the paper we use the terms, test cases, test scenarios and test sequences interchangeably.
2.1 State machine diagram (SMD)
In modeling language, the behavioral representation of an object is described by defining a State Machine Diagram (SMD). The SMD is also documented in a type of diagram known as state chart in UML 1.x. A SMD describes the states, transitions, and composite states which are the main building blocks of the SMD.
Definition A state machine diagram (SMD) is a tuple SD = {S, S0, E, T, Sf}, where
-S is a finite set of states,
-S 0 ∈ S is an initial state,
-E is a finite set of events,
-T ⊆ S × E × S is a finite set of transitions,
-S f ⊆ S is a finite set of final states.
A state machine, tracks an individual object throughout its entire lifetime, specifying all the possible sequences of messages that the object could receive together with its response to these messages.
States are distinguished by the fact that the object may respond differently to events in different states. Below, we discuss some important properties of behavioral states Priestley (2003).
An object has a number of possible states and it is in exactly one of these states at any given time.
An object can change a state and, in general, the states it is in at a given time will be determined by its history.
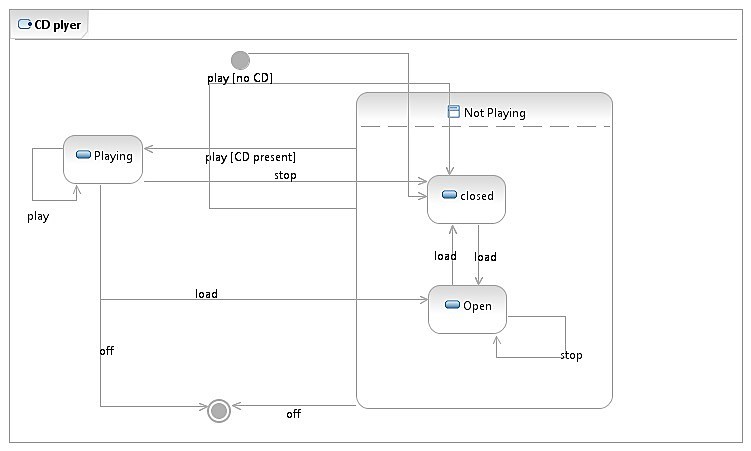
Now, we describe the state machine diagram with the case study CD Player. The state machine diagram for the CD Player is shown in Fig. 1 and the detailed description of this case study is given in Priestley (2003).
2.1.1 State
The states of a state machine diagram are represented by a discrete type called state variable. State machine diagram has a set of possible states. A state is an abstraction of the values and links of an object. Sets of values and links are grouped together into a state according to the gross behaviour of the object Michel and Rumbaugh (2005), Priestley (2003). For example, the state of a bank could be either solvent or insolvent, depending on whether its assets exceed its liabilities. It is generally represented by a rectangle with rounded corners.
A state may be subdivided into multiple compartments, which are separated from each other by horizontal lines. The different compartments of a state are as follows:
Name compartment (optional) which holds the name of the state as a string.
Internal activities compartment contains a list of internal actions or state activities that are performed while the element is in the state.
Internal transitions compartment contains a list of internal transitions. An internal transition executes without exiting or re-entering the state in which it is defined.
The possible states of an object are as follows:
Initial state A transition starting from an initial event, shows the state where an object is created or initialized. This state is known as initial state and is represented by a small black disk. A state machine diagram has only one initial state.
Final state It represents the state when an object is destroyed, stopped or switched off corresponding to some event. It is represented by small black disk inside a large circle. A state machine diagram can have more than one final state.
Activity state An activity state represents a period of time during which an object is performing some internal processing. As such it is shown as a normal state that contains only an activity. For example in a vending machine, as soon as the customer’s input to a transaction is complete, the activity state becomes active, corresponding to whether the vending machine is capable of returning the change required, to complete the transaction.
Event An event is caused by the inputs to a composite state machine. In response to an event, a composite state machine may take an action and make a transition to a new state. In any particular state, some events will cause associated transitions to new states, while other events will not cause transitions. An event is also an occurrence at a point of time. Events often correspond to verbs in the past tense (e.g. power turned on, alarm set etc.) or to the honest of some condition (e.g. paper tray becomes empty, temperature becomes lower than freezing etc.).
Action In state machine diagram, every state and event may be associated with action. An action may include a transition to a new state, but may also result in an output from the state machine diagram.
Transitions Transition is a behavior transformation from one state to another state. A transition is an event triggered at a particular state. In reaction to the event, a transition is transformed from one state (current state before the transition), to another state (the new state after a transition) in state machine diagram. When an event occurs, then a guarded transition fires. A guard condition is checked only once, at the time the event occurs. The transition fires if the condition is true. For example, when a called phone is answered, the phone transitions from the ringing state to the connected state. The UML syntax for a transition is: event-name argument-list [guardpredicate]/action-expression.
-
Guard Condition A guard condition is a condition that has to be met in order to enable the transition to which it belongs, e.g.
Guard conditions can be used to document the event, depending on the condition, which may lead to different transitions.
Composite State If composite state machines are to be usable in practice for complex systems, some method of simplifying the diagram is required. One such technique is provided by allowing a state to contain a number of substates. The substates are grouped together in the enclosing state because they share certain properties, which can more concisely be represented as properties of a single ‘superstate’. One property that states can share with other states is their behaviour or, in other words, the transitions that they participate for example in Fig. 1, when the CD player is in the open or closed state, its response to a play event with a CD in the drawer is the same, namely to move into the playing state and to play the CD. This may or may not involve a change of state, depending on whether the drawer was originally open or closed, but the net effect of the event is the same. Fig. 1 shows a composite state machine for the CD player that uses a super state to factor out the common behaviour. A new state called ‘Not Playing’ has been introduced and the open and closed states now appear as sub states of this new state. The not playing state is known as a composite state consisting of the two nested sub-states open and closedMichel and Rumbaugh (2005), Priestley (2003).
2.2 Intermediate graph
Behavioral relationship between objects can be represented by state machine diagram. It can be converted to a graph Michel and Rumbaugh (2005), Swain, Panthi, Behera, and Mohapatra (2012). So, we investigate the comprehensive control flow of a state machine diagram and store all the extracted information in a link list Yang (2009). This link list is used for mapping a state machine diagram to a Composite Control Flow Graph (CCFG), which is defined below:
Definition An CCFG is a tuple I = {S 0 , T, S, C sn , C en , S n } where,
S 0 is an initial node representing the beginning of CCFG.
T is a set of transitions in CCFG, where, T ∈ t i .
S is a set of states in CCFG.
C sn is a start node in the composite state of CCFG.
C en is the set of end nodes in the composite state of the CCFG.
S n is the set of end nodes in CCFG.
Fig 5a represents the CCFG of the state machine diagram of the Bank ATM system given in Fig 4.


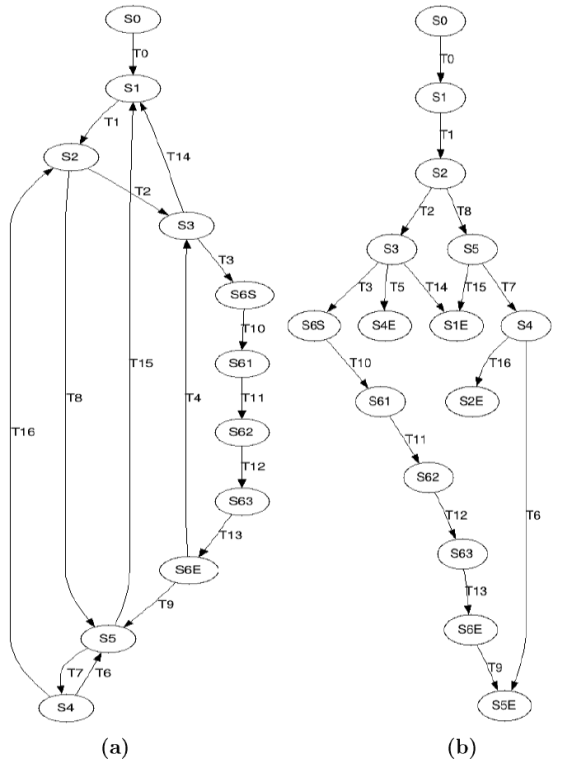
Fig. 3 Feasible Control Flow Graph of Composite Control Flow Graph (CCFG) for a Simple Example. (a) A simple CCFG. (b) Converted FCFG from CCFG given in Fig. 3a.

2.3 State-based coverage criterion
State-based system testing is a significant application of MBT, in which, state coverage, transition coverage and transition pair coverage are the important test coverage criteria Michel and Rumbaugh (2005), Swain et al. (2012), Priestley (2003) for system testing. These coverage criteria are discussed below:
State Coverage: State coverage can be defined on the basis of test scenario as follows: Given, a finite set of states S = {st 1, st 2, …, st n } and finite set of test scenarios T = {t 1, t 2, …, t q }. A test scenario can achieve state coverage, iff for each st i S, there exists a test scenario t j T, such that execution of t j causes state st i to be reached. In this case, we say that the test case t j covers the state s i . Thus, a test suite is said to achieve state coverage, iff it covers every state of the corresponding state chart diagram Priestley (2003).
Transition Coverage: The problem of designing a test suite that achieves transition coverage can be defined as follows: Given a set of transitions T ={t 1, t 2, …, t m }, a test suite TS = {ts 1, ts 2, …, ts q } achieves transition coverage, iff for each ts i TS, there exists a t j T that causes tsi to be executed. In this case, we say the test case ts i covers the transition ts j . Thus, a test suite is said to achieve transition coverage, if it covers every transition of the corresponding state machine diagram Priestley (2003).
Transition Pair Coverage Criterion: The problem of designing a test suite that achieves transition pair coverage can be defined as follows: Given a set of test scenarios T={t 1, t 2, …, t q }, and a set of transitions T={t 1, t 2, …, t m }, a test suite TS = {ts 1, ts 2, …, ts q } is said to achieve transition pair coverage, if T contains each reachable test scenario of length up to 2, where, we cover every pair of two transitions Priestley (2003).
2.4 Firefly algorithm
Firefly is a bio-inspired meta-heuristic algorithm introduced by Surafel and Hong (2012) and is used to solve optimization problems. According to Surafel and Hong (2012), Yang (2009) there are three important assumptions in Firefly algorithm:
All fireflies are unisex, which means any firefly can be attracted to any other brighter one.
Attractiveness is proportional to their brightness, thus for any two flashing fireflies, the less bright one will move towards the brighter one. The attractiveness is proportional to the brightness and they both decrease as their distance increases.
The firefly will move towards the brighter one, and if there is no brighter one, it will move randomly.
Based on these three rules, the Firefly Algorithm (FA) can be summarized into two basic concepts: variation of light intensity and formulation of the attractiveness. For simplicity, this paper assumes that the attractiveness of a firefly is determined by its brightness. The intensity of light is inversely proportional to the square of the distance, say d, from the source. Thus, the intensity I at distance d varies according to the inverse square law, i.e. I(d) =
In the simplest format, the brightness on intensity I of a firefly at a particular location x can be expressed as I(x) f(x), where f(x) is an objective function for the current node. When light passes through a medium with light absorption coefficient λ, the light intensity I, varies with distance d as given below Surafel and Hong (2012):
where I 0 = Intensity at the origin point.
The approximation of the Gaussian form in Eq. 2 obtained by using the combined effect of inverse square law and absorption law is given below:
For a shorter distance Eq.2 and Eq. 3 are essentially the same. The series expansions is given in Eq. 4 and Eq. 5.
Similarly, the attractiveness of a firefly can be defined as follows:
where A 0 is the attractiveness at d = 0, and A(d) is the attractiveness of the node at a distance d. The movement of a firefly i, that is attracted to another more attractive (brighter) firefly is determined by using Eq. 6 and is given below:
Where
Here, xi,k is the kth component of the spatial coordinate xi of the ith firefly. In 2D form, we have
In Eq. 5 the second term corresponds to the attraction and the third term is for randomization with α being the randomization parameter and 0 ≤ α ≤ 1. Rand is a random number generated between [0, 1].
2.5 Objective function
Minimizing the problem according to objective design variables in the search space are called objective function. The objective function guides an evolutionary algorithm to produce decisional test scenarios for guard conditions and decision points. A well formulated objective function can help to produce correct results. It also reduces the effort in searching algorithm.
In Firefly algorithm, variations in brightness and light intensity play an important role in deriving the objective function. In this paper, cyclomatic complexity and intensity of light are the important factors for traversing the graph. So, on the basis of these factors, we have formulated the objective function. We use the following objective function in our proposed approach.
where, i is the current node, j is the next connected node of i, λ i = cyclomatic complexity of current node i, and rand() is a random function.
2.6 Average percentage fault detection (APFD) metric
Test case prioritization schedules the test cases according to their priorities. The test cases with highest priorities are executed earlier in the regression testing process than the test cases with lower priorities Bernhard et al. (2014), Kim, Clark, and McDermid (2001), Rothermel, Untch, Chu, and Harrold (2001), Srivastava (2008). Test case prioritization techniques arrange test cases on the basis of coverage criterion. The main aim of this technique is to improve the efficiency of test cases for exhaustive testing. Test case prioritization problem can be formulated as follows:
Definition: Given T , a test suite; PT , the set of permutations of T ;.f , a function from PT to the real numbers.
Problem: Find T ′′ ϵ PT such that (∀T ′′) (T ′′ ϵ PT )(T ′I′ =T′′ ≥ f (T ′′)].
Here, PT represents the set of all possible orderings of T , and f is a function which is applied to any such ordering.
There are many possible ways for prioritization using the test suite for detecting the faults during test case execution Bernhard et al. (2014), Rothermel et al. (2001), Rothermel and Elbaum (2003), Srivastava (2008). Let T s be a test suite which contains n test cases, and let F be a set of m faults captured by T s . Let TF i be the first test case in scheduling T ′ of T that detects the fault i. According to Rothermel et al. (2001), the Average Percentage Fault Detection (APFD) for test suite T ′ is given by Eq. 11:
APFD value ranges from 0 to 100. An ordered test suite with higher APFD value has faster (better) fault detection rate than those with lower APFD values Rothermel et al. (2001), Srivastava (2008).
Test case prioritization technique can address many important objectives including the followings:
To increase the average percentage of faults detection, that is useful for revealing faults earlier for the execution of regression tests.
To increase the high-risk fault detection rate in the testing process.
To increase the probability of revealing regression errors related to mutation fault detection techniques.
To increase the percentage of code coverage in the SUT at a faster rate.
To increase the percentage of confidence in the reliability of the SUT at a faster rate.
3. Proposed approach
Now, we discuss our proposed approach for automatic test scenarios generation and prioritization using Firefly optimization algorithm. The proposed architecture of our approach is given in Fig. 2 and the step wise procedure is given below.
Step 1: Construct the State Machine diagram for the given system and export it into XMI representation.
Step 2: Convert the XMI representation of the State Machine Di- agram to Composite Control Flow Graph (CCFG) and Adjacency matrix.
Step 3: Generate test scenarios using our proposed algorithm SM- ToTSG on the adjacency matrix and transform the test scenarios into independent paths.
Step 4: Prioritize the generated test scenarios by identifying the model faults present in the state machine diagram.
Step 5: Find the APFD values for the prioritized test scenarios.
We illustrate each step with a running example of Bank ATM System given in Fig. 4 is Section 4.
According to this approach, first we construct the State Machine Diagram (SMD) for a module or the entire system using the design tool IBM RSA (Rational Software Architecture). Then, we export the SMD into XMI document using IBM RSA tool. Our approach takes XMI file as an input for our developed parser for generating Composite Control Flow Graph (CCFG). In CCFG, there exists some feasible paths in loops. For removing these loops, we transform the CCFG into FCFG (Feasible Control Flow Graph).
After generating the CCFG in Step 2, we convert the CCFG into FCFG. There are many loops present in CCFG. Due to the existence of loops, there exists many infeasible test paths in CCFG. In this step, we have considered simple CCFG (as shown in Fig. 3a) for transforming to FCFG.
In Fig. 3a, there exists one infeasible path, i.e. (A0 → A1 → A2 → A4 → A2), due to the presence of a loop. In this path, A2 and A4 may repeat many times. So, this is also one type of fault due to loop existence. Here, we are aiming at removing the infeasible paths using an intermediate graph, called FCFG. In the FCFG, we have created one extra node e.g. A2E, which is a sub-node of A2. This process can remove all existing loops present in CCFG. After converting the CCFG into FCFG, there are now two feasible path i.e. (A0→ A1 → A2 → A4 → A2E) and (A0 → A1 → A2 → A3).
Then, we calculate the cyclomatic complexity for every node. We proposed have SMToTSG algorithm for generating the test scenarios using FCFG. After generating the FCFG, we choose randomly fireflies at each node. We have transmitted hundred fireflies at every node as inputs. According to the fireflies, we calculate the optimal results for our proposed approach.
The objective function of an optimization problem defines the objective to be maximized or minimized in the search space and domain of design variables Bradley, Brabazon, and O'Neill (2010), Srivatsava, Mallikarjun, and Yang (2013), Yang (2009).
Here, the objective function determines the attractiveness/brightness of firefly’s in a state or a node of a graph, where each state or node’s objective function value can be different, derivations of objective function should use key proper- ties of a State Machine Diagram (SMD) or a Control Flow Graph (CFG). In the standard Firefly algorithm, light intensity and variations in brightness play a crucial role in encoding the objective function, while designing a good objective function is important to a good problem formulation to be solved by any algorithm. In this work, the proposed algorithm can adapt and extend the above two entities by considering cyclometic complexity Bradley et al. (2010), Srivatsava et al. (2013), Yang (2009), and graph traversal. We will apply the proposed algorithm into software testing domain. In addition, the intensity factor can be determined by using cyclometic complexity of the graph’s nodes and variation of attractiveness can be implemented by having the absorption coefficient at every edge of CFG. Therefore, our algorithm uses two important entities for formulating the objective function: (1) Cyclomatic Complexity (2) Random Function. Here, a random function or a randomization function is a vector with random variables defined according to the dimensions in which the algorithm is used. Randomization along with scaling parameters is employed to differentiate the dimensions they travel. We use the following objective function in this approach Srivatsava et al. (2013).
where, i is the current node, j is the firefly at current node, λ i = cyclomatic complexity of current node i, and rand() is a random function.
Here the constant 10 is a scaling factor to maintain brightness values above zero, to avoid purely random search. Random values of a node are used to generate fireflies with different values of brightness at a particular node.
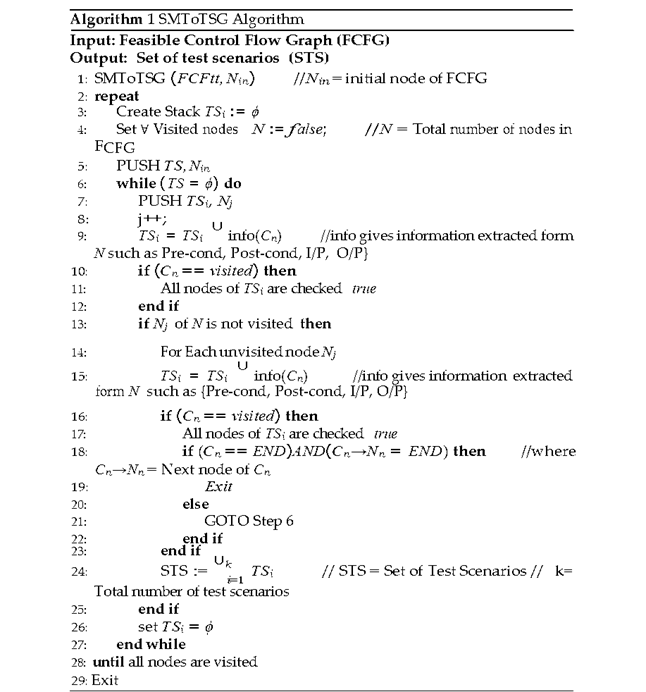
After generating the test scenarios, we apply Firefly optimization algorithm on the generated test scenario for calculating the mean of brightness. Then, we calculate the mean of brightness for every generated test scenario using an objective function. Finally, we prioritize the test scenarios according to the mean of brightness. Finally, we apply Average Percentage Fault Detection Metric (APFD) to measure the efficiency of the prioritized test scenarios. Now, we explain our proposed algorithm SMToTSG, which is given in Algorithm 1. In this algorithm, we have taken FCFG (Feasible Control Flow Graph) as the input. The output of our algorithm is a Set of Test Scenarios (STS). We store all the Nodes of FCFG in a link list. First, we initialize C n to store the current node of FCFG. Next, we set TS i = ϕ, and then update it to store all the generated test scenarios. Then, we trace all the nodes of FCFG till END node is found. If we found (C n = END), then we store all the pre-conditions and post-conditions with input output in TS i . We mark every node which is traversed. If any node is repeated, then we unmarked the node. Finally, we store the generated test scenarios in STS and display them.
3.1 Correctness proof of SMToTSG algorithm
In this section, we sketch the proof of correctness of our SMToTSG algorithm.
Theorem 1. SMToTSG algorithm generates test scenarios correctly.
Proof. In this algorithm, we have taken CCFG (Composite Control Flow Graph) as the input in adjacency matrix format. The output of this algorithm is the test scenarios. There are three loops in this proposed algorithm, in which two while loops are subparts (inner loops) of for loop. In this algorithm, the for loop is executed for i = 0 to r-1 times, where r is the number of rows. The for loop terminates at i = r-1. while loops are initialized at line number 4 and 10, and terminated at line number 9 and 14. We assume that all the statements work correctly in this algorithm. By varying the value of i from 0 to r 1, we get all possible test scenarios. So, our proposed algorithm SMToSG correctly generates all the test scenarios.
3.1.1 Complexity Analysis
In this section, we discuss the space and time complexity of the SMToTSG (State Machine based to Test Scenario Generation) Algorithm.
Space Complexity: We have considered two type of graphs (CCFG and FCFG) for this approach. If the number of state nodes in CCFG is n and the number of transitions is e, then the space complexity of storing the graph is of order O(ne). So, that is the overall space complexity O(ne).
Time Complexity: Proposed algorithm SMToTSG traverses every node and edges of FCFG. When all the nodes and edges are covered than our loop exit from main loop. In this algorithm, we have considered node as a n and edges as an e. So, the overall execution time of our algorithm is O(ne).
4. Working of our proposed approach with bank ATM case study
We consider the case study of Bank ATM1 system to explain our proposed approach. In Bank ATM system, there are many use cases such as check balance, withdraw cash, change PIN, transfer funds, maintenance, repair, etc. ATM system is very large and complex. So, we consider only one use case i.e. Maintenance use case of ATM system, whose state machine diagram (SMD) is shown in Fig.4. Below, we describe the state machine diagram of Bank ATM case study.
Initially, ATM is in Turned off state. When the power is turned on, ATM performs startup action through turn on transition and enters into Self Test state. If turned on state calls turn off transition, then, it performs shut Down action and enters into out of service state. According to trigger, off state may be entered into Idle state through shut Down action. In Idle state, ATM waits for customer interaction. When the customer inserts ATM debit card in the card reader slot, the ATM state changes from Idle to serving Customer state. Serving customer state is a composite state with sequential sub-states customer authentication, selecting transaction and performing transaction. Customer authentication state can verify the authenticity of a customer by the use of personal information and PIN number which are stored in the ATM debit card. Selecting transaction state gives the options for customer transaction. Performing transaction state performs the transaction which is selected by the customer. Selecting transaction and performing transaction states depend on the customer interaction. The composite states are indicated with hidden decomposition icons. Serving customer state is completed when end state is called in composite state. If Serving customer state has performed action ejectCard, then, ATM releases customer’s card on leaving the state. On entering the serving customer state the entry action is performed, and read card transition is called. The serving customer state, backs to the Idle state, and triggers cancel called by a customer at any time. If any problem happens in Idle state, then service transition is called and the system enters into Maintenance state. Finally if any problem happens, failure transition is called and the system will be entered into out of service state.2.
First, we generate an XML document from the State Machine Diagram. Then, we parse the XML file and calculate the number of states, transitions and cyclomatic complexity for every node and generate composite control flow graph (CCFG). The CCFG of the SMD given in Fig. 4 is shown in Fig. 5a. After calculating all the elements, we convert the CCFG to a Feasible Control Flow Graph (FCFG). The FCFG is used for generating test scenarios. The generated test scenarios are completely feasible and optimal. In FCFG, every node is associated with a number of fireflies.
After generating the test scenarios, we choose randomly fireflies at each node.
We have transmitted hundred fireflies at every node as input. According to the fireflies, we calculate the optimal results for our proposed approach. The complexity of calculation can also be minimized using fireflies.
For every test scenario, hundred fireflies are transmitted at every node as inputs by using Eq. 13.
we have taken, A0 = 10
d= [0.9, …, 1.0] to [0, …, 0.1] in which d is a distance between two nodes.
λ =Cyclomatic complexity at node of CCFG.
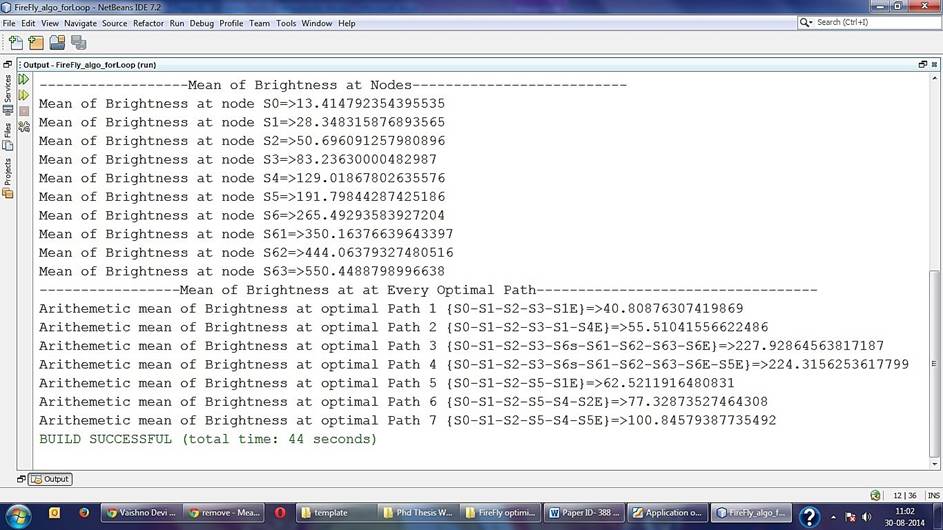
We present the prioritized test scenarios for our state machine Bank ATM system, based on the brightness values.
Now, we show the cyclomatic complexity for every node in Table 1 using Eq. 14
where cc = cyclomatic complexity of graph, e = # of edges in CCFG, n = # of nodes in CCFG. A mean can be determined for grouped data, or data that is placed in intervals. Unlike listed data, the individual values for grouped data are not available, and we would not be able to calculate their sum. To calculate the mean of grouped data, the first step is to determine the midpoint of each interval, or class. These midpoints must then be multiplied by the frequencies of the corresponding classes. The sum of the products divided by the total number of values will be the value of the mean. The formula for mean of brightness is shown in Eq. 15
where B m = Arithmetic mean of brightness, n = The number of fireflies at single node/state, A 1 = The brightness value of single firefly at node. After calculating the mean of brightness of every test scenario, we prioritize the test scenarios according to their mean brightness. We have given highest priority to that test scenarios, which has highest mean brightness i.e. Highest priority α Highest Brightness Mean.
Table 1 Cyclomatic Complexity List for every node (state) of CCFG.
| S.No. | State | Cyclomatic Complexity |
|---|---|---|
| 1 | S 0 | 8 |
| 2 | S 1 | 8 |
| 3 | S 2 | 7 |
| 4 | S 3 | 5 |
| 5 | S 4 | 4 |
| 6 | S 5 | 3 |
| 7 | S 6 | 3 |
| 8 | S 61 | 3 |
| 9 | S 62 | 3 |
| 10 | S 63 | 10 |
In this approach, we have considered State coverage, Transition coverage, and Transition pair coverage. The above coverages for the Bank ATM system case study using the prioritized test scenarios are shown in Fig 6.

Fig. 6 State Machine Coverage Criterion using Our Approach in Bank ATM System in Fig. 4. (a) State Coverage. (b) Transition Coverage. (c) Transition Pair Coverage.
Let the system contains nine faults, which are detected by the generated test scenarios. The faults are incorrect initial state, incorrect final state, interchanged state, missing states, interchanged diagram, corrupted attribute, corrupted initial value, missing composite state, missing transition. The alias symbol and faults name are given in Table 3.
Table 2 Generated Feasible Test Scenarios for ATM case study.
| Test Scenarios ID | Feasible Test scenario | Brightness Value | Priority |
|---|---|---|---|
| TS 1 | S 0→S 1→S 2→S 3→S 1E | 40.8087 | VII |
| TS 2 | S 0→S 1→S 2→S 3 →S 4E | 55.5104 | VI |
| TS 3 | S 0→S 1→S 2→S 3→S 6S →S61→S62→S63→S6E | 227.9286 | I |
| TS 4 | S 0→S 1→S 2→S 3→S 6S →S61→S62→S63→S6E →S5E | 224.3156 | II |
| TS 5 | S 0→S 1→S 2→S 5→S 1E | 62.5211 | V |
| TS 6 | S 0→S 1→S 2→S 5→S 4→S 2E | 77.3287 | IV |
| TS 7 | S 0→S 1→S 2→S 5→S 4→S 5E | 100.8452 | III |
Table 3 Alias symbol for faults name.
| S.No. | Faults Symbol | Faults Name |
|---|---|---|
| 1 | F 1 | incorrect initial state |
| 2 | F 2 | incorrect final state |
| 3 | F 3 | interchanged state |
| 4 | F 4 | missing states |
| 5 | F 5 | interchanged diagram |
| 6 | F 6 | corrupted attribute |
| 7 | F 7 | corrupted initial value |
| 8 | F 8 | missing composite state |
| 9 | F 9 | missing transition |
Test scenarios prioritization includes scheduling the test scenarios in sequential manner to improve the performance of regression testing. We can find the critical test scenario of the system by using our proposed technique i.e. firefly based test scenarios prioritization approach. In the proposed approach, hundred fireflies are used at each node and they traverse for each feasible test scenario by using firefly optimization algorithm.
Below, we present the prioritized optimal test scenarios for our state ma- chine of Bank ATM system, based on the brightness values. In this paper, Fig. 7 shows the prioritized test scenarios with means of brightness at every path of Bank ATM System.

After the calculation of all means of brightness for all test scenarios, the test scenario with the highest mean value is prioritized according to composite states in state machine diagram. In this paper, the prioritized test scenarios, which have a higher number of composite states, is assigned with high priority as shown in Table 2.
After prioritizing the test scenarios, we apply APFD metric to calculate the APFD values. These values are used to determine the efficiency of the prioritized test scenarios.
Scheduling the test scenarios in execution order according to some coverage criterion is called test case prioritization. The criteria may be to record test cases in an execution order that achieves maximum code coverage at the fastest rate. Test sequence prioritization is a regression testing approach. It aims at sorting and executing test cases in the order of their potential abilities to achieve certain testing objective. Rothermel et al. (2001) first introduced the prioritization problem as a flexible method of regression testing. In their technique, they selected test cases according to the modified code coverage and prioritized them. Now, let us apply Eq. 11 to the prioritized test scenarios to compute the value of APFD. It is observed from Table 4 and Table 5 that, m = number of faults = 9, n = number of test sequences = 7 and
APFD = 1 - ((1 + 2 + 1 + 1 + 2 + 1 + 2 + 3 + 1)/(7 * 9)) + 1/(2 * 7) = 0.84920
Table 4 Prioritized test scenarios with the detected faults.
| Test Sequences / Faults | F 1 | F 2 | F 3 | F 4 | F 5 | F 6 | F 7 | F 8 | F 9 |
|---|---|---|---|---|---|---|---|---|---|
| TS 3 | X | X | X | X | X | ||||
| TS 4 | X | X | X | X | |||||
| TS 7 | X | ||||||||
| TS 6 | X | ||||||||
| TS 5 | X | X | X | ||||||
| TS 2 | X | X | |||||||
| TS 1 | X | X |
Table 5 Non-Prioritized test scenarios with the detected faults.
| Test Sequences / Faults | F 1 | F 2 | F 3 | F 4 | F 5 | F 6 | F 7 | F 8 | F 9 |
|---|---|---|---|---|---|---|---|---|---|
| TS 1 | X | X | |||||||
| TS 2 | X | X | |||||||
| TS 3 | X | X | X | X | X | ||||
| TS 4 | X | X | X | X | |||||
| TS 5 | X | X | X | ||||||
| TS 6 | X | ||||||||
| TS 7 | X |
Similarly, the APFD value for the non-prioritized set of test scenarios (i.e. nn-prioritized test scenarios) can be calculated as follows:
APFD = 1 - ((3 + 1 + 3 + 2 + 4 + 3 + 4 + 2 +1)/(7 * 9)) +1/(2 * 7) = 0.700635
APFD for the given prioritized test scenarios is calculated to be 0.8492. The APFD value for the non-prioritized test scenarios is to found to be 0.7006. Fig. 8 shows the APFD values for the prioritized and non-prioritized test scenarios.
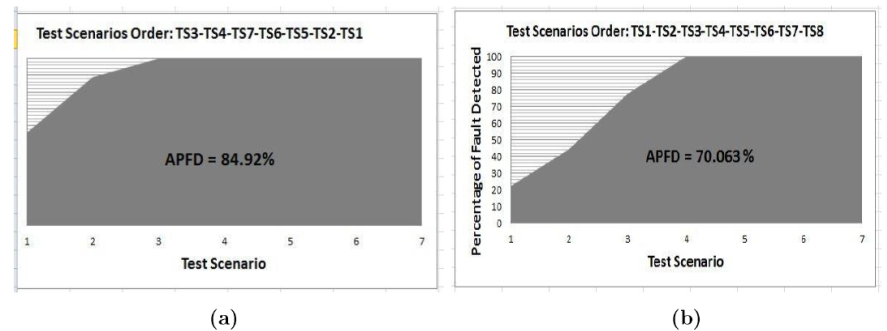
Fig. 8 APFD measure for the prioritized and non-prioritized test sequences. (a) APFD measure for the Prioritized Test scenarios of Bank ATM system (b) APFD measure for the Non-Prioritized Test scenarios of Bank ATM system.
We observed that the APFD value obtained for the prioritized scenarios (using our approach) is more than that of the non-prioritized test scenarios.
Hence, for the given Bank ATM system, our approach achieves higher APFD value than the randomized approaches. So, our approach increases the effectiveness of the generated test scenarios.
5. Implementation and experimental results
In this section, we explain the implementation of our proposed approach for generating test scenarios using a state machine diagram. The proposed SMToTSG algorithm identifies the transformation of behavior between states in the state machine diagram. We apply SMToTSG algorithm to generate all the feasible test scenarios. We have developed a prototype tool named SM2TSG (State Machine to Test Scenario Generator)3 for generating test scenarios using the state machine diagram in XMI format. We implemented SM2TSG in Java language (Java 2) using Netbeans IDE 7.0.14. Input to SM2TSG is the XMI representation of UML 2.0 state machine diagram. We used IBM RSA 7.0 (IBM Rational Software Architeture) to draw the state machine diagram and subsequently exported this diagram to XMI representation. SM2TSG visualizes the Composite Control Flow Graph (CCFG) and Feasible Control Flow Graph (FCFG) as the output. SM2TSG consists of two main components: CFGImplementation and CFGvisualization. CFGImplementation first parses the XMI of state machine diagram and then converts it into CCFG and then transforms it into FCFG (Feasible Control Flow Graph). Taking FCFG as the input, CFGvisualization transforms it into the DOT language format 5 and produces an image to visualize the FCFG (Feasible Control Flow Graph). After that, we calculate the cyclomatic complexity of every node in CCFG. Then, we apply SMToTSG Algorithm on FCFG and generate the feasible test scenarios. Finally, we calculate the mean of brightness for every test scenario using firefly optimization algorithm and prioritized them according to the mean of brightness values. The prioritized test scenarios for our Bank ATM case study are shown in Fig. 4.
To further validate our proposed approach, we have considered more different case studies i.e. Cashier, Cruise Control, Elevator System, TCP (Transfer Control Protocol), Vending Machine, Automated Teller Machine (ATM), traffic signal, and SIP User agent client system. The characteristics of all the case studies are given in Table 6.
Table 6 Characteristics of the case studies.
| Sl. no. | Case Study | No. of States | No. of Transitions | No. of Composite states |
|---|---|---|---|---|
| 1. | Cashier | 12 | 21 | 1 |
| 2. | Cruise Control | 5 | 17 | 1 |
| 3. | Elevator System | 6 | 12 | 1 |
| 4. | TCP | 12 | 56 | 3 |
| 5. | Vending Machine | 7 | 28 | 1 |
| 6. | ATM | 10 | 17 | 1 |
| 7. | Traffic Signal | 4 | 4 | 1 |
| 8. | SIP User Agent Client System | 14 | 14 | 3 |
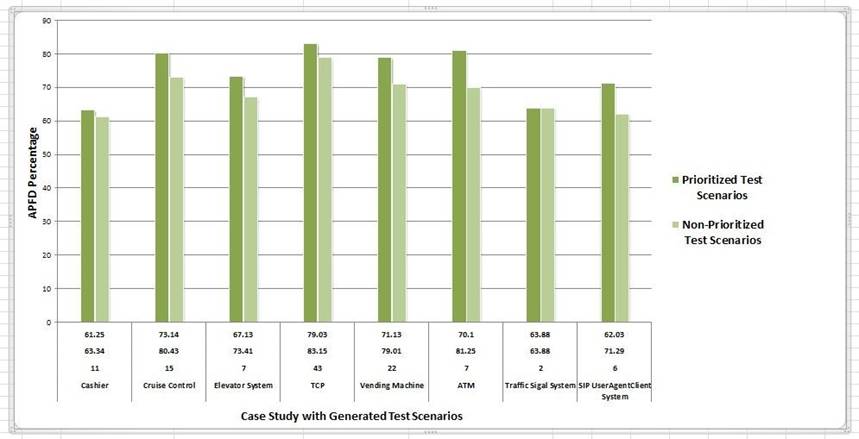
We have computed the computational time and the Average Percentage of Fault Detection (APFD) values for prioritized as well as non-prioritized test scenarios for all the case studies and shown them in Table 7 and Fig. 9. From Table 7 and Fig. 9, we observe that the APFD values of the prioritized test scenarios using our proposed firefly based approach are greater than that of the non-prioritized test scenarios using the randomized approach. This shows that our proposed firefly based approach has better fault detection capability than the randomized approach.
Table 7 Experimental Results.
| Sl. No. | Case Study | NTS | APTS | ANPTS | CTP (in ms) |
|---|---|---|---|---|---|
| 1. | Cashier | 11 | 0.7359 | 0.7284 | 3423.21 |
| 2. | Cruise Control | 15 | 0.7283 | 0.6948 | 3758.14 |
| 3. | Elevator System | 7 | 0.8187 | 0.6835 | 1923.41 |
| 4. | TCP | 43 | 0.6825 | 0.6784 | 8947.24 |
| 5. | Vending Machine | 22 | 0.6741 | 0.6485 | 5174.54 |
| 6. | ATM | 7 | 0.8492 | 0.7006 | 2133.821 |
| 7. | Traffic Signal System | 2 | 0.6388 | 0.6388 | 1437.52 |
| 8. | SIP User Agent Client System | 6 | 0.7129 | 0.6203 | 1958.87 |
NTS: # of Test scenarios for the different case studies, APTS: APFD values for prioritized Test Scenarios, ANPTS: APFD values for Non-prioritized Test Scenarios, CTP: Computational Time for Prioritization (in Milli Second).
5.1 Threats to validity
The proposed approach has the following threats to validity:
Here, we have considered only functional test requirements of software in System Under Test (SUT). We have not considered non-functional requirements.
Here, we have considered only nine types of faults. There may exist more number of faults such as message and dependency faults etc. in combine state machine diagram.
An automated system is desired to collect the unbiased and clear Observation Data (OD).
In this approach, we have considered moderate sized academic case study projects only, for our implementation. However, in industries the case study projects may differ and produce different results.
6. Comparison with related work
In this section, we present some related research work in the area of state chart based testing and prioritization techniques. Among all UML diagrams, most of the work on UML-based testing focuses on state chart diagrams Chen (2011), Kansomkeat and Rivepiboon (2003), Gnesi, Latella, and Massink (2004), Kim, Hong, Bae, and Cha (1999), Kalaji, Hierons, and Swift, (2009), Srivastava, Baby, and Raghurama (2009), Srivatsava et al. (2013), Swain, Mohapatra, and Mall (2010).
Chen (2011) proposed an approach that uses specification coverage to generate properties as well as design model to enable directed test generation using model checking. In our method, the number of test scenarios is reduced and the maximum number of test sequences is bounded by the number of predicates in a composite state machine.
Kansomkeat and Rivepiboon (2003) presented test sequence generation using UML state machine diagram. They transformed the state machine diagram into a flattened structure of states called Testing Flow Graph (TFG). They covered every possible event sequences in state chart diagram. In their approach, they have taken event sequences as test sequences.
Finally, they covered state based coverage criterion on the basis of state chart diagram.
Srivatsava et al. (2013) presented an algorithm for generating optimal discrete and independent paths for software testing. They have generated minimized test cases using firefly optimization algorithm.
Gnesi et al. (2004) presented a mathematical approach for conformance testing and test case generation using state chart diagram. They developed formal conformance testing relation for input-enabled transition system with transformations labeled by input/output-pairs (IOLTS). IOLTS shows a suitable semantic model for a state chart diagram. They also proposed an algorithm for test suite generation using state chart diagram.
Swain et al. (2010) proposed an object-oriented program based testing technique. Their approach is based on combination of state chart and activity diagram. They developed State-Activity-Diagram (SAD) model. Their technique could detect seeded integration testing faults.
Kansomkeat, Thiket, and Offutt (2010) presented a test sequence generation method from activity diagram which used condition classification tree method. Kim et al. (1999) presented the test case generation method based on IOAD. Kalaji et al. (2009) proposed an approach in which an EFSM contained states, variables and transitions among the states. EFSM of a class have an object state consisting of values assigned to data members. A transition has some guard conditions and actions associated with the variables. A transition in the class diagram occurs as an external input. The transition takes place when the guard condition is slaked and the associated actions are executed. A CFG in UML state diagrams is identified in terms of the paths in the resulting EFSMs. A significant advantage of our approach over the work Kalaji et al. (2009), Kim et al. (1999) is that, our approach generates optimal test scenarios by using composite state machine and covers all independent scenarios without redundancy.
Recently, Ant Colony Optimization (ACO) is being applied in software testing and Li and Lam (2005). Srivastava et al. (2009) described an approach involving ACO and a Markov Software Usage model for deriving a set of test paths for a software system, and Li and Lam (2005) reported some interesting results on the application of ACO to find sequences of transitional statements in generating test data for evolutionary testing. However, the results obtained so far are preliminary, the associated test data generation procedures are difficult to be automated, and none of the reported results directly addresses specification-based software testing.
We use composite states in state machine diagram to generate test scenarios to verify the behavior of models. In this approach, we proposed an algorithm called SMToTSG algorithm. After generating test scenarios, we apply Firefly algorithm for prioritizing the generated test scenarios. Our proposed approach is used to generate all feasible valid prioritized test scenarios for the System Under Test (SUT). Our technique considered some important coverage criteria like state coverage, transition coverage, and transition pair coverage. Our approach can handle transitions with guard conditions. We also applied Average Percentage Fault Detection (APFD) metric to calculate the efficiency of the prioritized test scenarios. Table 8 shows the comparison of our approach with some related approach.
Table 8 Comparison between our approach with others related works.
| S.No. | Approaches | Case Study | Generated Test Scenarios |
|---|---|---|---|
| 1 | Gnesi et al. (2004) | Cashier | 14 |
| 2 | Kalaji et al. (2009) | Cashier | 12 |
| 3 | Kansomkeat and Rivepiboon (2003) | Cashier | 12 |
| 4 | Srivastava et al. (2009) | Cashier | 13 |
| 5 | Our Approach | Cashier | 11 |
| 6 | Gnesi et al. (2004) | Cruise Control | 18 |
| 7 | Kalaji et al. (2009) | Cruise Control | 16 |
| 8 | Kansomkeat and Rivepiboon (2003) | Cruise Control | 16 |
| 9 | Srivastava et al. (2009) | Cruise Control | 18 |
| 10 | Our Approach | Cruise Control | 15 |
| 11 | Gnesi et al. (2004) | Elevator System | 9 |
| 12 | Kalaji et al. (2009) | Elevator System | 7 |
| 13 | Kansomkeat and Rivepiboon (2003) | Elevator System | 11 |
| 14 | Srivastava et al. (2009) | Elevator System | 9 |
| 15 | Our Approach | Elevator System | 7 |
| 16 | Gnesi et al. (2004) | TCP | 41 |
| 17 | Kalaji et al. (2009) | TCP | 44 |
| 18 | Kansomkeat and Rivepiboon (2003) | TCP | 48 |
| 19 | Srivastava et al. (2009) | TCP | 50 |
| 20 | Our Approach | TCP | 43 |
| 21 | Gnesi et al. (2004) | Vending Machine | 25 |
| 22 | Kalaji et al. (2009) | Vending Machine | 23 |
| 23 | Kansomkeat and Rivepiboon (2003) | Vending Machine | 25 |
| 24 | Srivastava et al. (2009) | Vending Machine | 28 |
| 25 | Our Approach | Vending Machine | 22 |
| 26 | Gnesi et al. (2004) | ATM | 9 |
| 27 | Kalaji et al. (2009) | ATM | 9 |
| 28 | Kansomkeat and Rivepiboon (2003) | ATM | 10 |
| 29 | Srivastava et al. (2009) | ATM | 9 |
| 30 | Our Approach | ATM | 7 |
| 31 | Gnesi et al. (2004) | Traffic Signal System | 3 |
| 32 | Kalaji et al. (2009) | Traffic Signal System | 3 |
| 33 | Kansomkeat and Rivepiboon (2003) | Traffic Signal System | 2 |
| 34 | Srivastava et al. (2009) | Traffic Signal System | 2 |
| 35 | Our Approach | Traffic Signal System | 2 |
| 36 | Gnesi et al. (2004) | SIP User Agent Client System | 7 |
| 37 | Kalaji et al. (2009) | SIP User Agent Client System | 10 |
| 38 | Kansomkeat and Rivepiboon (2003) | SIP User Agent Client System | 9 |
| 39 | Srivastava et al. (2009) | SIP User Agent Client System | 10 |
| 40 | Our Approach | SIP User Agent Client System | 6 |
7. Conclusion and future work
This paper presented a model based test scenarios generation and prioritization approach. In this paper, we applied our proposed algorithm named SMToTSG on State Machine Diagram for test scenarios generation. After generating the test scenarios, we apply Firefly algorithm to prioritize the generated test scenarios. Our proposed approach is used to generate all feasible valid prioritized test scenarios for the System Under Test (SUT). Our technique considered some important coverage criteria like state coverage, transition coverage, transition pair coverage etc. Our approach can handle transitions with guard conditions. Finally, we applied Average Percentage Fault Detection (APFD) metric to determine the efficiency of the prioritized test scenarios. We have implemented our framework semi-automatically. In future, we will focus on prioritizing the test scenarios by adopting some heuristic algorithms and compare the obtained results. We will also try to optimize the test scenarios using evolutionary techniques such as firefly algorithm PSO ect.

