


 text new page (beta)
 English (pdf)
 Article in xml format
 Article references
 Send this article by e-mail
 Cited by SciELO
  Similars in
SciELO
Similars in
SciELO 
 Permalink
1. Introduction
Bisphenol A (BPA) is a water soluble synthetic-organic compound that is widely used around the world. BPA is also an endocrine-disrupting chemical that can interfere with natural hormone cycles in humans and animals, potentially affecting metabolism, development, reproduction, and growth (Jackson & Sutton, 2008; Ullah. Ahmad, & Zheng, 2016). It also affects gametogenesis, metabolism and it induces adverse effects on reproductive organs during fetal development if mammals (Jackson & Sutton, 2008). It has been reported that low doses of BPA (even as low as 1*10-12 M) can also affect human health in general (Vomm Saal & Hughes, 2005).
BPA is extensively used in the polymers industry as monomer for the manufacture of epoxy and polycarbonate resins, plasticizers and flame retardants (Fromme et al.. 2002; Staples et al., 1998). The BPA based plastics are made into food and beverage packaging material or containers, electronic equipment, medical devices, dental fillings, water pipes, toys, among others (Cêsen et al.. 2018; Wu et al., 2018).
Residues of BPA have been found in environmental, food and biological samples (Fromme et al., 2002; Kang, Fondo & Katayama, 2006). Since BPA is highly soluble in water, it can be found in industrial and domestic wastewater. Therefore, the elevated concentration of BPA and the easy access of the humans to this compound could cause the diseases mentioned before (Kang, et al., 2006). Residues of BPA has been detected in lakes, rivers, wells, dams and even in drinking water in different countries (Belfroid, Van Velzen, Van der Horst, & Vethaak, 2002; Jackson & Sutton, 2008). In Mexico, water from surface and subterranean sources comply with 44 physical, chemical and biological quality parameters established by the law in order to be considered suitable for human consumption (Félix-Cañedo, Duran-Álvarez, & Jiménez-Cisneros, 2013). However, chemical analysis indicated that the ground and surface water samples are contaminated with BPA and other micropollutants (Félix-Cañedo. Durán-Álvarez, & Jiménez-Cisneros, 2013). Other researchers (Staples et al., 1998) have reported that water samples contain up to 14 g L-1 of BPA. In specific location in Netherlands and China surface water samples contain up to 330 ng L-1 and 4 μg L-1, respectively (Belfroid et al., 2002; Huang et al., 2012). These reports indicated that BPA is not completely removed by traditional wastewater treatment plants.
Conventional municipal wastewater treatment plants (Melcer & Klečka, 2011) cannot remove of BPA trough common physicochemical, biological, or electrochemical methods (Poerchmann, Trommler, & Górecki, 2010). In this sense, advanced oxidation processes (AOPs) could be an efficient method to degrade the BPA and other emerging micropollutants. Specifically, some research groups have tried to degrade BPA by oxidation with ozone (Colombo et al., 2012; Sharma, Mishra, & Kumar, 2015. 2016; Yang, Guo, Zhang, Deng, & Zhang 2016), photo-Fenton process (Cleveland, Bingham, & Kan, 2014: Escalona et al., 2014; Katsumata, Kawabe, Kaneco. Suzuki, & Ohta, 2004) and photocatalytic processes (Kuo. Wu, & Lin, 2010; Ohko et al., 2001). These results indicated that 60 % of BPA is completely mineralized to CO2 and water. Organic pollutants can be completely mineralized by the HO• radicals generated on the surface of a semiconductor catalyst illuminated with UV light (De Lasa, Serrano, & Salaices 2005; Fox, 1992; Fox, & Dulay 1993). Since any organic pollutant has a particular chemical structure, several intermediate organic products are generated during any photocatalytic degradation process (Legrini, Oliveros, & Braun, 1993; Leyva, Moctezuma,·& Noriega, 2017; Pirilä et al., 2015).
Several research groups (Da Silva et al., 2014; Okho et al., 2001; Tsai, Lee, Su, & Chang, 2009) have been studied the BPA degradation in order to determine the effect of different operating variables on the kinetics and reaction mechanism. One research group (Okho et al., 2001) studied the photocatalytic degradation of BPA in water (40 mg L-1) with UV irradiation (365 nm) during 20 h using 1.0 g L-1 of commercial ТiO2.Тhе reaction samples were analyzed by UV-vis spectroscopy, LC/MS. But, the collected data were not enough to determine the kinetic parameters of any degradation reaction rate equation. The analysis of reaction samples by LC/MS indicated that BPA was completely mineralized via formation of 3-(4-hydroxyphenyl)-3-methyl-2-oxobutanoic acid and 4-hydroxyacetophenone. However, these intermediate reaction products were not quantified. Other research group (Tsai et al., 2009) determined the optimal reaction conditions for the photocatalytic degradation of a 20 mg L-1 aqueous solution of BPA using commercial TiO2 P25 under UV irradiation (λmax= 365 nm). They reported that higher degradation is achieved with a catalyst load of 0.5 mg L-1. Even though, the paper points out that photocatalytic degradation of organic reactants follows a Langmuir ֊ Hinshelwood reaction model, these experimental results were not enough to calculate the kinetic parameters. Instead, the authors (Tsai et al., 2009) calculated the apparent reaction rate constant of a first order kinetic model that is a function of BPA initial concentration. The analysis of the reaction samples by GC-MS and HPLC indicated that phenol, hydroquinone, hydroxybenzaldehyde, hydroxy acetophenone and 4-hydroxyphenyl-2-propanol (Tsai et al., 2009) are the more abundant organic intermediate reaction products. Da Silva et al. (2014) studied the photocatalytic degradation of low concentration BPA (5 mg L-1) solution with a dosage of 120 mg L-1 of TiO2 under illumination light UV-C light (200 ֊ 280 nm) and UV-A light (315 ֊ 400 nm).
Other experiments that were carried out under UV-C light confirmed that TiO2 photocatalyst is the responsible for the in-situ formation of HO• radicals that transform the reactant molecule to several hydroxylated organic-compounds, which are latter mineralized to CO2 and water (Da Silva et al., 2014). Since the reaction samples were analyzed by UV-vis spectroscopy, the concentration of BPA as a function of time could not be determined, the kinetic parameter for the reaction rate equation were not calculated.
Up to date, the reaction mechanism for the photocatalytic degradation of BPA has not been completely elucidated. In this present work, we have studied the photocatalytic degradation of BPA aqueous solutions with commercial TiO2 P25 under UV radiation in order to identify and quantify some of the most stable aromatic intermediate reaction products. This information gave valuable information about BPA degradation reaction pathway. Since the photocatalytic degradation of any aromatic compound cannot fully described by a simple first order kinetic reaction rate equation, the kinetic parameters of the LH-HW model for the photocatalytic degradation of BPA were calculated.
2. Experimental
2.1 Materials
Bisphenol A (4,4-dihydroxy-2,2-diphenylpropane; CAS 80-05-7), catechol (1,2-dihydroxybenzene, CAS 120 80-9), 1,2,4-benzenetriol (CAS 533-73-3) and p-benzoquinone (CAS 106-51-4) all of them with the purity of over 99% were purchased from Sigma-Aldrich. Hydroquinone (1,4-benzenediol, CAS123-31-9), phenol (CAS 108-95-2) were purchased from J.K. Baker. The chromatographic grade solvents; methanol and acetonitrile were purchased from Fermont and ethyl acetate from CALEDON. Deionized water, filtered through 0.45 μm HA cellulose acetate membranes (Millipore Corp. Bedford, A, USA) was used throughout. Evonik-Degussa titanium dioxide (P25), a known mixture 80% anatase and 20% rutile, was used as catalyst for all the photodegradation experiments.
2.2 Adsorption experiments
The experimental adsorption equilibrium data were obtained in 250 mL Erlenmeyer flasks that were covered with a layer of aluminum foil. For each experiment, 100 mL of BPA aqueous solution with a specific concentration in the range from 20 to 100 ppm (0.088 - 0.438 mΜ) were placed in the Erlenmeyer flask and mixed with 0.2 grams of catalysts (TiO2 P25). The BPA solution and the catalyst were kept under vigorous agitation for 6 hours under dark conditions to allow equilibrium. Samples were taken from time to time and analyzed by UV-vis spectroscopy and HPLC to determine the amount of reactant adsorbed on the titania surface.
2.3 Photocatalytic degradation experiments
Photocatalytic experiments were carried out in a reactor system already described (Moctezuma, Leyva. Palestino, & de Lasa, 2007; Moctezuma, Zamarripa, & Leyva, 2003). It has a Pyrex glass tube reactor (400 mL) irradiated with four long wave UV lamps (15 W, λmax= 365 nm, Vilber-Lourmat T-15L), the system is equipped with a fan to cool down the reaction mixture. All the experiments were carried out at room temperature. For each set of experiments, 250 mL of BPA water solution with specific concentration 20, 40, 50, 60, 80 and 100 ppm equivalent to 0.088, 0.175, 0.219, 0.263, 0.35 and 0.438 mM were placed in the glass reactor and mixed with 2 g L-1 of TiO2. The reaction slurry was mixed under dark conditions to allow equilibrium adsorption of the BPA on the surface of the catalyst. Then, the UV light lamps were turned on and pure oxygen was bubbled through the system at a constant rate of 100 mL min-1. Reaction samples were taken from time to time for 6 hours to monitor the progress of the photocatalytic reaction by uv֊vis spectroscopy, HPLC and TOC. Before analysis, all reaction samples were filtered with a Millipore GV membrane (0.22 m pore diameter) GV. The pH of all reaction samples was also measured with a 710A Orion pH-meter. The identification of some single-phenolic intermediate organic reaction products was conducted by the technique of co-injection of standards during the HPLC analysis.
In order to determine the optimal amount of catalyst for the photocatalytic degradation of BPA a series of experiments were carried out in the same manner using a 100 ppm aqueous solution of the organic reactant varying the mass of TiO2 from 0.1 to 1.0 grams.
2.4 Ir spectroscopy studies about photocatalytic degradation of BPA
Other experiments of the photocatalytic degradation of a 114 ppm BPA aqueous were carried out in the same manner for specific reaction times (60, 180, 300 and 360 min) in order to identify some of the intermediate organic products generated during photocatalytic degradation of BPA by FT-IR spectroscopy. But, the organic products and the unreacted BPA were extracted from the reaction mixture using chromatographic grade ethyl acetate. The solvent of the organic layer was dried with anhydrous sodium sulfate and removed by evaporation under vacuum to yield some brownish crystals that was analyzed by IR spectroscopy (Leyva, et al., 2017)
2.5 Analytical methods
The reaction samples of the photocatalytic degradation experiments were analyzed by UV-vis spectroscopy in a Shimadzu UV-2401 PC instrument using standard quartz cells. The scan was performed from 190 to 400 nm. The concentration of BPA and the single -phenolic products in the reaction samples were determinate by HPLC analysis in a Thermo Scientific Surveyor HPLC equipped with UV-vis photodiode array detector. A Supelcosil LC-18 (150 mm x 4.6 mm x 5 μm) was used for separation of reactant and intermediate reaction products. The mobile phase was a mixture of deionized water-acetonitrile (45:55) delivered at a rate of 1.0 mL min-1. The wavelength of detection was set at 200, 225 and 275 nm. Standard solutions of different organic compounds were prepared and analyzed by HPLC to obtain a calibration curve in order to determine the retention time and concentration of intermediate organic reaction products and unreacted BPA in the samples of the photocatalytic degradation experiments. For these operating conditions, the retention times for 1,2,4-benzenetriol, hydroquinone, catechol, p-benzoquinone, phenol and BPA were 1.0, 1.6,1.8, 1.9, 2.2 and 2.8 minutes, respectively. The total organic carbon (TOC) content in the reaction samples (3 mL) was measured with a Shimad-ZU carbon analyzer model 5000 A. IR spectra were obtained in a Nicolet Ì510 FT-IR Thermo Scientific instrument equipped with an ATR diamond cell.
3. Results and discussion
3.1 Adsorption experiments
The results of the adsorption experiments are presented in Figure 1, which shows the concentration of BPA as a function of experimental time. As it can be seen, titanium dioxide adsorbs only a small amount of BPA. Therefore, equilibrium can be reached between 15 and 30 minutes. Those plots also indicate that the organic-molecules only form a monolayer on the surface of the catalyst.
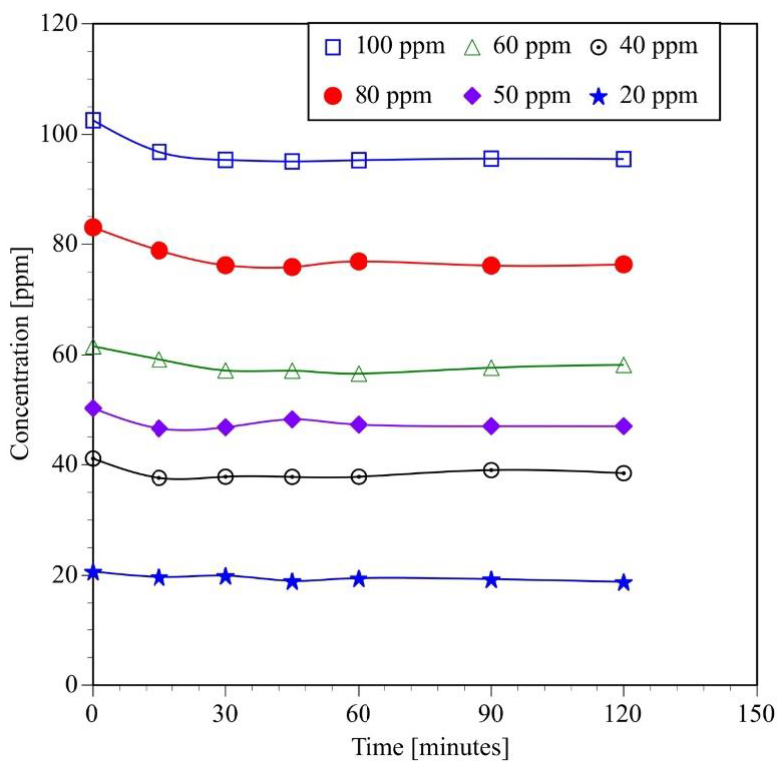
Fig. 1 Effect of BPA initial concentration on the adsorption capacity of TiO2 under dark conditions at room temperature (τ Ξ 25°C)
The Langmuir isotherm model was fitted to the experimental adsorption equilibrium data that is represented by Equation 1.
Where C eq is the BPA concentration in the aqueous solution at equilibrium, K eq is the constant of the Langmuir isotherm, qs is the uptake of BPA adsorbed on the surface of commercial TiO2 and qm is the maximum uptake of BPA per gram of catalyst.
The uptake was calculated by a simple material balance Equation.
Where V is the volume of the aqueous solution in the flask, W is the weight of TiO2, C0 is the initial concentration of BPA and C eq is the equilibrium concentration of BPA.
The Langmuir isotherm constants that were calculated by a least-squares method using the Delta Graph 7 software are qm = 0.021mmoles BPA g-1 TiO2 (4.79 mg BPA g-1 TiO2) and Keq = 3.77 mM-1 ppm).
3.2 Photocatalytic degradation of BPA
The effect of catalyst load on the mineralization of a 100 ppm BPA aqueous solution with TiO2 P25 is shown in the Figure 2. Even a small amount of catalyst in the order of 0.1 grams can be used to mineralize 34 % of the total organic present in 250 mL of a BPA solution (100 ppm) in six hours of reaction. As the catalyst load is increased, the UV light generates more HO• radicals and more atoms of carbon are transformed to CO2. But, the % mineralization reaches a maximum with a catalyst load of 0.5 or 0.6 g equivalent to a catalyst concentration of 2.0 and 2.4 g L-1, respectively. If more solids are added to the reaction mixture, UV light is absorbed by the catalysts layer located next to the reactor walls decreasing the concentration of HO•· radicals (Moctezuma, Leyva, & Zamarripa, 2003; Moctezuma et al., 2007). Therefore, mineralization percentage decreases.
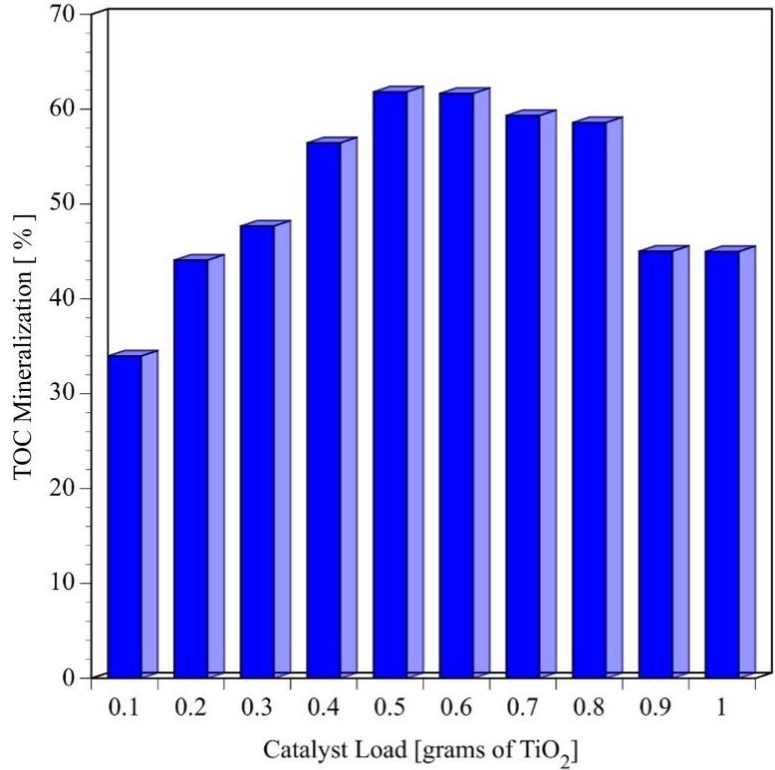
Fig. 2 Effect of TiO2 load on the mineralization of bisphenol A after 6 hours of reaction (Initial pH=6.6±0.2, V=250mL, C0=100ppm=0.438 mM, four UV lamps λmax=365 nm,O2 flow=100 mL min-1)
UV-vis spectra of reaction samples upon photocatalytic degradation of a BPA aqueous solution with a concentration of 60 ppm (0.264 mΜ) are shown in the Figure 3. The UV spectrum of a BPA (line SC) present two sharp bands at 205 and 275 nm that correspond to the π-π* and η-π* transitions of the aromatic ring. At high concentration, the wide band located at 225 nm overlaps one of the primary bands of the molecule. After addition of TiO2 to the reaction mixture, the intensity of the UV spectra decreases a little bit indicating that a small amount of BPA is adsorbed on the surface of the catalyst. As the photocatalytic degradation reaction proceeds, the intensity of the three bands decreases with reaction time indicating the simultaneous insertion of HO• and oxygen free radicals in the BPA molecule, which causes an aromatic ring rupture and the consequent formation of other organic byproducts. (Katsumata et al., 2004). After six hours of reaction, the three bands disappear indicating that aromaticity of the BPA molecule has been totally lost. Photocatalytic degradation experiments of aqueous solution of BPA with concentration of 20, 40, 50, 80 and 100 ppm exhibit the same behavior.
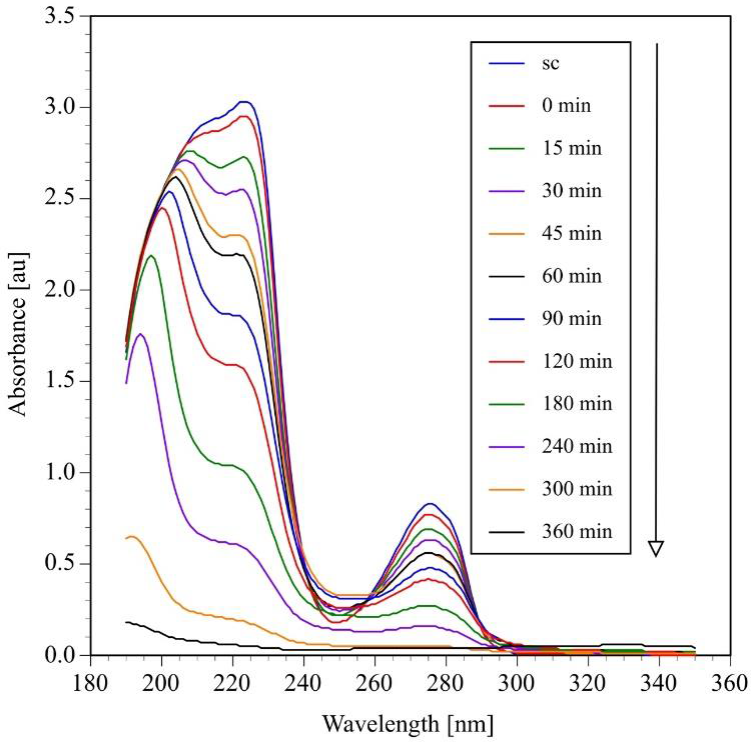
Fig. 3 Photocatalytic oxidation of bisphenol A monitored by UV-vis spectroscopy. (Initial pH=6.6±0.2, V=250mL, C0=60ppm=0.264 mML, TiO2=2gL-1 four UV lamps λmax=365 nm,O2 flow=100 mL min-1)
As mentioned before, several experiments of photocatalytic degradation of BPA solutions with 2 g L-1 of catalyst, UV light and a constant flow rate of oxygen were also carried out to determine the effect of initial concentration on the reaction rate of the process. The samples were analyzed by HPLC and TOC to determine the effect of initial concentration on degradation and mineralization of BPA molecules. The results of the HPLC analysis (Figure 4) indicate that 20 and 40 ppm BPA solutions are completely degraded in four hours. On the other hand, 80 and 100 ppm BPA solutions require more than 6 hours of reaction to be completely transformed to other organic compounds.
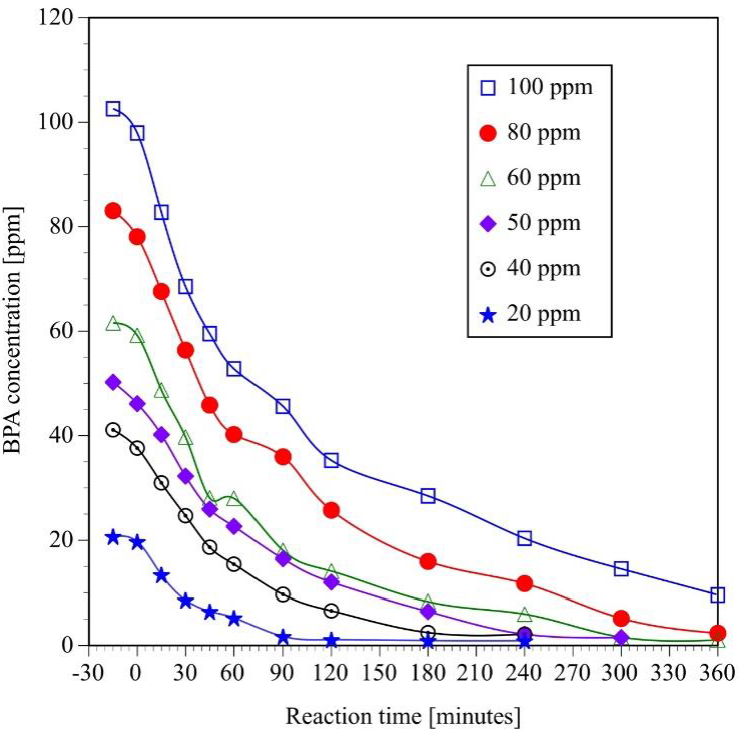
Fig. 4 Effect of initial concentration on the photocatalytic degradation of bisphenol A. (Initial pH = 6.6 ± 0.2, v = 250 mL, TiO2 = 2g L-1, four UV lamps λmax= 365 nm, O2 flow = 100 mL min-1, analysis of samples by HPLC).
The photocatalytic experiments were also monitored by TOC analysis in order to determinate the quantity of total organic carbon present in the reaction mixture. These results include the carbon of the unreacted BPA and its respective byproducts formed during the photocatalytic reaction (Figure 5).
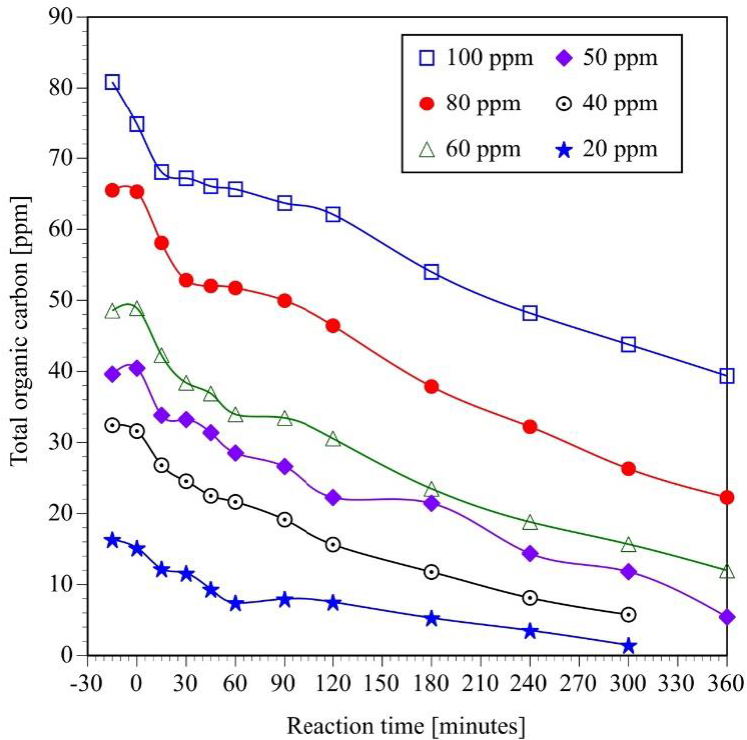
Fig. 5 Effect of initial concentration on the photocatalytic mineralization of bisphenol A (Initial pH = 6.6 ± 0.2, V = 250 mL, TiO2 = 2g L-1, four UV lamps λmax= 365 nm, O2 flow = 100 mL min-1, analysis of samples by TOG).
As expected, initial BPA concentration has a strong effect on the degradation and mineralization reaction rate. A 20 ppm BPA solution is completely mineralized in six hours of reaction. On the other hand, only 55 % of the carbon present in a 100 ppm BPA solution is mineralized in the same period of time.
It has been extensively reported that photocatalytic degradation reactions follow a pseudo first order reaction rate equation (Moctezuma et al., 2013), which is described by the following equation:
Where ra is the reaction rate (mM min-1), kар is the apparent reaction rate constant (min-1) C a is concentration of BPA. Experimental results presented in Figure 4 clearly indicate that the apparent reaction rate constant is a strong function of initial concentration. Therefore, the kinetic parameters that are reported in Table 1 were calculated by linear regression of a plot of the natural logarithm of relative BPA concentration as a function of reaction time. In this case, the reaction rate constant decreased as the concentration increases indicating that the reaction order shifts from first order to zero order. Then, the first order reaction rate equation must be originated from a more complex reaction rate equation. As previously reported in the literature (De Lasa, et al., 2005; Hermann 2010; Moctezuma et al., 2013: Ollis, Pelizzetti, & Serpone 1989), most of the photocatalytic degradation processes follow a Langmuir-Hinshelwood-Hougen-Watson (LH-HW) reaction rate equation
Table 1 Pseudo first order reaction rate constants and initial reacyion rates for the photocatalytic degradation of BPA solution with different initial concentrations (Initial pH = 6.6 ± 0.2, V = 250 mL, Co=100ppm=0.438 mM, TiO2 = 2g L-1, four UV lamps λmax= 365 nm, O2 flow = 100 mL min-1).
| Initial BPA concentration (Ca0) | K apparent (min-1) | R2 | Initial reaction rate r0 (mM min-1) | ||
|---|---|---|---|---|---|
| Theoretical | Experimental | ||||
| ppm | mM | (mM) | |||
| 20 | 0.088 | 0.084 | 2.43E-02 | 0.982 | 2.04E-03 |
| 40 | 0.175 | 0.175 | 1.48E-02 | 0.998 | 2.59E-03 |
| 50 | 0.219 | 0.209 | 1.13E-02 | 0.994 | 2.36E-03 |
| 60 | 0.263 | 0.260 | 1.17E-02 | 0.972 | 3.04E-03 |
| 80 | 0.350 | 0.349 | 0.86E-02 | 0.967 | 3.00E-03 |
| 100 | 0.438 | 0.456 | 0.76E-02 | 0.980 | 3.47E-03 |
According to De Lasa et al. (2005), r i is the reaction rate (mM min-1), K i is the kinetic reaction rate constant for the i species (min1), K j is the specific adsorption constant under reaction conditions for each of the i and j species participating in the reaction (mM-1) and C i/j is the species concentration in for each of the i and j in mM, n denotes the number of participating species.
At the beginning of the experiment, only small amounts of intermediate organic products are formed and the concentration of BPA is almost equal to its initial concentration. Therefore, the LH-HW reaction rate equation can be written in the following manner:
Where r а0 is the BPA initial reaction rate (mM min-1), K 1 is the kinetic reaction rate constant for BPA (min-1), К 2 is the specific adsorption constant under reaction conditions for BPA (mM-1) and Ca0 is the initial concentration of BPA (mM).
At Ioพ initial concentration of the reactant 1>>К2Са0, the photocatalytic degradation of BPA can be described by a first order rate expression. Whereas, for highly concentrated solutions К2Са0>>1, the LH-HW equation can be simplified to a cero order reaction rate equation.
In order to calculate the numerical values of K 1 and K 2, the initial reaction rates for the photocatalytic degradation of BPA were calculated with Equation 3 at է = O and C a =C aO using apparent reaction rate constant reported in Table 1. Then, initial reaction rate as a function of initial concentration was plotted in Figure 6. The numerical values of the constants of LH-HW model were calculated by nonlinear regression of the initial reaction rate and by linear regression of the double reciprocal of Equation 5 that it is expressed as Equation 6.
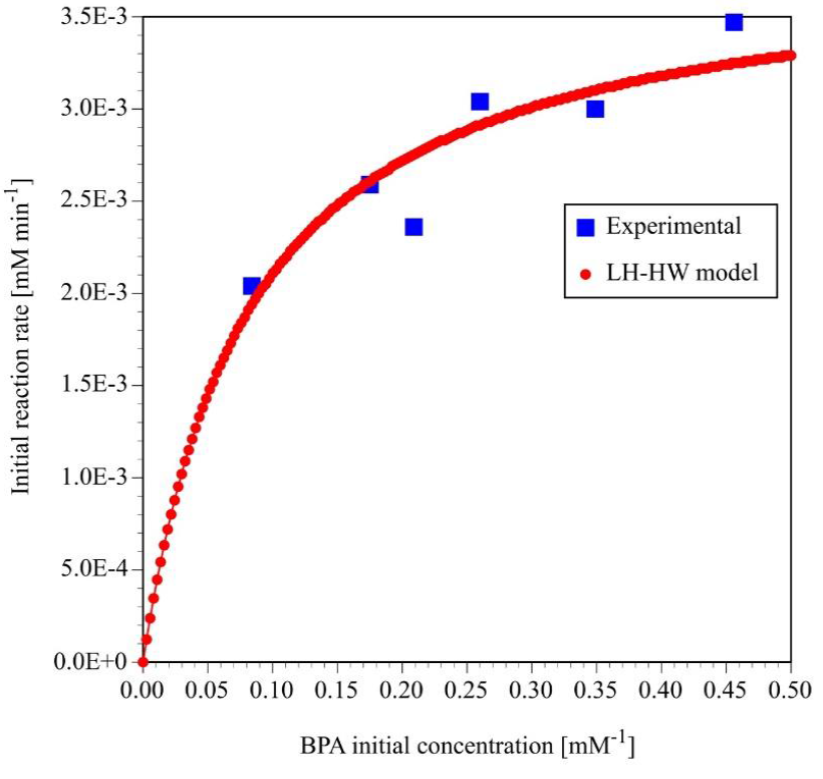
Fig. 6 Initial reaction rate as a function of the initial concentration for the photocatalytic degradation of BPA.
The values for the constants K 1 and K 2 are 0.0648 min-1 and 18.2713 mM-1, respectively. In order to validate the LH-HW kinetic reaction rate model, the initial reaction rates calculated with Equation 5 using the numerical values of K 1 and K 2 were also plotted on Figure 6.
The results of the chemical analysis of the reaction samples by UV-Vis spectroscopy, HPLC and TOC suggest that BPA is mineralized via formation of other organic compounds. Since the concentration of all those organic intermediate reaction byproducts cannot be easily determined, the fraction of the original reactant transformed to byproducts was calculated by a material balance based on HPLC and TOC analysis (Moctezuma et al., 2013). First, the relative dimensionless BPA and TOC concentrations are calculated using the following equations:
Where:
aCa = relative BPA concentration at any reaction time
Where:
Ca = BPA concentration at any reaction time (mM)
Ca0 = initial BPA concentration (mM)
aTOC = relative total organic carbon content at any reaction time
TOC = total organic carbon content at any reaction time (mM)
TOC0 = initial total organic carbon content at any reaction time (mM)
The fraction of BPA mineralized to CO2 is determined with Equation 9.
Finally, the fraction of BPA transformed to byproducts is calculated with Equation 7.
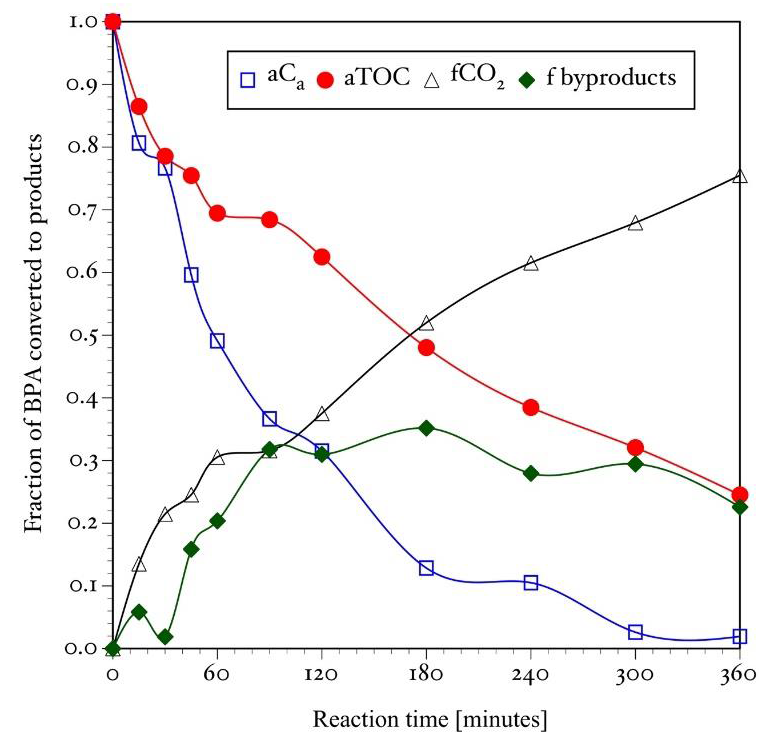
The results of the material balance for the photocatalytic degradation experiment of a 60 ppm (0.263 mM) BPA solution are shown in the Figure 7. It presents the relative concentration of unreacted BPA detected by HPLC, the relative TOC content of the reaction mixture, the fraction of the BPA transformed to byproducts and the fraction of reactant mineralized to CO2. Figure 7 clearly shows that organic intermediate reaction products remain in solution for long periods of time before being mineralized to CO2. Then, they may be identified by other analytical techniques.
3.3 Intermediates and reaction pathway in the photocatalytic degradation of BPA
Previous studies (Leyva, Moctezuma, Baines, Noriega, &, Zarazua, 2018) have shown that some of the aromatic organic reaction products of the photocatalytic degradation of medications can be identified by the technique of co-injection of standards during the HPLC analysis of the reaction samples. Results of the analysis of the photocatalytic degradation of a 114 ppm (0.499 mM) of BPA solution confirmed that the reactant is oxidized to benzenetriol, catechol, and phenol as previously reported in the literature (Da Silva et al., 2014; Kuo, et al, 2010). In addition, HPLC chromatograpłis indicated that BPA is also mineralized via formation of hydroquinone and benzoquinone. After these aromatic intermediate reaction products were identified, they were quantified using a calibration curve. These results (Figure 8) indicated that benzoquinone and catechol are the major products of reaction. As expected, their concentration increases with reaction time up to a maximum of about 0.25 mM at 240 minutes. BPA is also oxidized to benzenetriol and phenol. But, the maximum concentration of these aromatic-compounds is about 0.09 and 0.06 mM, respectively. Even tough, hydroquinone was fully identified by HPLC analysis, only traces were formed during the experiment.
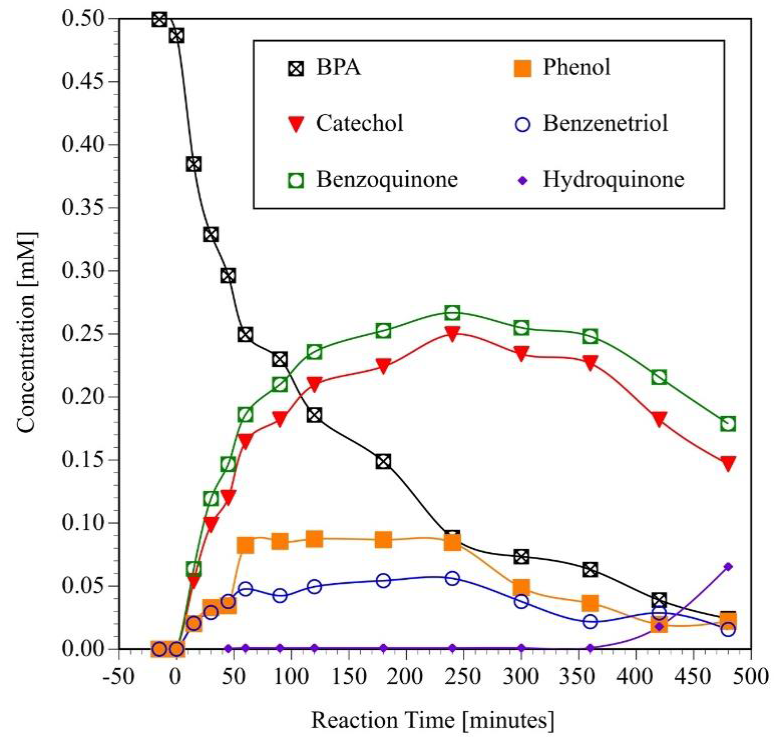
Fig. 8 Generation and consumption of aromatic intermediate reaction products during the photocatalytic degradation of BPA. (Initial pH = 6.6 ± 0.2, V = 250 mL, C0 = 0.499 mM = 114 ppm, TiO2 = 2g L-1, four UV lamps λmax= 365 nm, O2 flow = 100 mL min-1).
In order to monitor the changes in the chemical functional groups of the bisphenol A molecule, organic-compounds extracted from the reaction samples were analyzed by FT-IR, but only representative results are shown in Figure 9. A relative high intensity peak located at 827 cm-1 might belong to C=O and C=C stretching of both rings. The signal at 1050 Cnr1 is originated from the bending of the Csp3֊H bonds. The bands located at 1200, 1600 and 1700 cm1 are assigned to the stretching of C-O, C=C and C=O functional groups, respectively. The sharp band located at 3000 cm1 correspond to the stretching of C SPշ-H bonds. A broad band centered at 3300 cm1 correspond to the stretching of the O-H group (Lampman, Pavia, Kriz, & Vyvyan, 2010; Ullah, et al., 2016).
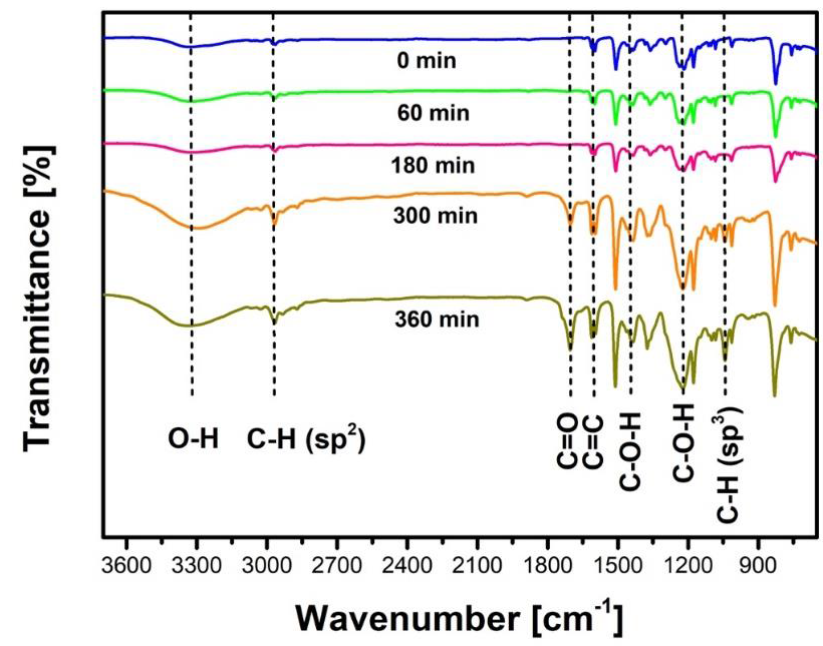
Fig. 9 Photocatalytic degradation of BPA monitored by FT-IR (Initial pH = 6.6 ± 0.2, V = 250 mL, C0 = 0.499 mM = 114 ppm, TiO2 = 2g L-1, four UV lamps λmax= 365 nm, O2 flow = 100 mL min-1).
It is important to point out that the intensity of the band of the C=O stretching (1700 cm-1) increases as the photocatalytic- reaction goes forward indicating oxidation of the molecules and the opening of the aromatic ring. The insertion of the HO · radical in the aromatic- ring is evidenced by the formation of the broad bad at 3300cm-1. Whereas the band located at 1600 cm-1 that correspond to the C=C stretching never disappears from the spectrum indicating that ring opening and loss of aromaticity is never fully achieved.
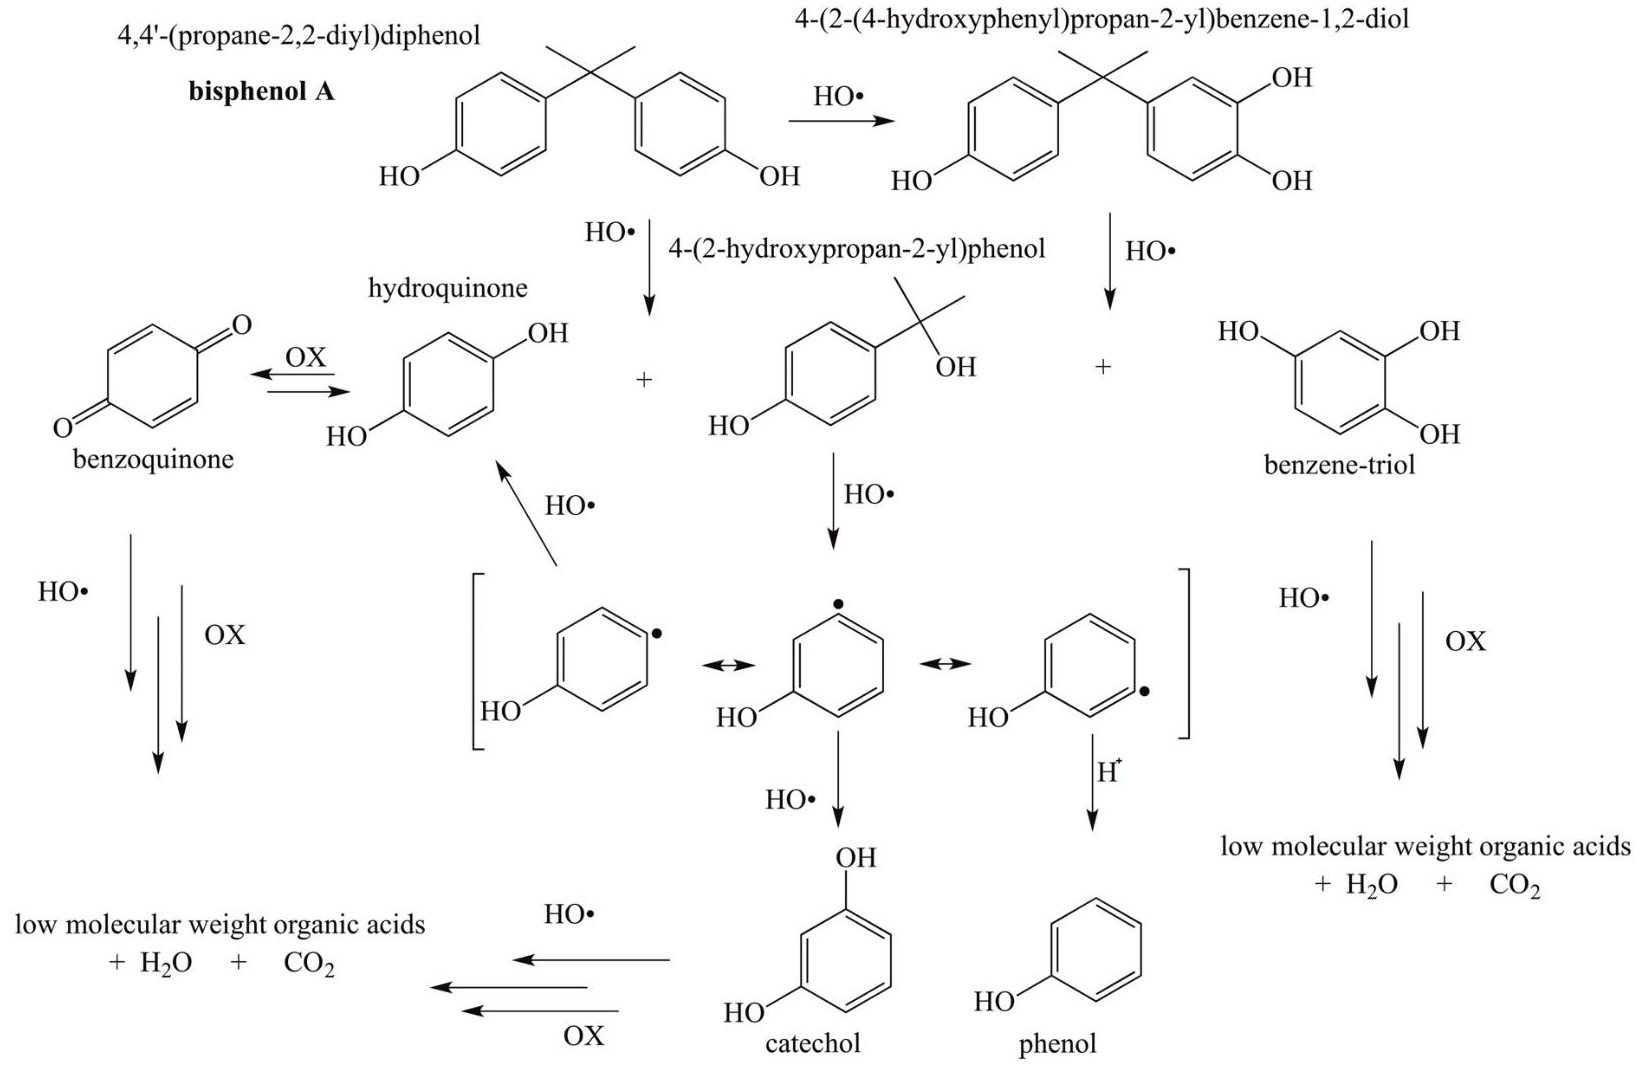
Analysis of the reaction samples by UV-vis spectroscopy, HPCL, TOC and FT-IR gave some important insights about the reaction mechanism of the photocatalytic- degradation of bisphenol A. At short reac tion times up to 120 minutes, the HO• radicals can oxidize the BPA molecule by two different routes. In the first one, radicals attack the quaternary carbon of the reactant forming hydroquinone (HQ) and 2-(4-hydroxyphenol) -2-propanol (HFP), which was not totally identified by us. But, it may correspond to an unknown aromatic- organic- compound that eluted at 2.5 minutes during the HPLC analysis. These results are in agreement with previous studies (Tsai et al., 2009). Then, hydroxyl radicals continue to attack the quaternary carbon of 2- (4-hydroxyphenol) -2-propanol allowing the formation of a resonance structure with a free radical in the aromatic ring, which allows the substitution of HO · radicals in either meta or para position to form catechol, hydroquinone and phenol. A highly oxidative reaction media favors the transformation of hydroquinone to benzoquinone.
In the second route, a HO · radical is inserted in ortho position with respect to the phenol in the BPA molecule to form 4-(2-(4-hydroxyphenyl) propan-2-yl) benzene-1,2-diol (BPA catechol) which is also oxidized to 2-(4-hydroxyphenol) -2-propanol and benzene-triol (Da Silva et al., 2014) All the organic-compounds with a single aromatic-ring can be oxidized to low molecular weight organic acids, which in turn are completely mineralized to CO2 and water. The proposed reaction pathways for BPA photocatalytic- degradation are shown in Figure 10.
4. Conclusion
Bisphenol A, a well know emerging water contaminant, can be efficiently mineralized by photocatalysis via hydroxylation of the two aromatic rings of the organic molecule. Kinetic analysis of the expe rimental results of BPA concentration as a function of time indicated that this photocatalytic degradation reaction follows a LH-HW reaction rate mechanism where the reaction order shift from first order to zero order as the reactant concentration is increased. The kinetic cons tant kl and the adsorption constant кг of the initial reaction rate equation are equal to 0.0648 min1 and 18.271 InM1L, respectively.
Analysis of the reaction samples by UV-vis spectroscopy, HPCL, TOC and FT-IR indicated that BPA is mineralized via formation of benzoquinone, benzenetriol, catechol, and phenol by two simultaneous reaction pathways. Even tough, hydroquinone was fully identified by HPLC analysis, only traces were formed during the experiment because the highly oxidative reaction media favors the transformation of hydroquinone to benzoquinone.

