


 text new page (beta)
 English (pdf)
 Article in xml format
 Article references
 Send this article by e-mail
 Cited by SciELO
  Similars in
SciELO
Similars in
SciELO 
 Permalink
1. Introduction
The micro-hardness test is a common procedure for determining mechanical properties of a small volume of materials. The principle of Vickers micro-hardness method is identical to macro-hardness test, except for test load lower than 1.691 N (200 g) (Sangwal, Surowska, & Blaziak, 2003). The micro-hardness can be used for the measurement of the hardness of small parts, thin layers and also to identify the phases in a metallography. The advantage of Vickers test is the independence of the applied load. The shape of the Vickers indentation is geometrically similar at all test loads. It is therefore expected that the value of the hardness is constant within the statistical precision over a very broad load range as long as the tested sample is reasonably homogeneous.
If a very low load is used, the measured hardness is usually high; with an increase in test load, the measured hardness decreases. Such a phenomenon is referred to as “normal” indentation size effect (ISE). Using a load dependent hardness in material characterization may result in some unreliable conclusions (Gong, Wu, & Guan, 1999).
The ISE may be caused by the testing equipment (the device for the measurement of indentation diagonals, the determination of the applied load belongs in this group (Gong et al., 1999; Ren, Hooper, Griffithsm, & Henshall, 2003; Sangwal et al., 2003), intrinsic properties of the tested material (work hardening during indentation, load to initiate plastic deformation, indentation elastic recovery, elastic resistance of the materials (Ren et al., 2003; Sangwal, 2000; Sangwal et al., 2003), the method of preparing the tested samples (grinding, polishing and the resulting residual stress) and possibly other factors (indenter/sample friction, lubrication and also corrosion (Gong et al., 1999; Ren et al., 2003; Sangwal, 2000; Navrátil & Novotná, 2009).
In contrast to “normal” ISE, a reverse (inverse, RISE) type of ISE, where the apparent micro-hardness increases with increasing test load, is also known. It mostly takes place in materials in which plastic deformation is predominant. Reverse ISE can be explained regarding the existence of a distorted zone near the crystal-medium interface, effects of vibration and bluntness of indenter, the applied energy loss as a result of specimen chipping around the indentation and the generation of the cracks (Sangwal, 2000).
In the literature, there are many examples, which reveal that the “normal” ISE occurs in brittle materials. On the other hand, the literature is scarce regarding the reverse ISE. It is reported mainly for materials undergoing plastic deformation (Sangwal et al., 2003). 99.5 % or "commercially pure" aluminum is an experimental material. It is wrought alloy, usually formed by rolling, forging, extrusion, pressing, and stamping. It is commonly used in the electrical and chemical industries, on account of having high electrical conductivity, corrosion resistance, and workability. The fact, that it can be strengthened by cold working, but not by heat treatment as well as its almost single-phase structure are the reasons for its choice as an experimental material. In this sense the inspiration was, for example, the contribution (Sulamet-Ariobimo et al., 2016), in which the authors unfortunately did not use the measurement of hardness or micro-hardness. The results with subsequent evaluation of the possible occurrence of ISE would be interesting. The purpose of this paper is to evaluate the influence of the reduction of the area and applied load on the micro hardness and the type and size of ISE effect. The specimen was fractured aluminum sample for the tensile test.
2. Experimental details
The investigation has been carried out on the sample of 99.5 % Al (STN 42 4004, conform with EN AW 1350).
Before the turning the sample for the tensile test, the blank was tempered 1 hour at
400°C followed by cooling with the furnace to increase the homogeneity and decrease
the stress. The tensile test was carried out on the tester 200 kN Zwick-Extensometer
according to standard ISO 6892-1 (ISO 6892-1,
2009). The mean strain rate
Table 1 Yield strength (YS), ultimate tensile strength (UTS), total elongation (TE) the reduction of the area (contraction Z) of analyzed sample.
| Test piece | UTS (MPa) | YS (MPa) | TE (%) | Zl (%) |
|---|---|---|---|---|
| G5-1 | 72 | 25 | 60.1 | 87.1 |
| G5-2 | 73 | 25 | 59.7 | 90.7 |
A longer part of fractured tensile piece G5-2 was used as a sample. It was cut in the longitudinal axis by cooled diamond saw, as can be seen in Fig. 1. Before cutting, the diameter of the piece was measured at regular intervals from the neck to the head. Dimensions parallel to the axis of the sample are measured with an accuracy 0.01 mm and dimensions perpendicular to the axis with an accuracy 0.001 mm.
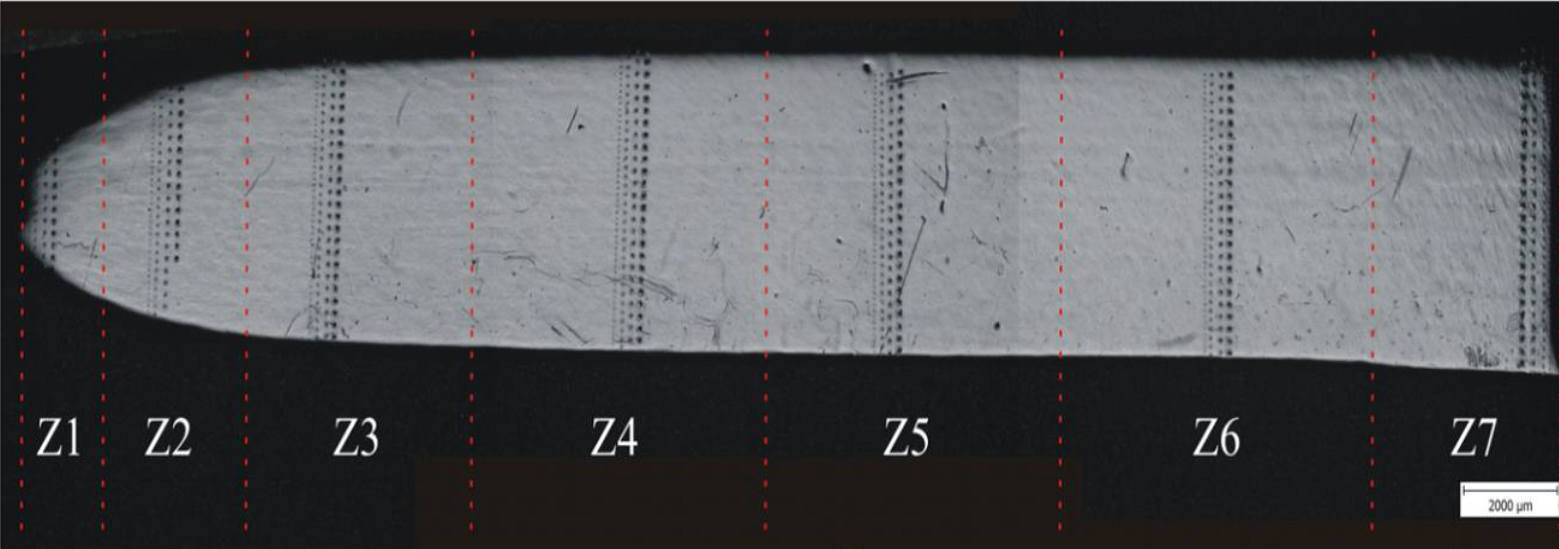
The local reduction of the area (contraction) Z1 - Z7 was calculated for each measured area according to standard (ISO 6892-1, 2009). Selected areas have been marked to ensure that the micro-hardness will be measured at a selected location with a known reduction of the area. Afterthe cutting, the sample was embedded in the resin (dent acryl) and gradually ground by the silicon paper 80 ANSI/CAMI grit to the plane of the longitudinal axis with intensive water-cooling. Fine grinding with papers in the sequence 220, 240 and 3000 ANSI/CAMI grit was followed. The metallographic surface was mechanically polished with the water suspension of Al2O3 to a mirror finish and finally etched with 0.5 % HF. The etching visualized hard intermetallic phases, firstly Al-Fe. The areas with the occurrence of intermetallic phases were avoided at micro-hardness measurement.
Micro-hardness was measured with tester Hanemann, type Mod D32 fitted to microscope
Neophot-32 with a magnification 480
The values of the experimental error in the form of relative expanded uncertainty Urel (coverage factor k = 2) calculated according to (ISO 6507-2, 2005) are listed in Table 2. The uncertainty of the reference block was not taken into account. It would be preferable, unfortunately unavailable to use the reference block with micro-hardness, comparable to the micro-hardness of aluminum sample.
Table 2 The values of local reduction of the area Z, the mean micro-hardness HV, micro-hardness HV0.05 and relative expanded uncertainty Urel.
| area No. | Z (%) | HV | HV0.05 | Urel (%) | v (μm s-1) |
|---|---|---|---|---|---|
| Z1 | 84.5 | 43.6 | 47.1 | 11.9 | 1.77 |
| Z2 | 53.1 | 36.7 | 38.4 | 10.8 | 2.10 |
| Z3 | 28.6 | 33.2 | 35.3 | 11.2 | 2.30 |
| Z4 | 19.1 | 31.0 | 32.7 | 12.9 | 2.55 |
| Z5 | 17.2 | 31.4 | 32.5 | 12.2 | 2.44 |
| Z6 | 14.7 | 31.0 | 32.5 | 11.5 | 2.47 |
| Z7 | 0.0 | 27.9 | 28.0 | 14.4 | 2.31 |
The same operator measured the micro-hardness of selected areas on the metallographic surface of the sample according to (ISO 6507-2, 2005). The applied loads P were 0.09807 N (10 g), 0.24518 N (25 g), 0.49035 N (50 g) and 0.9807 N (100 g). The load duration time was 15 seconds. The mean speed of the indenter’s penetration into the sample was calculated by method, described in (Petrík, Palfy, Blaško, Girmanová, & Havlík, 2016). Values of the speed (v, in m s-1) are in Table 2. The conditions in the laboratory met the requirements of the standards (ISO 6892-1, 2009; ISO 6507-2, 2005).
The result of the measurement was a “cluster” of 20 indentations at one area. The mean of micro-hardness of individual clusters HV, the micro-hardness HV0.05 and its relative expanded uncertainty Urel are in Table 2. The relationship between the local reduction of the area, load and micro-hardness are in Fig. 2.

Grubbs’ test (significance level α = 0.05) was used for detection of statistical outliers. Their presence would indicate measurement process suffering from special disturbances and out of statistical control. The normality was determined by Freeware Process Capability Calculator software (Anderson - Darling test). The normality and the outliers were determined for files involving values of one “cluster”. The values of micro-hardness of all “clusters” have normal distribution without outliers. Their absence suggests the process unimpeded by gross errors.
Analysis of variance (ANOVA) is a standard statistical technique and can be used to analyze the measurement error and other sources of variability of data in a measurement systems study (Chajdiak, 2009; Down, Czubak, Gruska, Stahley, & Benham, 2010). Two ways ANOVA compares the means of a single variable at different levels of two conditions (factors). According to two-way ANOVA with replication, the local reduction of the area Z (p = 7.09E-49) and the load (p = 2.39E-9) both have statistically significant effect on the measured value of the micro-hardness. The interaction between both factors is also statistically significant (p = 6.46E-6).
3. Results
Meyer’s Power Law and proportional specimen resistance (PSR) are two principal approaches to describe ISE quantitatively (Ren et al., 2003).
The simplest way to describe the ISE is Meyer’s Law:
The parameters n and A are determined by exponential curve fitting to indentation diagonal d (mm) versus applied load P (N) or n and Aln from straight line graph of ln (d) versus ln (P). Meyer’s index nor work hardening coefficient is the slope, and coefficient Aln is the y-intercept of the line. The index n < 2 for “normal” ISE, n > 2 for reverse ISE. If n = 2 the micro-hardness is independent of the load and is given by Kick’s Law.
The values of n and Alnare in Table 3. The nature of the ISE changes from reverse into ‘normal” with increasing of the local value of Z. The value of n above 2 is in the head of the sample and manifests reverse ISE, typical for plastic material. In contrast, it is less than 2 in the neck,where the influence of the work hardening decreases material’s elasticity. The relationship between reduction of the area Z and Meyer‘s index n can be seen in Fig. 3. The correlation between the Z and n is strong (r2= 0.7905).
Table 3 Meyer’s index n, indices Aln,a1, a2 and ratio a1/a2.
| area No. | n | Aln | a1 | a2 | a1/a2 |
|---|---|---|---|---|---|
| Z1 | 1.9580 | 5.297 | 0.938 | 204.6 | 0.004585 |
| Z2 | 1.9972 | 5.2551 | 0.6769 | 177.65 | 0.00381 |
| Z3 | 2.1090 | 5.509 | -0.577 | 190.3 | -0.00303 |
| Z4 | 2.0430 | 5.23 | -0.231 | 169.1 | -0.00137 |
| Z5 | 2.0794 | 5.3572 | -0.1665 | 170.95 | -0.00097 |
| Z6 | 2.0770 | 5.3359 | -0.4035 | 173.72 | -0.00232 |
| Z7 | 2.1016 | 5.3009 | -0.8986 | 167.3 | -0.00537 |

The proportional specimen resistence model of Li and Bradt (PSR) may be considered a modified form of the Hays/Kendall approach to the ISE (Gong et al., 1999). Several authors (Gong et al., 1999; Li, Liu, & Zhang, 2009; Ren et al., 2003; Sangwal et al., 2003) have proposed that the ISE may be described by the (2):
Li and Bradt pointed out that the parameters a1 (N mm-1) and a2 (N mm-2) of (2) are related to the elastic and plastic properties of the material, respectively (Li et al., 2009; Navrátil & Novotná, 2009).
The parameter a1 characterizes the load dependence of micro-hardness and describes the ISE in the PSR model. It consists of two components: the elastic resistance of the test sample and the friction resistance developed at the indenter facet/sample interface (Ren et al., 2003; Sangwal et al., 2003). The parameter a2 is directly related to load-independent micro-hardness sometimes referred to as “true hardness” HPSR (Gong et al., 1999).
Equation (2) may be rearranged in the form:
The parameters a1 and a2 of (4) may be obtained from the plots of P/d (N mm-1) against d (mm). Equation (5) can be regarded as a modified form of the PSR model.
The parameters c0 (N), c1 (N mm-1) and c2 (N mm-2) of (5) may be obtained from the quadratic regressions of P (N) against d (mm). Parameter c0 is associated with residual surface stress in the sample and parameters c1 ≈ a1 and c2 ≈ a2 are related, respectively with the elastic and plastic properties of the sample (Sangwal et al., 2003; Gong et al., 1999).
The ratio c1/c2 is a measure of the residual stress due to machining and polishing. A literature survey (Gong et al., 1999; Sangwal et al., 2003) reveal expected relationship between c0 and c1/c2, this fact confirms Fig. 4. The values of the indices obtained by modified PSR are given Table 4. The numerical values of c0 ,proportional to residual stresses in the sample, increases with increasing of micro-hardness and reduction of the area Z, as shown in Fig. 5.

Table 4 Indices c0,c1,c2 ratio c1/c2 A1 and W
| area No. | c0 | c1 | c2 | c1/c2 | W | A1 |
|---|---|---|---|---|---|---|
| Z1 | -0.146 | 9.146 | 109.10 | 0.08383 | 0.0320 | 207.7 |
| Z2 | -0.145 | 8.072 | 98.49 | 0.08195 | 0.0276 | 178.9 |
| Z3 | -0.068 | 2.788 | 155.00 | 0.01799 | -0.0070 | 182.4 |
| Z4 | -0.048 | 2.069 | 146.00 | 0.01417 | -0.0010 | 165.4 |
| Z5 | -0.081 | 3.735 | 131.31 | 0.02844 | 0.0035 | 166.7 |
| Z6 | -0.049 | 1.925 | 150.15 | 0.01282 | -0.0051 | 168.4 |
| Z7 | 0.072 | -4.240 | 200.44 | -0.02115 | -0.0278 | 161.2 |

Meyer’s index n decreases with increasing micro-hardness, as can be seen in Fig. 6. Inverse relationship between the micro-hardness and n was observed for CRMs made of iron or heat treated steel with micro-hardness between 195 HV0.05 and 519 HV0.05, heat - treated carbon steel and aluminum alloy EN 6082 or technically pure metals (Al, Zn, Cu, Fe, Ni, Co), all with reverse ISE (Petrik & Palfy, 2011; Petrík, 2014). Given examples were not, except for grinding and polishing, deformed.

The “true hardness” by analogy to a2 can be calculated as HPSRc2 using c2 in Equation (3).
Hays and Kendall proposed the existence of minimum test load W (N) necessary to initiate plastic deformation. Below it only elastic deformation occurs. In that event, the load dependence of hardness is expressed:
Where A1 (N mm-2) is a constant independent of load. The values of W and A1 may be obtained from the regressions of P (N) against d2 (mm) (Sangwal et al., 2003). The values of the indices obtained by modified PSR are in Table 4.
The “true hardness” by analogy to a2 can be calculated as HPSRA1 using A1 in Equation (3).
The relationships between the reduction of the area Z and rate between “true hardness” calculated with the aid of the indices a2, c2 and A1 and measured micro-hardness HV0.05 can be seen in Fig. 7. The tendency is the same for all used indices. The proportion between “true hardness” and the micro-hardness HV0.05 decreases with increasing of Z. The difference is most visible when using the index c2.

4. Discussion
Parameter c0 is associated with residual surface stress in the sample. As can be seen in Fig. 5 the residual surface stress logically increases with increasing the strain rate of the sample. The ratios a1/a2 and also c1/c2 are the measure of the residual stress due to machining and polishing. The entire sample was sawn, ground and polished under the same conditions. The ratio a1/a2 is only minimally affected by local reduction of the area. This fact essentially corresponds to reality - the entire surface of the sample was finalized in the same way. Conversely, the c1/c2 ratio is affected by the reduction of the area and has, as seen in Fig. 4, a relationship with parameter c0. The above statement “parameters c1 ≈ a1 and c2 ≈ a2 are related” would be appropriate to reconsider.
Hays and Kendall defined the parameter W as a minimum load necessary to initiate plastic deformation, therefore a creating a visible indentation.
However, visible indentations (and so with plastic deformation) were created with the load 0.009807N (1 g), which is less than some calculated values of parameter W listed in Table 4. This fact does not conform to the definition of parameter W. It would be appropriate to focus the research on both of these problems in the future.
It is necessary to remember the fact that the indirect calibration of micro-hardness testers is not routinely practiced process, unlike the (macro) hardness testers. We can determine the uncertainty of the measured micro-hardness only by the calibration. However, the uncertainty can significantly affect the type and size of ISE. It is possible that “normal” and reverse ISE are simultaneously the result of the same input values if the uncertainty is taken into account (with a coverage factor k = 2, and the probability of 95.45 %) (Petrik & Palfy, 2011).
In determining the type and partly the size of ISE, the impact of uncertainty was not significant in this case.
The ambiguity in the measurement of small indentations, particularly if pile-up or sink-in effects are present, can lead to over- or underestimation of diagonals (Petrík, 2014). Manual measurement of the diagonal is an important source of error in the Vickers method. It is the result of several factors including the operator's subjective decision in determining the indentation edge as well as his/her eyestrain as a result of the prolonged measurement (Petrik & Palfy, 2011).
5. Conclusions
The research was carried out on cold deformed 99.5 % aluminum - the alloy with high plasticity and with almost single-phase structure.
The influence of the reduction of the area (Z) and the load (P) on the measured value of micro-hardness is statistically significant.
There is a significant correlation between the reduction of the area (Z) and Meyer’s index n for aluminum.
Depending up the reduction of the area Z, the nature of the ISE changed from reverse in the area with minimum reduction of the area (the head of the tensile piece) to the “normal” in the area with maximal reduction of the area (the neck).
The difference between “true hardness” and measured micro-hardness HV0.05 increases with increasing value of Z.

