


 nueva página del texto (beta)
 Inglés (pdf)
 Artículo en XML
 Referencias del artículo
 Enviar artículo por email
 Citado por SciELO
  Similares en
SciELO
Similares en
SciELO 
 Permalink
1.INTRODUCTION
Viscosity is an important property of fluids and is related to internal friction mechanisms. To créate a fluid motion, some energy must be provided to break bonds between atoms and molecules and to make the fluid layers to move relative to one another (Secco, Kostic, & de Bruyn, 2014).
The concept of viscosity can be explained with the 2D system model of Figure 1(a), composed two parallel plates of área A and a fluid between them. A forcé of magnitude F is applied to the top píate making it move at a constant velocity, while the bottom píate is fixed. The top píate motion is transmitted to the underlying fluid with a velocity Vx that depends on the distance from the top píate (the fluid velocity is máximum for the layer near the top píate and zero for the layer near the bottom píate). In the case of laminar flow the following equation is valid:
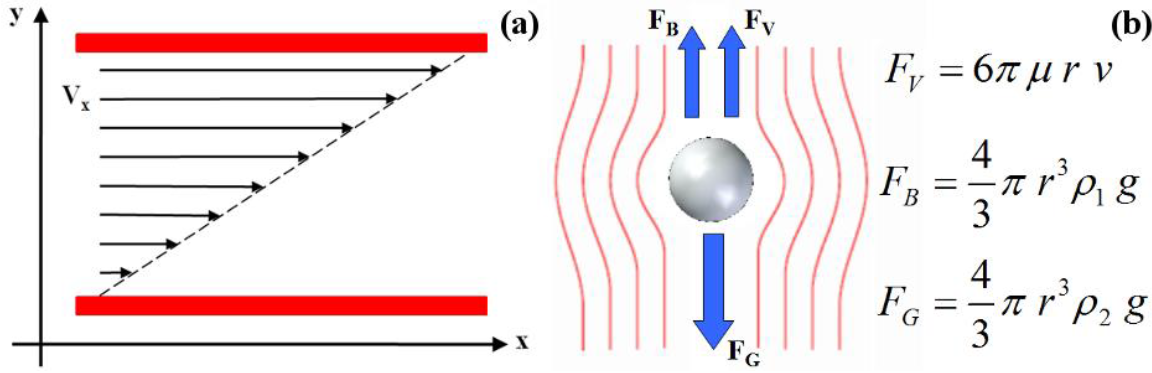
Fig. 1 System model used to describe the intcrnal friction of a liquid (a) and physical model of a sphere falling inside a liquid (b).
where µ is the fluid dynamic viscosity, measured in Pascal-seconds (Pa-s) in the International System (SI). In the case of Newtonian fluids the dynamic viscosity is independent of ∂Vx/∂y.
Indicating with ρ the fluid density (mass per unit of volume), the kinematic viscosity v, measured in m2/s, can be defined:
In the case of liquids, viscosity is a very important parameter in different fields of application. In the petroleum industry, for example, the ability to pump the oil out of the ground is related to its viscosity (Shu, 1984). In the food industry, the viscosity of different producís is strictly related with their organoleptic properties (De Wijk, Zijlstra, Mars, De Graaf, & Prinz 2008; Hernández, Chen, Johnson, k Cárter, 1995; Zijlstra et al., 2009). In the case of paints, the paint thickness depends on its viscosity, so different types of paints (for artistic paintings, indoor house painting, car painting,...) must feature different viscosities (Osterhold, 2000; Overbeek, Bückmann, Martin, Steenwinkel, & Annable, 2003). In cosmetics the product viscosity determines its consistency and the feel on the user skin (Brummer, 2006; Chiari, de Almeida, Correa, & Isaac, 2012; Gallegos & Franco, 1999).
Thus, viscosity measurements are necessary in various fields and steps within industrial production and a number of instruments, based on different working principies, exist that provide suitable accuracy. In rotational viscometers, for example, the system is composed of two parts with the liquid sample between them: the head unit is driven by a motor and maintained at constant velocity while the torque transferred to the other part (the spindle) is measured to estímate viscosity (Powell, 1993). Different implementations exist featuring different geometries for the head and the spindle such as concentric cylinders, cone and píate as well as parallel disks. In falling body viscometers, a body (usually a sphere, although cylinders and needles have also been used) is left to fall inside the sample and the viscosity is estimated from the time needed for the body to fall between two fixed points (Gui & Irvine Jr., 1994). In viscometers using the ultrasonic principie, a train of ultrasonic waves is generated inside the sample and the decay rate of the waves detected by a receiver is used to estimate viscosity (Nasch, Manghnani, & Secco, 1994). All these instruments make accurate measurements but are expensive and suitable for use within laboratory environment. On the other hand, low-cost, easy-to-use instruments for in-situ measurements are desirable in many different applications. Some recent examples in this sense are: a chemical sensor network for pH monitoring (Manjarres et al., 2016); a portable biosensor for bacterial concentration measurement in liquid and semi-liquid media (Grossi et al., 2011; Grossi, Lanzoni, Lazzarini, & Riccó 2012a; Grossi, Riccó, Parolin, & Vitali, 2017); a hydrogen gas detector card based on PIC12F1572 microcontroller (Niño & De Anda Salazar, 2016); a system for ice-cream characterization (Grossi, Lazzarini, Lanzoni. & Riccó, 2011, 2012b); a non-contact structural health monitoring system for machine tools (Goyal & Pabla. 2016) ; a portable sensor system for quality analysis in olive oil (Grossi, Di Lecce, Gallina Toschi, & Riccó, 2014: Grossi, et al., 2015; Valli et al., 2016); a mobile medical QR-code authentication system (Chang et al., 2015); an electronic portable device for non-destructive prediction of date moisture content (Mireei, Bagheri, Sadeghi, & Shahraki, 2016); an automatic titration system to measure oil concentration in metalworking fluids (Grossi & Riccó, 2017) ; a low cost portable pressure measurement system (Li, Liu, Wang, Shi, & He, 2012).
This work presents a portable electronic system to measure viscosity in liquid samples based on the falling sphere principie, where the sample viscosity is estimated by the time needed by a chrome steel ball to fall inside the liquid between two fixed points. With respect to a previous one, developed to measure the oil concentration in metalworking fluids (Grossi & Riccó, 2016), the new instrument presents substantial improvements. In fact the channel where the chrome steel ball falls has been made disposable, to treat also materials (such as paints and petroleum producís) for which cleaning after use would be difficult and time consuming. Moreover the system hardware has been re-designed to reduce the system cost and power consumption: the PT100 temperature sensor of the former implementation has been replaced with a low cost NTC temperature sensor; the commercial proximity sensors used to detect the presence of the sphere have been replaced with two ad hoc designed inductive sensors with benefits in terms of reduction of cost and power supply voltage.
2. EXPERIMENTAL APPROACH
The designed instrument is based on the falling sphere principie. Thus, a chrome steel ball (diameter 15.85 mm, density 7.85 g cm-3) is allowed to fall inside a 200 mm long polypropylene tube with infernal diameter of 16 mm. As shown in Figure 1(b) , the sphere is subjected to three forces: gravity (FG), buoyancy (FB) and viscosity (FV). The equation of the three forces are:
where ρ2 is the sphere density, ρ1 the sample density, r the sphere radius, g the gravity acceleration, µ the sample dynamic viscosity and v the sphere velocity.
Since the sphere falls with constant velocity, the total forcé acting on the sphere must be zero:
thus, denoting with L the length of the sphere fall (120 mm):
And
where tfall is the sphere falling time between the two fixed points and k is a constant depending on the geometry of the system (accounting also for the tube wall effects) (Viswanath, Ghosh, Prasad, Dutt, & Rani, 2007). Equation 8 shows how the sample dynamic viscosity μ can be estimated from the sphere falling time if the sample density is known.
The instrument of this work is based on an ad-hoc designed electronic board, featuring the microcontroller STM32F103R6 (by ST Microelectronics), responsible for all the operations (detection of the sphere passage at the two target points, measurement of temperature and tfau). The results are displayed using a monochromatic 2 lines x 8 columns text LCD and user interaction is achieved by means of four buttons connected to digital input pins of the microcontroller. The whole system is powered with four 1.5V AAA alkaline batteries.
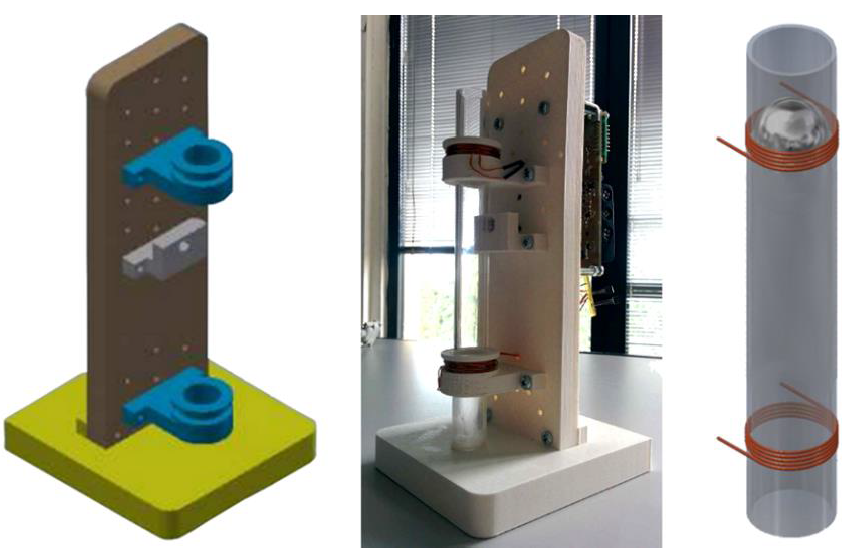
The structure of the system, depicted in Figure 2(a) , has been realized using a Makerbot Z18 3D printer with all the parts designed using the CAD software Inventor. A NTC temperature sensor (B57045K produced by TDK) is placed in cióse proximity of the tube. The sample temperature, essential to compénsate for viscosity variations due to temperature (T), is estimated from the measured ambient temperature. Thus, to achieve good aecuracy, the sample must be in thermal equilibrium with the ambient. A photograph of the system is presented in Figure 2(b) .
Both top and bottom detection sensor are implemented by two 30 windings copper wires of diameter 0.8 mm (Figure 2 (c) . Since the inductance of the sensor increases with the relative magnetic permittivity of the material inside the coil and for the chrome steel ball is about 100 times higher than the permittivity of air, the passage of the sphere at the two target points can be detected by measuring the inductance variation of the sensor. In particular, in our case the measured values of the inductance is 33 µH and 38 µH in the absence and presence of the sphere respectively.
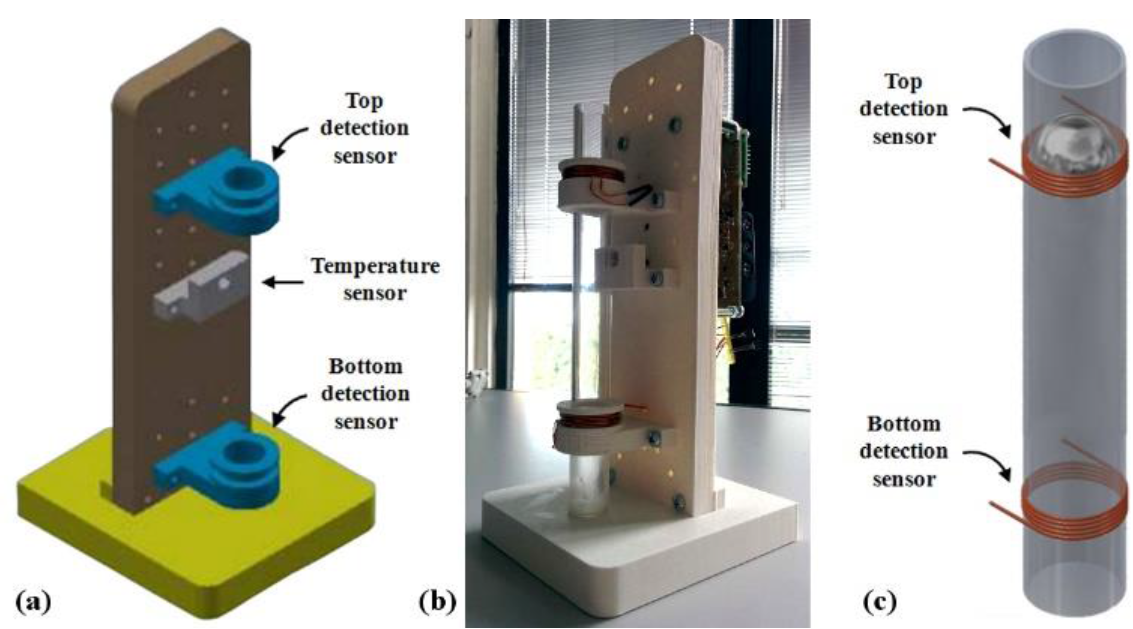
Fig 2 Schematic (a) and photograph (b) of the designed portable system to measure viscosity in liquids. Sensor used to detect the presence of the sphere at the two target points (c).
The passage of the sphere at the two target points is detected by means of the circuit shown in Figure 3. The top and botton detection sensor inductantes are connected in parallel between the nodes A and B, and together with the capitances C1 and C2 represent the main element of a Colpitts oscillator, whose output provides a sine-wave voltaje or no oscillation in absence or presence of the sphere, respectively.
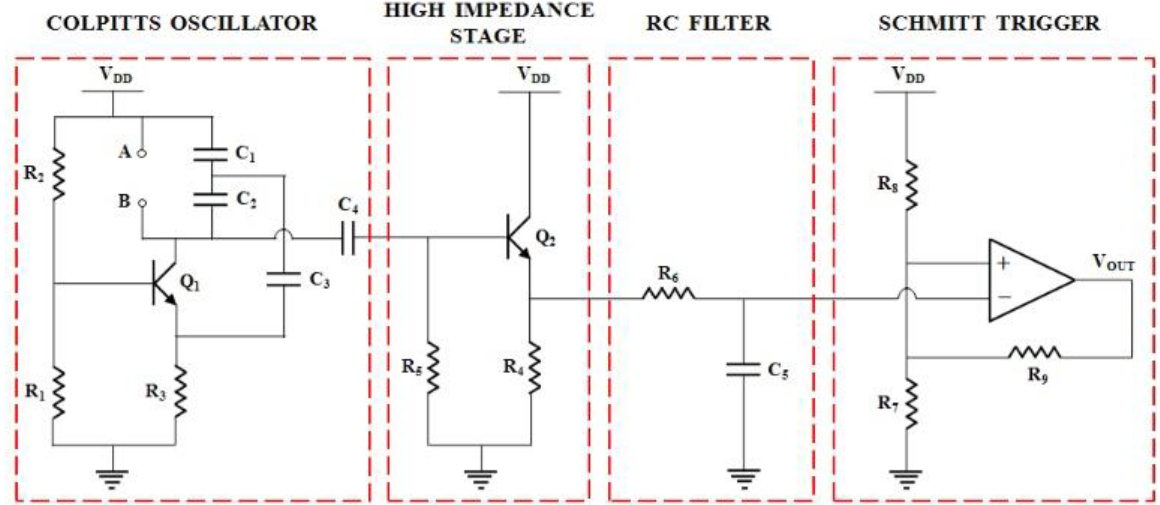
A high impedance stage is used to decouple the output from the rest of the circuit and a RC filter generates a DC voltage from de AC input (a DC value of 2.18 V and 0V in absence and precense of the sphere, respectively) Finally an inverting Schmitt trigger (realiced with a MCP601OT) rail-to-rail operational amplifier) is used to generate a digital signal (high in presence of the sphere) that is acquired by the microcontroller.
The designed system works as follows: first, the tube is filled whith the sample under test, then the temperature (T) is measured and the ball is allowed to fall inside the tube. When the sphere enters the top detection sensor. At this time, the sample viscosity is calculated from the measured values of tfall and T.
A video of the instrument performing a measure is presented in the Supplementary Video Material.
3. RESULTS AND DISCUSSION
The instrument presented in Section 2 has been tested with two different types of samples: tap water and metalworking fluids featuring different valúes of oil concentration.
The measurements with tap water have been carried out inside a thermal incubator (Binder APT KB 53) at four different temperatures: T = 15, 25, 35 and 45 °C.
The measured tfan vs T is shown in Figure 4(a) . As T increases tm decreases because of decrease of water viscosity. A simple empirical model, adequate within a limited range of temperature, was proposed by Reynolds (1886), that models the liquid viscosity as a negative exponential of the temperature:
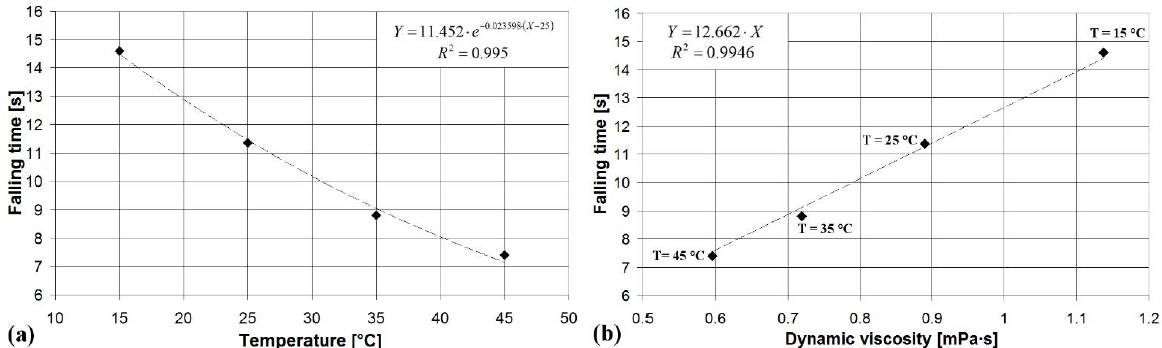
Fig. 4 Measured sphere falling time in tap water vs. temperature (a) Measured falling time vs. dynamic viscosity at 15°C , 25°C and 45°C (b).
where µ 0 o is the viscosity measured at temperature T0 and b is an empirical parameter.
Since, according to equation 8, there is a correlation between the viscosity and tfall, equation 9 can be rewritten as:
where, tfall.T0 is the measured tfall at temperature T0.
Equation 10 has been used to best fit the measured data of Figure 4 (a) . The parameters obtained from the fitting procedure with T0 = 25 °C are Tfall,T0 = 11.452 s and b = 0.023598 °C-1 The corresponding determination coefficient R2 is very high (0.995), thus validating the proposed model for tfall variation with temperature.
Figure 4 (b) shows tfall vs, water viscosity (values obtained from literature) for all the tested temperaturas. The data have been fitted with a linear regression line with zero offset (in accordance with the proposed model of Equation 8) and the achieved regression line is
With R2=0.9946
As T varies from 15°C to 45°C, tfall goes from 14.5 s and 7.14s (correponding to variation of 50.75%), while the variation of the water viscosity is between 1.1375 and 0.5958 mPa-s (corresponding to 47.62%).
Since the chrome steel sphere density is ρ2 = 7.85 g-cm-3 and the water density ρ1 varies from 0.9993 to 0.9912 g-cm-3 in the tested temperature range, the corresponding variation of ρ2 - ρ1 is only 0.1182%, thus almost all variation of tfall are due to variations of water viscosity µ, while in the modeling the water density can be approximated as a constant (ρ1 = 0.997 g-cm-3). Using Equation 8, the geometrical constant k can be calculated as:
Water viscosity has been estimated for all the tested temperatures using the developed model and the results are presented in Table 1.
Table 1 Water dynamic viscosity and estimated viscosity for the tested temperatures 15, 25, 35 and 45ªC
| Temperature (ªC) | Viscosity (mPa.s) | Estimated viscosity (mPa.s) |
|---|---|---|
| 15 | 1.137 | 1.153 |
| 25 | 0.89 | 0.897 |
| 35 | 0.719 | 0.695 |
| 45 | 0.596 | 0.584 |
As already mentioned , the designed system has also been tested with a set of three metalworking fluids (liquids used in the metalworking industry for cooling and lubrication).
The samples have been prepared by mixing a soluble oil product ("Spirit MS 8200" by Total) with tap water in different ratios to obtain samples featuring different valúes of oil concentration (C0¡i = 2%, 6% and 10%). Each sample has been tested in triplícate (the máximum deviation on the same sample is 0.3 s) and tfaii has been calculated as the average of the three measurements. These tests have been carried out at T = 27°C.
The measured tfall vs Coil is shown in Fig. 5(a). A good linear correlation (R2 = 0.9694) exists in the investigated Coil range (2% - 10%) and the corresponding linear regression line is
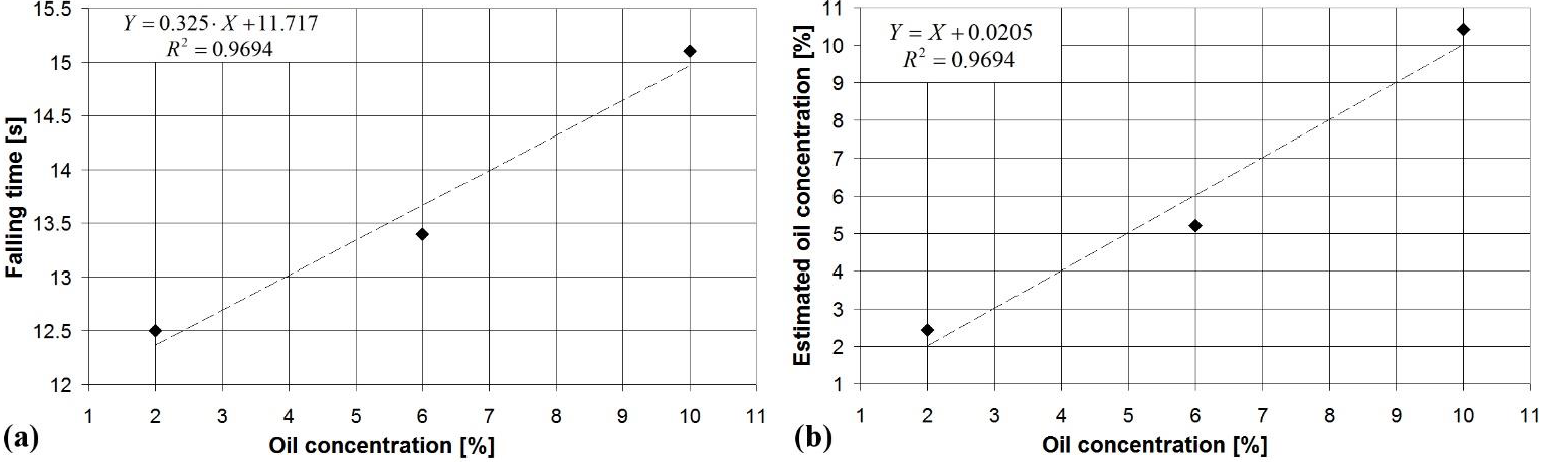
Fig. 5 Measured sphere falling time in metalworking fluids vs. sample oil concentration (a) Estimated vs. real oil concentration for metalworking fluids samples (b)
Using equation 13, the sample Coil can be estimated as presented in Figure 5(b) . The corresponding linear regression line has slope of 1 and offset of 0.0205, with a coefficient of determination of 0.9694. The error in the estimated C0u is lower than 1%.
Using the valué of k previously determined (11.524 • 10 3) and assuming that the sample density pi varies with C0l according to the function taken from literature (Grossi & Riccó, 2016)
the samples viscosity can be calculated from equation 8. The results are μ=0.9879, 1.0594 and 1.1942 mPa ∙ s for Coil= 2, 6% and 10%, respectively.
4. CONCLUSIONS
A portable electronic system with disposable cells for in-situ measurements of liquids' viscosity has been presented. The system is based on the falling sphere principie, features the microcontroller STM32F103R6 by ST Microelectronics and deteets the sphere passage by measuring the inductance of two copper wire coils, thus enabling measures also with opaque samples and/or opaque fall tube.
The system has been successfully tested with measurements of water viscosity in the temperature range 15 °C - 45 °C as well as measurements of viscosity of metalworking fluids (allowing the estimates of sample oil concentration).
The use of disposable cells allows simple measurements also on particular types of samples, such as paints and petroleum based producís, for which cleaning after use would be difficult and time consuming.
CONFLICT OF INTEREST
The authors have no conflicts of interest to declare.

