


 text new page (beta)
 English (pdf)
 Article in xml format
 Article references
 Send this article by e-mail
 Cited by SciELO
  Similars in
SciELO
Similars in
SciELO 
 Permalink
1. INTRODUCTION
Cáncer is a major cause of death worldwide and about 70 percentage of all cáncer deaths oceurred in low and middle-income countries. Projected estimation is profoundly rising to 13.1 million deaths in 2030. Since the origin of the disease remains unknown, early detection and diagnosis is the key for brain tumor control, which increases the success of the treatment, save lives and reduce the cost. Early detection of tumor in soft tissues such as the brain and breast at the cellular level is enhanced by Diffuse Optical Tomography (Schweiger, & Arridge, 1999). Tumor symptoms often mimic, causes less serious illness and henee prompt recognition of tumor symptoms and timely treatment can reduce the negative effects and increase the effectiveness of the treatment in children and adults. Diffuse optical tomography (Arridge. 1999) is a non invasive diagnosis tool to detect and classify the abnormalities of the soft brain tissues. Soft tissue functional imaging using NIR with wavelength ranging from 700nm-1000nm has a high potential in physical imaging modality due to non-ionizing nature of radiation. The forward model (Dehghani, Eames, & Yalavarthy et al., 2008) describes the light transport through phantom using approximate Diffusion Equation (DE). Diffusion equation characterized by absorption (µ a ), reducedscattering coefficient (µ’ s ), constant diffusion coefficient K(1/(3μa+μs')K the optical flux Φ(r) and the optical
source Qo(r). The forward model depicts the placement of NIR sources and detectors at least 2cm apart to prevent crosstalk (UmaMaheswari, & Sathiyamoorthy, 2016). Diffusion Equation modeled by Finite Element Method (FEM) (Sukanyadevi, Umamaheswari, & Sathiyamoorthy. 2013) under type III, Robin Boundary Condition (UmaMaheswari, & Sathiyamoorthy, 2016) extracts the optical flux at each point of phantom. Inverse Model reconstructs (UmaMaheswari, & Sathiyamoorthy, 2015) the phantom image by solving the optical flux objective function. Linearization of the objective function by Conjúgate Gradient method uses iterative Levenburg -Marquadt algorithm for image reconstruction. The Jacobian Matrix pictures the phantom at cell level based on the optical flux and the absorption coefficient. The efficiency of image reconstruction (Arridge, & Schotland, 2009) algorithm promotes the accuracy and precisión of DOT imaging. A problem encountered is to increase the reconstructed image resolution (Prakash, Dehghani, & Pogue et al., 2014; UmaMaheswari, Sathiyamoorthy, & Lakshmi, 2016) and to extract the boundary of the tumor región in soft tissue cell. To eradicate the above problem, we take the advantage of Fixed Grid Wavelet Network (FGWN) for image Segmentation. FGWN tool is proposed for skin cáncer boundary detection, the concept is under taken in DOT images to attain smooth tumor boundary. Features namely the boundary of the abnormal tissue cell is traced and image metrics are measured. In order to elimínate the operator dependency and to improve the diagnostic accuracy in DOT imaging we include segmentation and classification which forms beneficial means for brain tumor detection.
1.1 APPROACHES TO TUMOR BOUNDARY DETECTION - A REVIEW
Image Segmentation algorithms for Biomedical images are many fold, they are fuzzy C means clustering (Schmid. 1999; Norouzi, Rahim, Altameem, et al., 2014), thresholding (Ganster, Pinz, Rohrer et al., 2001), Gradient vector flow (GVF) (Erkol, Moss, Stanley, et al., 2005; Zhou, Schaefer, Celebi, et al., 2011) Support Vector Machine (SVM), quantitative assessment of tumor extraction (Iyatomi, Oka, Saito et al., 2006), j-image segmentation algorithm (Celebi, Aslandogan, Stoecker, et al., 2007), independent histogram pursuit algorithm (Gómez, Butakoff, Ersboll, et al. 2008), k-meansH-h (Zhou, Chen, Zou, et al. 2008; Norouzi, Rahim, Altameem, et al., 2014), statistical región merging (Celebi, Kingravi, Iyatomi, et al., 2008), adaptive snake thresholding based on type -2 fuzzy logic (Yuksel, & Borlu, 2009), wavelet transform (WT) fuzzy algorithms (Castillejos. Ponomaryov, Nino-de-Rivera, et al., 2012), iterative classification (Zortea, Skrvseth, Schopf, et al., 2011), modified random walker algorithm (Wighton, Sadeghi. Lee, et al., 2009) and hybrid thresholding on optimal color channels (Garnavi, Aldeen, Celebi, et al., 2011). Artificial Neural Networks (ANN) using fuzzy approaches for Segmentation of medical images have gained special popularity (Shen, Sandham, Granat, et al., 2005).
Wavelet Networks (WN) are preferred due to its characteristics of de-noising, background reduction and recovery of characteristic information. Flaws in Artificial Neural Network are overeóme by Wavelet Networks (Balabin, Safieva, & Lomakina, 2008) using an efficient optimization WN structure which forms a major benefit of Wavelet Networks. Wavelet Networks are divided into two groups as an Artificial Neural Network (ANN) and Fixed Grid Wavelet Network (FGWN). ANN (Cheng, Lin, & Mao, 1999; Jiang, Trundle, & Ren, 2010) have complex calculations, sensitivity to initial valúes and problem in measurement of initial valúes, henee their applications are limited. In FGWN, the outer parameters of the network have a number of wavelets, scale and shift parameters of the network are determined and only the inner parameters of the network (weights) are specified by Orthogonal Least Squares (OLS) algorithm. In fact, gain of applying wavelet networks since they do not need training (Galvao, Becerra. & Calado, 2004). In Artificial Neural Networks (ANN), initial valúes of network parameters are randomly selected and updated in training stage by gradient descent or back propagation (BP). Henee Optimized valúes of network parameters are calculated. In FGWN (Fixed Grid Wavelet Network) (Sadri, Zekri, Sadri, et al., 2013), the number of wavelets, scale and shift parameters are determined initially and the unknown weight coefficients are calculated by Orthogonal Least Squares (OLS).
Silveira, Nascimento, Marques, et al., (2009) proposed six methods for segmentation of skin lesions they are Adaptive Thresholding (AT), Gradient Vector Flow (GVF), Adaptive Snake (AS), Level set method of Chang et al (C-LS), Expectation - Maximization Level set (EM-LS) and Fuzzy -Based spilt and merge algorithm (FBSM). The true detection rate was 95% for AS and EM-LS, henee these methods are found to be robust assist the dermatologists in clinical diagnosis.
Schmid, (1999) has worked with color-based segmentation of dermoscopic images. The image segmentation was performed by modifying the versión of the Fuzzy C-Means (FCM) clustering technique. Gómez, Butakoff, Ersboll, et al., (2008) employed an unsupervised algorithm for segmentation of dermoscopic images namely Independent Histogram (IHP). They worked on the enhancement of different embedded structures in the images by estimating a set of linear combination of image bands which resulted in detecting precisión cióse to 97%.
Yuksel and Borlu, (2009) presented dermoscopic image segmentation by type-2 Fuzzy logic based on thresholding and the results were compared with adaptive thresholding and Otsu methods. Yazdani, Yusof, Karimian, et al., (2015) has projected an overall view on Supervised, Unsupervised, Feature based, Statistical and Model based segmentation methods on MRI brain images. They had analyzed thresholding, K means algorithm and Fuzzy C means in Unsupervised; KNN Classifier, Neural Network methods, Bayesian Classifier, Algebraic methods, Minimum Distance Estimation and Máximum Likelihood Estimation in Supervised; Expectation Maximization, Markov Random Field Method and Atlas based Segmentation in Statistical Methods; Región Based and Active Contour Based on Model based methods.
Wang, Liang and Jiang, (2008) employed phase contrast Diffuse Optical Tomography (DOT) system for detection of breast cancers. They automatically extracted the attributes, namely absorption, scattering and refractive index from Diffuse Optical Tomography images. The image Segmentation method applied was región based thresholding. The Support Vector Machine (SVM) classifier distinguishes the malignant images from the beginning based on the attributes. Sensitivity, Specificity and Overall accuracy, using absorption are 81.8%, 91.7% and 88.6% were as for scattering they are 63.6%, 83.3% and 77.1% respectively. Based on visual examination Sensitivity, Specificity and Accuracy are 81.8%, 70.8% and 74.3% respectively.
FGWN needs reduce training procedure, employing a specific Wavelet Network (WN) for Diffuse Optical Tomography (DOT) image segmentation is a three-layer FGWN with one hidden layer. At first the input data is normalized, a mother wavelet namely a Mexican Hat wavelet is employed due to its characteristics of adaptability to Gaussian structures and robustness against noise. Then, a wavelet lattice is formed which is in hyper shape with large dimensión. Therefore it is effectively decreased by shifting and scaling the wavelets. OLS algorithm used determines the optimized weights of the network. OLS transforms the set of regressor vectors into a set of orthogonal basis vectors and henee OLS is much faster than back propagation (BP). DOT image segmentation is performed by considering R, G, and B of the DOT images as inputs to FGWN.
In our work, we carried out the image segmentation of the reconstructed image by Diffuse Optical Tomography system. The remaining part of the paper is given as follows. Section 2 deals with research design and methods along with the experimental analysis, Section 3 comprises of results segmenting the reconstructed image and evaluation of the image quality using parameters such as root mean square error, peak signal to noise ratio, correlation coefficient and image quality index. Section 4 provides a discussion based on the evaluated results on comparison of FGWN with other segmentation algorithms as genetic and graph cut segmentations. In section 5, our conclusión proves that FGWN was best compared to genetic algorithm and graph cut segmentation algorithm to segment and obtain the exact tumor región size.
2. MATERIALS AND METHODS
2.1 WAVELET NETWORK STRUCTURE
The output signal of a wavelet network with one output y, d inputs
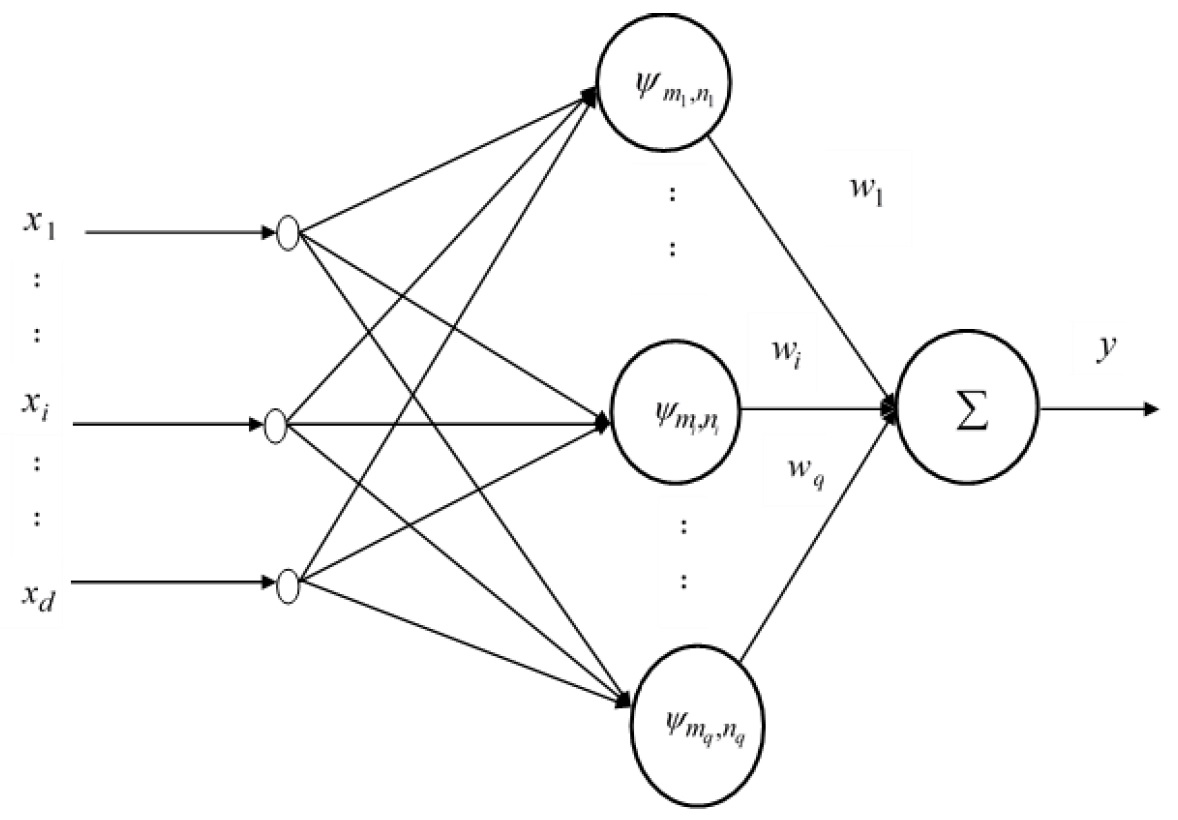
Fig. 1 Wavelet Network structure, denotes the input RGB valúes, represente the wavelets for each stage manipulatioii with weights and its suin is taken as output y.
Algorithm for FGWN
In Fixed Grid Wavelet Network, determine weights through orthogonal least squares algorithm for selection of best approximation of the effective wavelets.
M input and output data form is considered with vectors
-
Normalize (Barón, & Girau 1998) the data, if the data are in wide range, it is normalized to avoid data scattering. If the kith input T k = max q=1 ..... d x q (k) ,t k = min q=1 ..... d x q (k) then map the input data to a range [a, b].
Choose the scale as minimum and máximum form and shift parameters as
-
Wavelet lattice formation is calculated for all input vectors using the following equation,
where i=l,....mmax-mmin+l. Number of nodes are lowered and shifted in scale parameters, and then effective wavelets are identified.
-
Scale level is selected as Ik is formed for each input vector (Zhang, 1997) as
Where ϵ = 0.5, to elimínate shift and scale parameters, a small positive number chosen for simplicity which provides effective support for wavelets.
-
Shift and scale parameters in the set I
Where Iki and Fi are different node sets which are selected from the lattice.
-
Form the wavelet matrix (Zhang, 1997), as L is the number of wavelets in the last stage
The output vector is constructed as
Where θ LX1 = [w 1 ,.......w L ] T . The orthogonal least squares (OLS) algorithm (Davanipoor, Zekri, & Sheikholeslam, 2012) is applied for evaluation of the weights. Most significant wavelet is selected (Zhang, 1997) and made orthogonal to other wavelets.
Second significant wavelet is selected and made orthogonal to other wavelets; similarly the other significant wavelets are selected and made orthogonal to other wavelets. The W matrix is composed of ortho-normal matrix Q and upper triangular matrix A (W=QA), hence y is decomposed as
Where Q is ortho-normal matrix, A is an upper triangular matrix, θ includes the weights of the hidden layer.
2.2 EXPERIMENTAL ANALYSIS
The Experimental setup consists of six pairs of láser diodes with photo-detectors mounted on the head by a headband as shown in Figure 2. The láser diodes are OPV310 (850nm) and D7805I (780nm) displayed in Figure 3(a) were activated with a switching time of 3.3ms.The láser diodes were operated in RF range of 1.1 MHz and 1.2MHz respectively. The headband mounted on the brain tissue had the NIR wavelength láser sources and detectors embedded, henee the light was incident on the soft tissue. To avoid crosstalk, six photo-detectors OPT101 were placed with each pair of láser diode at an optimal spacing of 2cm. The inbuilt trans-impedance amplifier in photodiode OPT101 produces an output linear voltage increasing with light intensity. Figure 3(b) depiets the switching of the láser diode array controlled by AT89C51 microcontroller which activates the switching activity by a control signal.
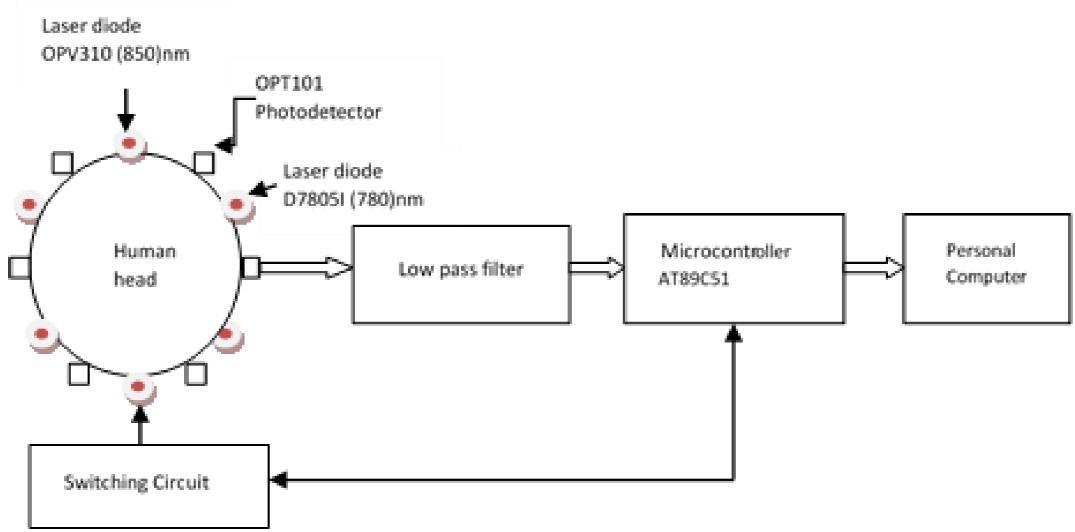
Fig. 2 Block Diagram of Diffuse Optical Tomography Experimental Setup. Illustrates the human head with a group of sensors as D78Ü5I, OPV310 as source and OPT101 as detector, with noise filter, switching and control from AT89C51 interfaced with Personal computer.

Fig. 3 (a)Laser Sources and Photo-detectors in head band. Switching, signal processing and control circuit.
The incident voltage of OPV310 was 2.2 volts and D7805I was 3.5 volts with a máximum of l.lmW and 5mW of power. The Photodiode is operated in photoconductive mode for high linearity and low dark current. The signal processing circuit consists of low pass filter to filter the photodiode noise voltages. The photodiode voltage fed to the serial port of a personal computer via RS232C gets collected on the MATLAB workspace. The input photodiode response voltages were manipulated to obtain absorption coefficient (μ a in cm1), reduced scattering coefficient (μ s in cm-1) and photon flux ϕin arbitrary units (a.u.)). Phantom image reconstructed suffers from spatial resolution due to forward problem in experimental setup design.
The scattering and absorption power of tumor cells in soft tissue is higher than normal cells. Photo-detector fed to personal computer ranges from (0-5) volts, i.e. (2.63 4.2) volts for normal cells and (4.3-5) volts in case of carcinoma OPT101 response voltages are high, ranging from 31-36 volts in the case of carcinoma cells, however in normal cells it ranges from 19-30 volts. Photo-detector response electrical voltage signáis were measured, filtered and fed to analog to digital converter interfaced with personal computer. The photo-detector response voltages were obtained from the brain tumor patient and further based on the tissue structure, properties namely diameter, área, length of penetration along with photo-detector response voltages absorption and reduced scattering coefficients were computed. Photonic flux or optical flux of the phantom was determined by boundary element method. Table 1, presents the Photo-detector response voltage and estimated absorption coefficient, scattering coefficient and optical flux.
Table 1 Photodiode Response voltages, Absorption and Scattering coefficients with Optical flux.
| Response | |||||||||
|---|---|---|---|---|---|---|---|---|---|
| Photo detector Volts | Absorption And Scattering Coefficient cm-1 | Optical flux ϕ a.u. | |||||||
| s. No | Ph1 | Ph2 | Ph3 | Ph4 | Ph5 | Ph6 | μ a | μ s | |
| 1 | 26.818 | 28.302 | 29.485 | 27.328 | 25.943 | 29.279 | 0.81 | 06.5938 | 5.4293E-015 |
| 2 | 28.987 | 26.491 | 26.827 | 27.333 | 29.295 | 26.592 | 0.79 | 07.4395 | 6.2945E-015 |
| 3 | 26.201 | 29.544 | 27.382 | 29.892 | 25.602 | 27.937 | 1.01 | 10.2960 | 9.5427E-015 |
| 4 | 29.583 | 26.391 | 28.497 | 29.894 | 25.495 | 26.333 | 1.02 | 13.2945 | 8.3296E-015 |
| 5 | 27.947 | 28.000 | 26.400 | 25.737 | 29.894 | 27.489 | 0.95 | 09.6826 | 7.4931E-015 |
| 6 | 28.111 | 29.735 | 26.949 | 27.295 | 26.937 | 29.281 | 0.78 | 08.4532 | 3.9632E-015 |
| 7 | 28.914 | 27.956 | 29.281 | 26.483 | 27.321 | 29.924 | 1.00 | 09.2968 | 7.8111E-015 |
| 8 | 26.598 | 28.905 | 29.900 | 27.489 | 26.598 | 28.287 | 0.76 | 08.2967 | 6.7892E-015 |
| 9 | 29.888 | 26.219 | 27.994 | 29.564 | 28.857 | 26.999 | 0.82 | 07.3825 | 8.2811E-015 |
| 10 | 29.901 | 26.487 | 27.389 | 28.963 | 28.309 | 27.945 | 0.96 | 10.2469 | 9.2450E-015 |
| 11 | 27.989 | 29.342 | 26.289 | 28.897 | 26.945 | 27.653 | 0.94 | 11.2378 | 9.6321E-015 |
| 12 | 28.963 | 29.236 | 27.478 | 27.789 | 26.567 | 29.894 | 1.15 | 15.2674 | 9.9568E-015 |
The photo-detector voltage subjected to signal conditioning circuit is interfaced with personal computer via RS232C. The incident and scattered voltage input is fed to calcúlate the input Intensity (I0) and output Intensity (Id). Later, from Lambert-Beer law for various tissue thicknesses the absorption and scattering coefficient as listed in Table 2. The optical flux obtained under semi-infinite boundary condition is subjected to reconstruct the image (UmaMaheswari, & Sathiyamoorthy, 2016). Image Reconstruction was obtained using MATLAB R2013a linked to NIRFAST tool, the input absorption coefficient [i a , scattering coefficient [i s and optical photon flux # using the diffusion equation solving in Finite Element Method (FEM) with
Robín boundary condition in the forward model. Inverse Model using Gauss Newton Method makes the reconstruction possible using the Jacobian matrix linear equation. Diffuse optical tomography image reconstructed from NIRFAST was subjected to Image segmentation algorithm, namely Fixed Grid Wavelet Networks.
Table 2 Data collection of Tumor patient.
| Patient ID | #01 | Date | 07.1.2013 |
| Age | 42 | ||
| MRI | Brain | Weigth | 68kg |
| Screening of Disease | 6 months |
The patient data obtained by adopting screening test using MRI sean from the hospital as shown in Table 2 and Figure 4 was analyzed for the prediction of brain tumor. The patient was subjected to surgery for removal of sarcoma (soft tissue tumor), on further investigation the patient has undergone therapy for one year and discontinued the diagnosis for six months. Therefore, patient was subjected to screening test using our experimental setup and MRI, which was comparable for assertion of tumor presence in the brain.

3. RESULTS
The absorption and scattering images reconstructed from NIRFAST was subjected to vignette correction in order to extract the boundary of the tissue structure. Vignette correction technique enhances the image quality which in turns extraets the máximum number of pixels from the image.
This technique was introduced in the diffuse optical tomography images for diagnosis of carcinoma cells in soft tissues of brain and breast. To determine the vignette effeets in an image, the most straightforward approach involves capturing an image completely spanned by a uniform scene región, in which brightness variation oceurs in the vignette. To guide the vignette-based segmentation process and promote robust vignette estimation, the reliability of data in each image región was evaluated as shown in Figure 5, which was used as a región weight. A región is considered to be reliable if it exhibits consist with physical vignette characteristics and conforms to vignette observed elsewhere in the image.

Fig. 5 Vignette correction (Row1) resolution improved by each iteration and tumor región defined finally (Row2) vignette correction output on iteration . (Row3) the weights defined in wavelet spectrum on iteration.
Here a specific Wavelet Network for segmentation of diffuse optical tomography images was applied. Wavelet Networks are divided as: adaptive wavelet networks and fixed grid wavelet network. So there is no need to specify random, initial valúes for parameters or to use gradient descent, back propagation or other iterative methods.
Approximation of the images was carried out in various axes such as the horizontal axis, vertical axis and from the diagonal axis to extract the máximum details from the infected skin lesión. Figure 6 illustrates the approximation details sepárate the color image as red, green, blue images from which aecurate details can be extracted. Two level approximation was carried out. After extracting details from each color, noise signal is removed from the extracted information by means of Mexican hat wavelet filtering. The number of iterations of the wavelet network was evaluated using a level set function as depicted in Figure 7, which shows the 3D view of the Mexican hat function. The diffusion property of Mexican hat wavelet enables to construct a better segmentation process in DOT images.

Fig. 6 Horizontal, Vertical and Diagonal approximatcs. (Rowl) Approximate Al with horizontal, vertical and diagonal detail enhaneement using the wavelet structure. (Row2) Approximate A2 with horizontal, vertical and diagonal detail enhaneement using the wavelet structure.

Fig. 7 Mexican hat filter function. Image feature detection includes local area detection and feature point detection with 260 iterations.
Image segmentation using wavelet network was compared with segmentation algorithms such as genetic algorithm and graph cut segmentation algorithm. The dataset of 30 images was taken with 58 X 48 dimensions, they were the images reconstructed from the patient data. Diffuse optical tomography images suffer from spatial resolution, which is improved by the spatial correlation filter. The spatial correlation filter removes the background noise in gray level and color images. Graph cut segmentation traces the boundary, regions, shape and optimizes energy. This segmentation has problems when the objects are thin with elongated edges due shrinking. Graph cut segmentation also faces the storage requirement and time consuming problems. Genetic algorithms are used for optimized image segmentation on a large scale. The number of iterations increases compared to wavelet network, therefore time consuming. Image segmentation using genetic algorithm suffers due to varying región threshold. Figure 8 (a), (b), (c) and (d) depicts the Ground truth and the segmented images using Fixed Grid Wavelet Network, segmentation applied with Genetic algorithm and Graph Cut Segmentation.
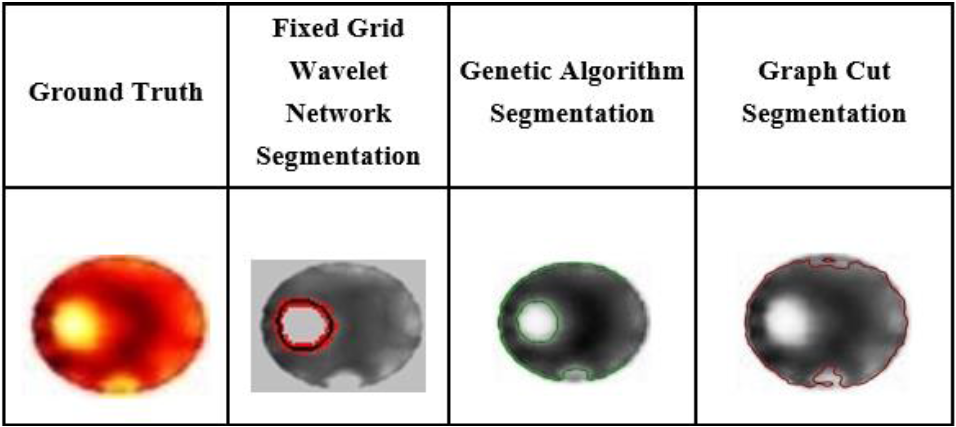
Fig.8. Ground Truth and Segmental Images. (a) Input or ground truth image. (b) FGWN Segmented image. (c) Genetic Algorithm segmented image. (d) Graph-Cut Segmented image.
Image metrics evalúate the image parameters, namely mean square error (MSE), root mean square error (RMSE), peak signal to noise ratio (PSNR), mean absolute error (MAE), Pearson correlation coefficient (PCC) and image quality index (IQI).
Mean square error measures of quality and accuracy of test image related to the original image and MSE are given as
Where x (i, j) represents the original image, y (i, j) represents the test image and MN represents the total number of pixels of the image. To measure the noise in Diffuse Optical Tomography images we had evaluated Root Mean Square Error and Peak Signal to Noise Ratio. DOT image enhancement was also determined by RMSE and PSNR.
RMSE value is low and value of PSNR is high, then the noise reduction approach is better. Mean absolute error is a quanty used to measure the closeness between the predictions and eventual outcomes.
Pearson Correlation coefficient was estimated as
The image quality index has a dynamic range as [-1, 1] has a combination of three factors, namely loss of correlation, luminance distortion and contrast distortion and it was evaluated as
First component has the correlation component of x and y [-1, 1], second component measures cióse luminous [0, 1] between x and y equal to 1 if and only if x = y . σ x and σy estimates the contrast and measures how similar the contrast [0,1].
Where
The total image quality index analyzes the statistical features, quality measurement using a sliding window. Total there are 'M' steps.
The parameters for 6 criteria are evaluated and presented in Table 3. The data samples of 30 images were processed using three image segmentation methods under evaluation. It was identified that proposed algorithm FGWN has a better performance than Graph-cut segmentation (Jaeger et al., 2014) and Genetic Algorithm (Xie and Bovik, 2013) segmentation methods based on evaluation criteria.
Table 3 Performance Evaluation of Image Segmentation algorithms for Brain tissue.
| Image Metrics | Mean Square Error (MSE) | Root Mean Square Error (RMSE) | Peak Signal to Noise Ratio (PSNR) db | Mean Absolute Error (MAE) | Pearson Correlation Coefficient (PCC) | Image Quality Index (IQI) |
|---|---|---|---|---|---|---|
| Graph Cut Segmentation | 73.5000 | 8.5738 | 67.8511 | 11.7058 | 51.0800 | 0.5928 |
| Genetic Algorithm Segmentation | 82.1540 | 9.0639 | 66.7393 | 21.0131 | 56.3025 | 0.5605 |
| Fixed Grid Wavelet Network Segmentation | 80.7361 | 8.9853 | 88.8693 | 14.1468 | 56.7555 | 0.8968 |
FGWN has appropriate level specificity which in turn diagnoses the tumor boundary exactly. Therefore, the tumor boundary at the cellular level is the most significant feature in detecting brain tumor extracted by FGWN with an acceptable accuracy as evaluated in Receiver Operating Characteristics (ROC) Table 4. FGWN is earlier adopted for skin lesions but now due to its feasibility in DOT images it is also agreed. FGWN is simple and provides satisfactory results of this study, which applicable for brain tumor detection by a robot. Based on tumor detection it is categorized as target detection and no target detection as True Positive (TP), False Positive (FP), True Negative (TN) and False Negative (FN). Sensitivity is defined as probability of a positive test result among those having the target condition. Specificity is defined as probability of a negative test result among those without the target condition. ROC characteristic presents Sensitivity versus 1-Specificity.
4. DISCUSSION
We compared our proposed FGWN based brain tumor segmentation with existing Graph-cut segmentation (Jaeger et al., 2014) and Genetic Algorithm segmentation. The segmentation was evaluated with the aid of follow metrics such as sensitivity, specificity and accuracy. The performance analysis has been made by plotting the graph of accuracy as illustrated in Figure 9. The plotted graph was analyzed depicting the performance of the proposed technique has significantly improved the tumor detection with Graph-cut segmentation and Genetic Algorithm.
Table 5 represents the comparison of sensitivity, specificity, accuracy and overall accuracy error in percentage of the FGWN system with existing diffuse optical tomography system (Wang, Liang, & Jiang, 2008). The table proves the system of image segmentation in DOT using FGWN is an excellent method, since it has achieved only 6.2 error percentages. Figure 10 illustrates the comparison of the ROC parameters with existing systems.

Fig. 9 Accuracy plot for three image segmentation methods. Three parameters sensitivity, specificity and accuracy are plotted for GA and FGWN Segmentation.
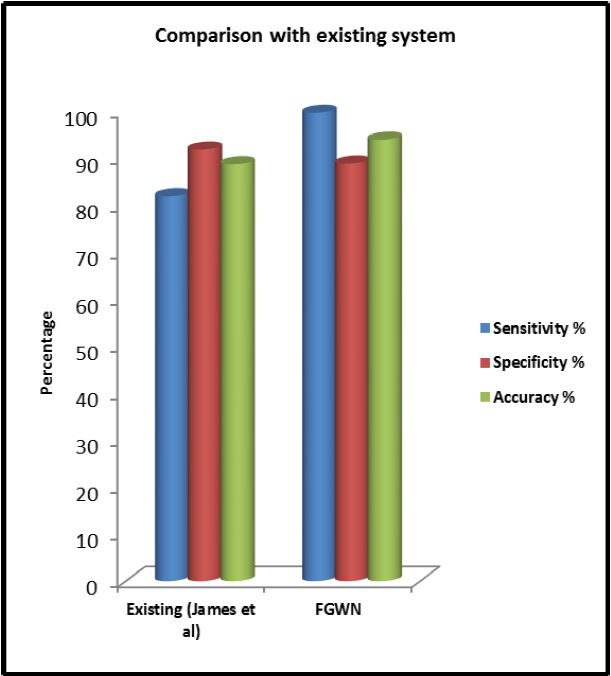
Fig. 10 Comparison of ROC with existing system. FGWN system sensitivity, specificity and accuracy compared with existing system.
Table 5 Comparison of ROC parameters and error percentage with existing system.
| System of DOT | Sensitivity % | Specificity % | Accuracy % | Error%= (1-Accuracy) % |
|---|---|---|---|---|
| Existing (Wang et al., 2008) | 81.8 | 91.7 | 88.6 | 11.4 |
| FGWN | 99.5278 | 88.7354 | 93.8 | 6.2 |
5. CONCLUSION
Automatic image segmentation procedure for detecting brain tumor based on image developed by diffuse optical tomography system was studied. Previously FGWN was implemented for skin cáncer images, to trace the boundary. In this paper, approach of FGWN is proposed to segment the brain tumor images. R, G, B valúes of the brain tumor image were fed as inputs to FGWN and OLS algorithm determines the network weights to optimize the network structure. Mexican hat radial wavelet by its diffusion property works better on DOT image segmentation. The Fixed Grid Wavelet Network Segmentation on comparison with two methods, namely Genetic algorithm and Graph cut Segmentation, based on six criteria over a large data set of 30 images showed better results with an improvement of 5.2 percentage. Good contrast image has a high accuracy level for FGWN when compared to the other two methods. The FGWN segmented image shows that the sensitivity, specificity and overall accuracy by using this automated procedure are 99.527%, 88.73% and 93.8%. These results confirm the prediction of tumor with their size, which is found to be better than the results obtained by visual examination of reconstructed images. The FGWN method has proven to improve performance in detection of brain tumor compared to the existing system.
Summary Table
CONFLICT OF INTEREST
The authors have no conflicts of interest to declare.

