


 text new page (beta)
 English (pdf)
 Article in xml format
 Article references
 Send this article by e-mail
 Cited by SciELO
  Similars in
SciELO
Similars in
SciELO 
 Permalink
1. Introduction
Lightning is one of the main factors causing the insulation failure and line outage and then imposes high costs to power utilities for the maintenance and replacement of damaged equipment. Surge arresters and shield wires are the main protective devices against lightning surges. In the case of shield wire installation, there is still the probability of Back-Flashover (BF) and Shielding Failure Flashover (SFFOR) which can result in insulation failure (Hileman, 1999). Consequently, using arresters is an efficient solution to improve the lightning performance and reliability of power networks.
The back flashover rate (BFR) is considered as one of the main factors in designing the lightning protection of TLs and high voltage (HV) substations. The analytical methods, in the design of lightning protection schemes, have been utilized in many researches (Araújo, Flauzino, Altafim, Batista, & Moraes, 2015; Christodoulou, Ekonomou, Papanikolaou, & Gonos, 2014; Ekonomou, Gonos, & Stathopulos, 2003; Shariatinasab, Safar, & Falaghi, 2014).
The main lightning parameters affecting on the resultant overvoltages are the peak current magnitude, and the front and tail time of the current waveform. Besides, the tower footing grounding impedance is effective on the lightning related overvoltages. The higher tower footing resistance, the severe lightning overvoltage is produced. So, it is important to perform the accurate modeling of grounding system for calculation the lightning performance of TLs. Usually, a simple linear or nonlinear resistance is conventional for modeling of tower footing resistance (Araújo et al., 2015; Banjanin, Savić & Stojković , 2015; Mami ş, Keleş, Arkan, & Kaya, 2016; Shariatinasab et al., 2014; Tossani et al., 2015). In conventional modeling, the magnitude of tower footing resistance is only varied with the lightning current magnitude flowing through the tower footing into the ground. However, the electrical parameters of the soil, i.e. permittivity (ε) and resistivity (ρ) are frequency dependence. This means that not only the current magnitude, but also the frequency range associated with each lightning waveform must be taken into account for accurate estimation of lightning overvoltage.
In Ekonomou et al. (2003) the Wenner method has been used for measurement of the soil resistivity of the ground and the distance between two sequential electrodes was continuously varied in order to record the lack of homogeneity of the ground. The calculation of the parameters of grounding structure is considered as an optimization problem and tower footing resistance is calculated considering soil resistivity and the geometric characteristics of the grounding system. Recently, the effect of frequency dependence modeling of soil resistivity and permittivity on the response of grounding electrodes due to lightning surges has been analyzed (Alipio & Visacro, 2014; Shariatinasab, Gholinezhad, Sheshyekani, & Alemi, 2016)
This paper presents a comprehensive study to accurate modeling of the grounding systems and analyzing the lightning performance of TLs. In this study both the vertical and non-vertical lightning stroke have been considered and the effect of different modeling of grounding system on outage rate of TL is investigated. Also, as transmission lines transfer a large amount of energy, a reliability assessment is vital and can be used as a reference to design the proper lightning protection scheme. Therefore, the effect of wide-band modeling of grounding system on the reliability indices of TLs has been introduced. In order to go through this, a probabilistic evaluation on outage rates and reliability indices of a 400 kV transmission line is introduced by establishing a link between MATLAB environment and EMTP-RV software. The results are analyzed for different grounding system models and various soil resistivity.
2. Lightning overvoltages
2.1. Lightning parameters
From the field data on lightning strokes, the probability of occurrence of each lightning parameter x can be obtained by a log-normal probability density function as below (Chowdhuri et al., 2005):
where σ lnx and x¯ are the standard deviation and average of variable x, respectively. The parameters of log-normal distribution of the lightning negative-polarity are presented in Table 1.
Table 1 Statistical parameters of the lightning negative-polarity strokes (Chowdhuri et al., 2005).
| Parameters | First stroke | Subsequent stroke | ||
|---|---|---|---|---|
| Median | σ lnx | Median | σ lnx | |
| Peak current I p (kA) | 31.1 | 0.48 | 13 | 0.6447 |
| Rise time t f (μs) | 3.83 | 0.55 | 0.32 | 0.6677 |
| Time to half value t h (μs) | 75 | 0.58 | 20 | 0.69 |
| Correlation coefficient ρ c (I p , t f ) | 0.47 | 0 | ||
Having parameters of the lightning surge, a Heidler function can be used to represent the lightning current waveform (Heidler, Cvetic, & Stanic, 1999):
where I p , n and η are the peak current, the current steepness factor and the peak current correction factor, respectively; and k = t/τ 1; τ 1 and τ 2 are time constants that rise and decay time of the lightning are determined based on, respectively.
2.2. Determination of termination point of stroke
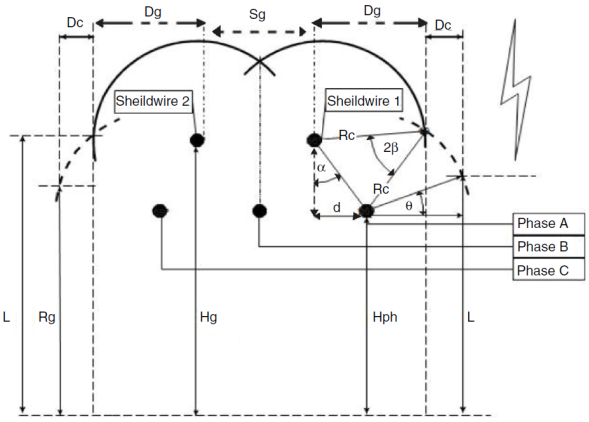
The termination point of the lightning stroke (i.e. the phase conductor, shield wire or ground) is determined with the aid of electro geometric model (EGM), in which is established based on IEEE Std. 1243. The striking distances were calculated by:
where R C and R g are the striking distances to the conductor and the ground, respectively, and I is lightning current amplitude and β = 0.8615. The EGM for the test tower is shown in Fig. 1 (Shafaei, Gholami, & Shariatinasab, 2012).
The number of direct lightning strokes to the TL is related to distribution of coordination of lightning strokes on the so-called struck area and the lightning parameters that are generated by means of Monte Carlo simulation. The convergence of Monte Carlo method is obtained after 30,000 runs.
3. Transmission line modeling
3.1. Transmission tower
Fig. 2(a) and (b) shows a typical 400 kV transmission line and its resultant multistory model consisting of two lines with distributed-parameters. The value of the R and L of each part showing traveling-wave attenuation and distortions are given by (Ametani & Kawamura, 2005):
where c = 300 m/μs is the light velocity in free space, h (m) is tower height, α 1 = α 2 = 0.89 attenuation along the tower and τ = h/c is traveling time along the tower. In this paper, the tower top to the phase arm impedance Z t1 is assumed 200 Ω and the phase arm to the tower bottom impedance Z t2 = is equal to 150 Ω.
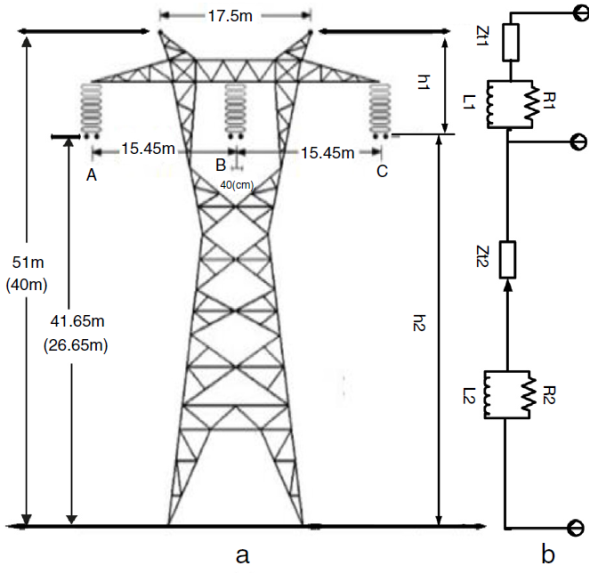
Fig. 2 (a) Tower configuration (values in brackets are midspan heights) and (b) multistory model of transmission tower.
The representation of insulator string is based on the integration method model. This method is shown as (Datsios Mikropoulos, & Tsovilis, 2014):
where V 0 (kV) is the required minimum voltage, DE (kV k μs) is the disruptive effect of the applied impulse voltage, t 0 (μs) is the instant that the instantaneous voltage V(t) exceeds than V 0 and k is a factor accounting for the effect of the applied voltage amplitude and time on DE.
3.2. Tower footing impedance
In the lightning studies, the tower footing impedance usually modeled by a simple linear or non-linear resistance (Datsios et al., 2014; Sarajcev, 2015). However, the frequency dependence of soil electrical parameters is ignored (Visacro, Alipio, Vale, & Pereira, 2011).
In this paper, the frequency dependence of soil electrical parameters is considered based on Longmire and Smith analytical formula (Longmire & Smith, 1975):
where ρ 0 is the low-frequency resistivity, p is the water percentage of soil, f is the frequency rang that varies from DC to 2 MHz and ρ(f) and ε r (f) are the soil resistivity and relative permittivity, respectively.
Variation of relative permittivity and soil resistivity with the frequency is shown in Fig. 3.

In this paper, the grounding system is modeled in three different ways: the wide-band model assuming constant (CP wide-band) and frequency-dependent (FD wide-band) electrical parameters and also a simple resistor (Static model). However, the soil ionization due to the high impulse current injected into the tower-footing grounding system is neglected.
4. Modeling of grounding system
4.1. Types of the grounding system
Lightning is one of the main important overvoltage generated in grounding systems, transformers and other power system components. Studies show that it is possible to model a conductor in soil as a series-parallel equivalent circuit (Fig. 4) (Alipio & Visacro, 2014).

To include the soil ionization, linear resistors in Fig. 4 are replaced by non-linear resistors. In this paper, the analyses are performed for four tower-footing grounding system structures; a one-port vertical and horizontal rod, a four-port simple square grid and a one-port counterpoise grid, as shown in Fig. 5 (Grcev & Popov, 2005).
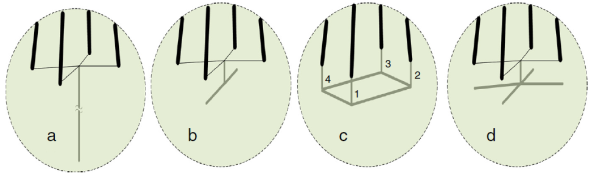
Fig. 5 (a) One-port 12 m vertical rod, (b) one-port 12 m horizontal rod, (c) four-port 6 m × 6 m square grid and (d) one-port 4 m × 4 m, depth 1 m counterpoise grid, used for tower-footing grounding systems.
If the transmission line is excited from one-side, while the far-end is opened, the grounding impedance is as follow:
where Z C and γ are respectively characteristic impedance and propagation constant. The grounding impedance for the vertical rod is given by:
And in the case of horizontal rod,
Soil resistance for the case of vertical and horizontal rod in f = 50 Hz is,
where l (m), a (m), ρ (Ωm) and d (m) are the rod length, geometric radius of the electrode, soil resistivity and the grounding rod depth, respectively.
If conductor radius (a) and grounding rod depth (d) was ignored in comparison with the rod length (L), i.e. (L » a, d); the counterpoise grid resistance is (Scott, 1966):
The counterpoise impedance equations are shown in (Scott, 1966) for different arrangements.
4.2. Frequency dependent behavior of grounding electrodes
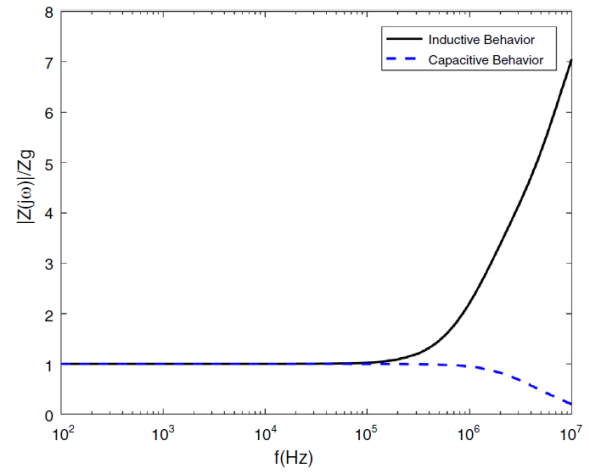
To analysis the frequency dependent behavior of the grounding system, vertical and horizontal copper rods are considered with a 7.5 cm radius, 12 m length and 1 m depth. Also, soil resistivity and relative permittivity are assumed 100 Ωm and 10, respectively. The frequency dependent impedance of horizontal rod Z(jω) is presented in Fig. 6, in which the ratio of Z(jω) to the value of low frequency Z g is shown. It is clear that the impedance is almost constant and frequency-independent in low frequencies (up to 100 kHz). However, the impedance varies for greater frequency range and depending to the ratio of Z(jω)/Z g the behavior of grounding system can be concluded. If Z(jω)/Z g be less, greater or equal to 1, the capacitive, inductive or resistive behavior of grounding system is concluded, respectively.
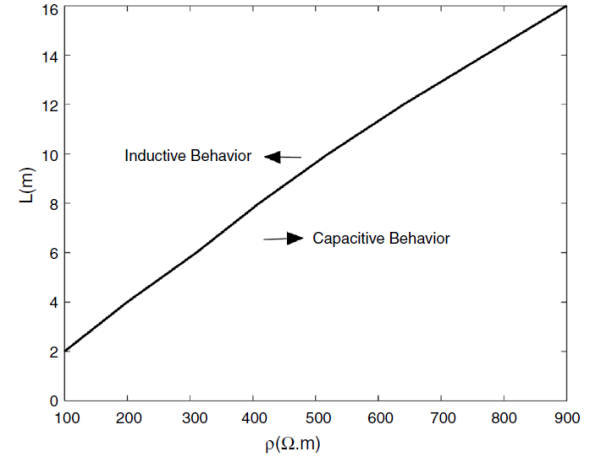
The effect of electrode length and soil resistivity on the inductive and capacitive behavior of grounding system are shown in Fig. 7. Owing the results, one can conclude the capacitive behavior of grounding system is dominant in the case of soil with high resistivity and short length of the electrodes. From Fig. 7, it is obvious that for decreasing the inductive behavior of grounding electrode, shorter electrodes must be used; so that for the electrode of shorter than 2 m length, the grounding system is totally capacitive. However, practically for achieving low resistances in power frequency, longer electrodes are needed.
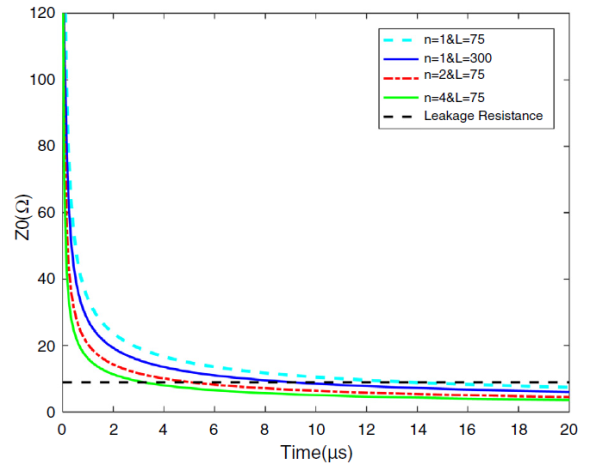
The impedance magnitude of the counterpoise grid is shown in Fig. 8 for one conductor with length of 75 m and 300 m, two conductors with length of 75 m and four conductors with length of 75 m. The results show that the decrement of the impedance magnitude of the counterpoise grid consisting of several short conductors is more than the case of the grid consisting of one but long conductor.
5. Simulation results
The Monte Carlo method has been utilized to analyze the lightning performance of TLs. The approach is performed by establishing a link between MATLAB environment and EMTP-RV software to calculate the lightning flashover rate (LFOR) that is sum of the back flashover (BFR) and shielding failure flashover rate (SFFOR):
where N g (flashes/km2 year) is the ground flash density, N is number of runs, d is the maximum width of impact area; F g and F p are the number of flashovers caused by strokes to shield wire and phase conductor, respectively (See (Shafaei, et al.,) for more details).
5.1. Frequency domain simulation
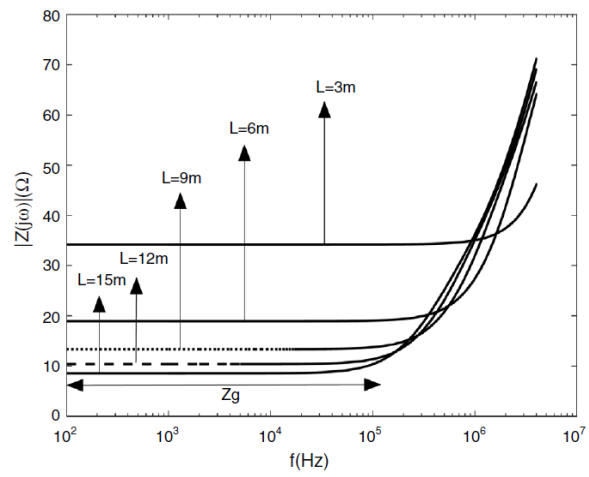
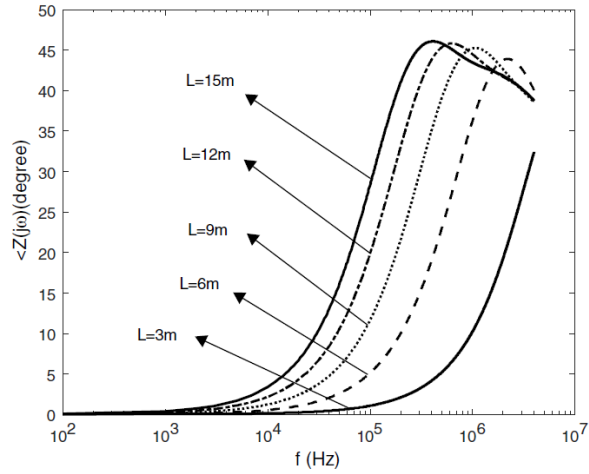
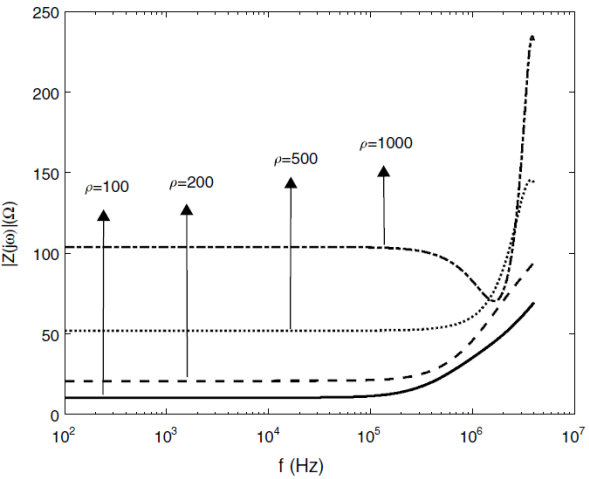
Figs. 9 and 10 present the impedance magnitude and phase for a vertical copper rod with a radius of 7.5 cm, buried in the soil with ρ = 100 Ωm and relative permittivity 10. The tower footing grounding impedance is represented as a function of the frequency for different rod length and soil resistivity. It can be seen that the grounding impedance is constant up to 100 kHz and increases with the frequency increasing because of inductive behavior of the soil. Also the impedance increases with increasing the electrode length.
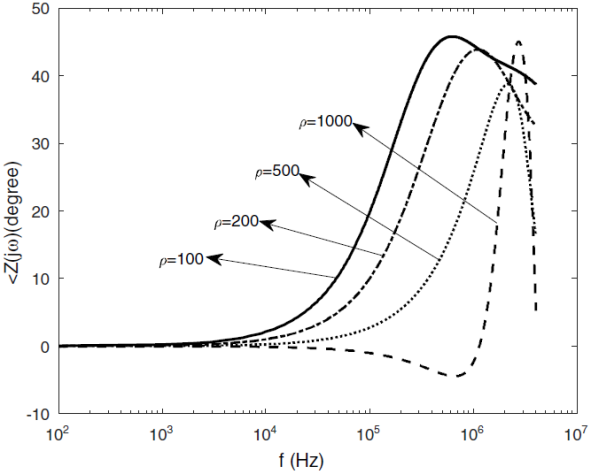
Figs. 11 and 12 show the impedance magnitude and phase for a vertical copper rod that is buried in the soil with different resistivity. The results indicate that the grounding impedance increases with the soil resistivity. Also it is seen that the soil with high resistivity (ρ = 1000 Ωm) has capacitive behavior at first, and shows the inductive behavior in high frequency ranges.
5.2. Time domain simulation
After generating all the statistical variables of lightning related study, every set of variables was applied to the case test to calculate the resultant overvoltages and LFOR. The line configuration of the case test is shown in Table 2.
Table 2 Line conductor characteristic.
| Type | Diameter (cm) | Resistance (Ω/km) | |
|---|---|---|---|
| Phase conductors | CURLEW | 3.163 | 0.05501 |
| Shield wire | 94S | 1.26 | 0.642 |
It should be mentioned that subsequent strokes are simulated only for the flashes where the first stroke did not cause flashover; also the subsequent strokes hit to the same path of the first stroke.
For example, Fig. 13 shows the overvoltages developed across the insulator string in the case of lightning strokes to shield wire. It is clear that the grounding system model is significantly effective on the maximum overvoltages produced across the insulator string. This effect is more pronounced when the soil electrical parameters are considered to be frequency dependent.
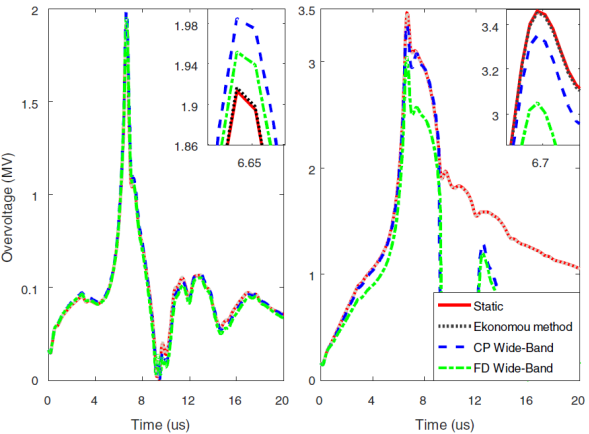
Fig. 13 Overvoltages across insulator string in rod-shape grounding system. Return stroke (100 kA/3.83 μs/75 μs), left column: ρ = 100 Ωm, right column: ρ = 1000 Ωm.
In the case of soil with low resistivity, the difference between the maximum values of generated overvoltages across the insulator string by different modeling of grounding system is about 100 kV, i.e. 5%. For the soil with high resistivity, ρ = 1000 Ωm, the maximum value of the calculated overvoltage belongs to the static model and Ekonomou method (Ekonomou et al., 2003). In this case, the difference between the maximum value of generated overvoltages is 500 kV, i.e. 17%. It is also seen that generated overvoltages due to static model and Ekonomou method are approximately the same.
In order to analyze the influence of the span length of the transmission line on the calculated overvoltages, a sensitivity analysis based on the procedure described in the previous sections was performed, in which the results are shown in Table 3. Owing the results, apart away the modeling type of grounding system, the generated overvoltages across the insulator string decrease with increasing span length for the lightning strokes to the phase conductor and increase for lightning strokes to the shield wires. However, it is seen that there is not a meaningful variation among the overvoltages, either increasing or decreasing, depending on different models of grounding system.
Table 3 The effect of span length on the calculated overvoltages (kV).
| Span Length (m) | Stroke to phase conductor | Stroke to shield wire | ||||
|---|---|---|---|---|---|---|
| ST | CP | FD | ST | CP | FD | |
| 250 | 6554 | 6550 | 6589 | 1833 | 1754 | 1552 |
| 300 | 6535 | 6530 | 6566 | 1842 | 1761 | 1555 |
| 350 | 6515 | 6510 | 6555 | 1850 | 1768 | 1566 |
| 400 | 6495 | 6496 | 6547 | 1855 | 1778 | 1572 |
| 450 | 6478 | 6487 | 6538 | 1865 | 1787 | 1576 |
| 500 | 6470 | 6479 | 6530 | 1867 | 1789 | 1577 |
In general, the lightning strokes are considered vertical, while in fact they hit to the transmission lines non-vertically (See Martinez & Castro-Aranda, 2006 for further information). Therefore, in order to increase the accuracy of the calculation in this study, the lightning strokes assumed to be non-vertical. Tables 4-6 show the outage rates of TL for different models of grounding system. The rod-shape, grid-shape and counterpoise-shape of grounding system are included in this study.
Table 4 Outage rate (flashes/100 km/year) of TL for different modeling of rod-shape grounding system.
| Soil resistivity (Ωm) | Grounding system models | Vertical strokes | Non-vertical strokes | ||||
|---|---|---|---|---|---|---|---|
| BFR | SFFOR | LFOR | BFR | SFFOR | LFOR | ||
| ρ = 100 | ST | 4.377 | 3.007 | 7.38 | 4.203 | 3.830 | 8.03 |
| CP | 4.881 | 3.007 | 7.88 | 4.610 | 3.830 | 8.44 | |
| FD | 4.820 | 3.007 | 7.82 | 4.490 | 3.830 | 8.32 | |
| ρ = 500 | ST | 8.656 | 2.982 | 11.63 | 8.601 | 3.692 | 12.29 |
| CP | 8.818 | 2.982 | 11.80 | 8.792 | 3.692 | 12.48 | |
| FD | 8.379 | 2.982 | 11.36 | 8.276 | 3.692 | 11.96 | |
| ρ = 1000 | ST | 11.429 | 2.945 | 14.37 | 11.400 | 3.680 | 15.08 |
| CP | 10.887 | 2.945 | 13.83 | 10.812 | 3.680 | 14.49 | |
| FD | 10.100 | 2.955 | 13.05 | 10.043 | 3.680 | 13.72 | |
Table 5 Outage rate (flashes/100 km/year) of TL for different modeling of grid-shape grounding system.
| Soil resistivity (Ωm) | Grounding system models | Vertical strokes | Non-vertical strokes | ||||
| BFR | SFFOR | LFOR | BFR | SFFOR | LFOR | ||
| ρ = 100 | ST | 5.828 | 1.979 | 7.80 | 5.732 | 2.946 | 8.67 |
| CP | 6.320 | 1.979 | 8.29 | 6.218 | 2.946 | 9.16 | |
| FD | 6.254 | 1.979 | 8.23 | 6.140 | 2.946 | 9.08 | |
| ρ = 500 | ST | 8.697 | 1.979 | 10.67 | 8.582 | 2.946 | 11.52 |
| CP | 8.793 | 1.979 | 10.77 | 8.692 | 2.946 | 11.63 | |
| FD | 8.546 | 1.979 | 10.52 | 8.454 | 2.946 | 11.40 | |
| ρ = 1000 | ST | 10.48 | 1.979 | 12.45 | 10.37 | 2.946 | 13.31 |
| CP | 10.05 | 1.979 | 12.02 | 9.950 | 2.946 | 12.89 | |
| FD | 9.138 | 1.979 | 11.11 | 9.024 | 2.946 | 11.97 | |
Table 6 Outage rate (flashes/100 km/year) of TL for different modeling of counterpoise-grid grounding system.
| Soil resistivity (Ωm) | Grounding system models | Vertical strokes | Non-vertical strokes | ||||
|---|---|---|---|---|---|---|---|
| BFR | SFFOR | LFOR | BFR | SFFOR | LFOR | ||
| ρ = 100 | ST | 5.883 | 1.979 | 7.86 | 5.771 | 2.944 | 8.71 |
| CP | 5.807 | 1.979 | 7.78 | 5.700 | 2.944 | 8.64 | |
| FD | 5.599 | 1.979 | 7.57 | 5.489 | 2.944 | 8.43 | |
| ρ = 500 | ST | 9.951 | 1.979 | 11.93 | 9.842 | 2.944 | 12.78 |
| CP | 9.094 | 1.979 | 11.07 | 8.980 | 2.944 | 11.92 | |
| FD | 8.141 | 1.979 | 10.12 | 8.036 | 2.944 | 10.98 | |
| ρ = 1000 | ST | 11.835 | 1.979 | 13.81 | 11.728 | 2.944 | 14.67 |
| CP | 10.05 | 1.979 | 12.94 | 10.874 | 2.944 | 13.81 | |
| FD | 9.138 | 1.979 | 10.58 | 8.515 | 2.944 | 11.45 | |
From results it can be seen in rod-shape and grid shape grounding systems, for the soil with low resistivity (ρ = 100 Ωm), the LFOR in the case of wide-band modeling of grounding system is higher than the static model. While, for the soil with high resistivity (ρ = 1000 Ωm), the wide band modeling of grounding system leads to decrement of the LFOR than to the static model. In the case of counterpoise-grid grounding system, the wide-band modeling leads to decrement of the LFOR for all soils. However, the LFOR in the soils with high resistivity is more affected by the modeling type of grounding system. Also, the SFFOR is not dependent to the modeling type of the grounding systems.
Besides, the results show that considering non-vertical lightning strokes, the SFFOR increases and BFR decreases than to the vertical strokes. Furthermore, if lightning strokes was assumed non-vertical, apart from the variation of BFR and SSFOR, the LFOR increases in all cases.
Lightning can also affect on the reliability of the network, in which some reliability indices can be employed to analyze the impact of different tower footing grounding system models in TL reliability. In order to go through this, a typical transmission grid reliability model is established. The typical network contains 12 buses and 12 transmission lines, as shown in Fig. 14. The following indices can be used for n components in series or a series failure event (Billinton & Allan, 1992):
where λ is failure rate; r and U are repair time and unavailability, respectively. It must be mentioned that the effect of busbar and circuit breakers failures on network reliability is ignored.
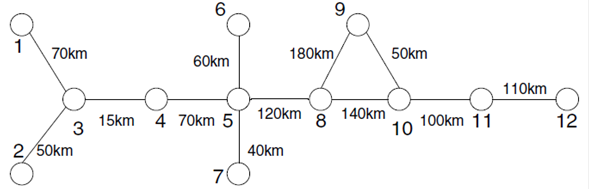
In order to evaluate the mentioned reliability indices, the transmission lines in Fig. 14 are divided into some sections of different length, based on the soil resistivity (see Table 7). The rod-shape grounding system was used in each region. The repair time is considered equal to 0.25 h.
Table 7 Length (km) of subsections of transmission lines based on resistivity of each region.
| Line number | Total length of line (km) | Soil resistivity of each section | ||
|---|---|---|---|---|
| ρ = 100 (Ωm) | ρ = 500 (Ωm) | ρ = 1000 (Ωm) | ||
| 1-3 | 70 km | 40 km | 30 km | 0 |
| 2-3 | 50 km | 30 km | 10 km | 10 km |
| 3-4 | 15 km | 0 | 10 km | 5 km |
| 4-5 | 70 km | 0 | 50 km | 20 km |
| 5-6 | 60 km | 0 | 0 | 60 km |
| 5-7 | 40 km | 0 | 40 km | 0 |
| 5-8 | 120 km | 40 km | 40 km | 40 km |
| 8-9 | 180 km | 80 km | 0 | 100 km |
| 8-10 | 140 km | 0 | 40 km | 100 km |
| 9-10 | 50 km | 30 km | 20 km | 0 |
| 10-11 | 100 km | 0 | 0 | 100 km |
| 11-12 | 110 km | 0 | 60 km | 50 km |
The transmission lines reliability indices in rod-shape grounding system illustrated in Table 8, for different grounding system modeling and various regions.
Table 8 The unavailability and failure rate index of transmission lines.
| Line number | Grounding system modeling | Failure rate (f/year) | Unavailability(h/year) | Line number | Failure rate (f/year) | Unavailability(h/year) | ||||
|---|---|---|---|---|---|---|---|---|---|---|
| Vertical | Non-vertical | Vertical | Non-vertical | Vertical | Non-vertical | Vertical | Non-vertical | |||
| 1-3 | ST | 6.44 | 6.89 | 1.61 | 1.72 | 5-8 | 13.35 | 14.16 | 3.33 | 3.54 |
| CP | 6.69 | 7.12 | 1.67 | 1.78 | 13.40 | 14.16 | 3.35 | 3.54 | ||
| FD | 6.53 | 6.92 | 1.63 | 1.73 | 12.89 | 13.61 | 3.22 | 3.40 | ||
| 2-3 | ST | 4.81 | 5.14 | 1.20 | 1.28 | 8-9 | 20.27 | 21.50 | 5.06 | 5.37 |
| CP | 4.92 | 5.22 | 1.23 | 1.30 | 20.13 | 21.24 | 5.03 | 5.31 | ||
| FD | 4.78 | 5.06 | 1.19 | 1.26 | 19.30 | 20.37 | 4.82 | 5.09 | ||
| 3-4 | ST | 1.88 | 1.98 | 0.47 | 0.49 | 8-10 | 19.02 | 19.99 | 4.75 | 4.99 |
| CP | 1.87 | 1.97 | 0.46 | 0.49 | 18.55 | 19.48 | 4.63 | 4.87 | ||
| FD | 1.78 | 1.88 | 0.44 | 0.47 | 17.59 | 18.51 | 4.39 | 4.62 | ||
| 4-5 | ST | 8.68 | 9.16 | 2.17 | 2.29 | 9-10 | 4.54 | 4.86 | 1.13 | 1.21 |
| CP | 8.66 | 9.13 | 2.16 | 2.28 | 4.72 | 5.02 | 1.18 | 1.25 | ||
| FD | 8.29 | 8.73 | 2.07 | 2.18 | 4.61 | 4.89 | 1.15 | 1.22 | ||
| 5-6 | ST | 8.62 | 9.04 | 2.15 | 2.26 | 10-11 | 14.37 | 15.08 | 3.59 | 3.77 |
| CP | 8.29 | 8.69 | 2.07 | 2.17 | 13.83 | 14.49 | 3.45 | 3.62 | ||
| FD | 7.83 | 8.39 | 1.95 | 2.09 | 13.05 | 13.72 | 3.26 | 3.43 | ||
| 5-7 | ST | 4.65 | 4.91 | 1.16 | 1.22 | 11-12 | 14.16 | 14.91 | 3.53 | 3.72 |
| CP | 4.72 | 4.99 | 1.18 | 1.24 | 13.99 | 14.73 | 3.49 | 3.68 | ||
| FD | 4.54 | 4.79 | 1.13 | 1.19 | 13.34 | 14.05 | 3.33 | 3.51 | ||
Table 9 shows the effect of grounding system modeling upon unavailability index, briefly. It is clear that the wide-band modeling of grounding system has significantly effect on unavailability index when the soil electrical parameters is assumed to be frequency dependent compared to static model. Also it is seen that unavailability index increases by considering non-vertical lightning strokes.
Table 9 The unavailability index of transmission line for different grounding system modeling.
| Grounding system modeling | ST | CP | FD | |
|---|---|---|---|---|
| Total unavailability (h/year) | Vertical strokes | 30.15 | 29.9 | 28.58 |
| Non-vertical strokes | 31.86 | 31.53 | 30.19 | |
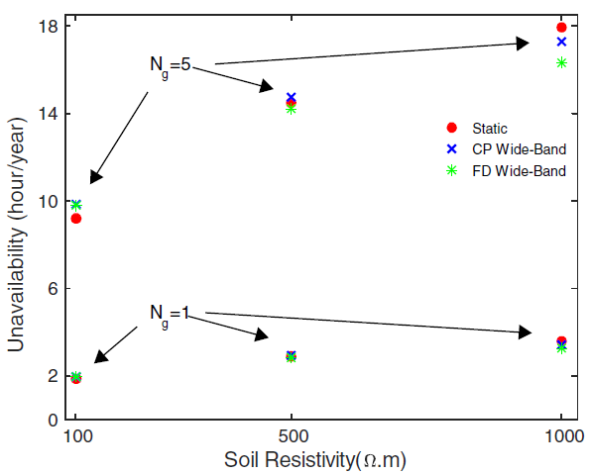
Fig. 15 shows the influence of the ground flash density N g on the TL unavailability index. The analysis was performed for rod-shape grounding system. From Fig. 15 it can be concluded that the unavailability index increases with increasing the soil resistivity and increasing ground flash density. Also, one can conclude that the effect of modeling of grounding system on the unavailability index is more pronounced only for the soil with high resistivity (ρ = 1000 Ωm) and the great N g .
6. Conclusion
A probabilistic evaluation based on Monte Carlo simulation has been carried out for the investigation of the effect of frequency dependent soil resistivity and permittivity on lightning performance of transmission lines. In this method, random lightning parameters and termination point of impact were calculated firstly; thereafter, the lightning overvoltages has been evaluated by EMTP-RV simulation.
The effect of soil electrical parameters and different types of the grounding system on the lightning performance of TLs were analyzed. The results show that the wide-band modeling of grounding system effects on the generated overvoltages (either decrease or increase) across the insulator string.
The results show that the frequency dependence of tower footing impedance leads in decrement of the outage rate and the unavailability index of TLs. The decrement is more in the case of soil with high resistivity and increasing the ground flash density. Also, LFOR and unavailability index of TLs increase considering non-vertical lightning strokes compared to the vertical lightning strokes.
The reliability indices are also calculated for different soil resistivity and grounding system modeling. Owing the results, the accurately modeling of grounding system (wide-band modeling and frequency dependence of soil electrical parameters) should be considered because it strictly affects on the power system reliability indices and, consequently, on the insulation coordination studies. The reliability assessment can be used as a reference to design the proper lightning protection scheme for transmission lines, in which large amount of energy is transferred with them.

