


 nueva página del texto (beta)
 Inglés (pdf)
 Artículo en XML
 Referencias del artículo
 Enviar artículo por email
 Citado por SciELO
  Similares en
SciELO
Similares en
SciELO 
 Permalink
1. Introduction
The recent research based on noble metal nanoparticles (silver, gold, etc.) has become more focussed, due to the uniqueness of the optical, electrical, mechanical, magnetic, size dependent, chemical properties of these nanoparticles. The nanoparticles are very much different from those of the bulk materials (Forough & Fahadi, 2011). Due to these size dependent properties, metal nanoparticles have significant applications in electronics, optoelectronics, magnetic, biomedical and information storage systems (Banerjee, Satapathy, Mukhopahayay, & Das, 2014). A number of approaches are available for the synthesis of metal nanoparticles, such as chemical, electrochemical, photochemical and radiation. The chemical method produces toxic chemicals that may have an adverse effect in medical applications. Hence there is a need for biosynthesis of nanoparticles. The biosynthesis of metal nanoparticles is a widely accepted technology and it is a kind of bottom up approach where the main mechanism behind is reduction. The nanoparticles produced by this method are safe, cost effective and more environmental friendly when compared to the chemical methods (Johnson & Prabu, 2015). Compare to other genial biological processes, the use of agricultural waste like peel extracts for the production of nanoparticles is expedient. The fruit peels are especially easily available, efficient, affordable, eco-friendly, natural and also very rich in bioactive compound. These bioactive compounds can be used as antioxidants and antimicrobial agents, causing most researchers to aim at identifying an efficient way to extract these bioactive compounds from the fruit peels.
Silver nanoparticles (AgNPs) play a profound role in biosynthesis because of their distinctive properties such as good conductivity, chemical stability, catalytic and antibacterial activity (Vadlapudi, Kaladhar, Behara, Naidu, & Sujatha, 2013). Silver nanoparticles have strong inhibitory and bacterial effects, which have been used to prevent and treat various diseases (Veerasamy et al., 2011). Silver nanoparticles have been assorted into more than 200 consumer products, including clothing, medicines and cosmetics due to its medicinal and antimicrobial properties. The papaya, papaw, or pawpaw is the fruit of the plant Carica papaya, the only species in the genus Carica of the plant family Caricaceae. It is native to the tropics of the Americas but has now spread all over the world. The fresh papaya fruit has attractive striking odours, high vitamin content (i.e., vitamin A and C) and high fibre content. The other parts of papaya such as skin, pulp, seeds, stems and leaves also contain high levels of proteins, vitamins and variety of phytochemicals, including natural phenols which are used in the elaboration of cosmetics and medications (Aravind, Bhowmik, Duraivel, & Harish, 2013; Khan, Yadav, Srivastava, & Pal, 2012; Kokila, Ramesh, & Geetha, 2016).
Here, we report facile and cost effective biogenic synthesis of Ag NPs using aqueous extract of carica papaya peel and investigation of the antimicrobial of the synthesized Ag NPs.
2. Materials and methods
The carica papaya fruit is collected from the local market in Coimbatore and the chemical silver nitrate is purchased from Hi-media.
2.1. Preparation of peel extract
The papaya peels are washed thoroughly with distilled water to remove visible dust particles and air dried at room temperature to remove the water molecules.
About 25 g of dried and finely sliced peels are taken and added into 100 ml of distilled water and heated for 30 min. The crude extract is then filtered out using Whatman No. 1 filter paper to get a clear bio extract (Fig. 1). Silver nanoparticles are synthesized from silver nitrate by using aqueous bio extract of carica papaya peels as reducing agent.

2.2. Active constituents and synthesis mechanisms of silver nanoparticles
Papaya peel has various photochemicals especially, phenolic compounds which have antioxidant properties. The two important biologically active compounds in carica papaya are chymopapain and papain, which are extensively used for digestive disorders (Huet et al., 2006). Carica papaya derived papain, caricain, chymopain, and glycerine endopeptidase can improve acidic pH conditions and pepsin degradation. Lipase, or CPL and ahydrolase are the other active compounds of Carica Papaya, which are firmly bonded to the water-insoluble fraction of crude papain. This is considered as a “naturally immobilized” biocatalyst (De María, Sinisterra, Tsai, & Alcántara, 2006; Kokila et al., 2016).
The papaya peel extracts are rich in vitamins, amino acids, carbohydrates, β-carotene, lycopene and polyphenols. Papaya peel extracts acts as an ace source of riboflavin which helps to form the bound co-enzyme namely, Falvin Mono Nucleotide (FMN) and flavin adenine dinucleotide (FAD), which acts as a catalyst for various reduction and oxidation reactions. The other possible mechanisms for the synthesis of silver nanoparticles are nitrate reductases and shuttle quinine process (Durán, Marcato, Alves, De Souza, & Esposito, 2005; Kokila et al., 2016). In this study, the similar mechanism is carried out for the synthesis of silver nanoparticles using the extract of carica papaya.
2.3. Preparation of silver nanoparticles
About 5 ml of filtered bio peel extract is taken and added into 1 mM of pure aqueous silver nitrate solution and stirred for an hour for the reduction of silver nitrate into silver nanoparticles. The reduction process Ag+ to Ag0 nanoparticles is followed by the colour change of the solution from yellow to brownish-yellow to deep brown depending on parameters studied such as the extract concentration. The formation of brown color confirms the syntheses of silver nanoparticles are completed. A similar method is followed for the preparation of silver nanoparticles by using various concentrations of the carica papaya peel extract (Fig. 2).

3. Results and discussion
3.1. Visible observation
Figure 3 (a-e) shows the mixture of synthesized silvernanoparticles using papaya peel extracts of various concentrations (5 ml, 10 ml, 15 ml, 20 ml and 25 ml). The colour of thereaction mixture after 1 h from the initiation of the reaction is different for different concentrations of carica papaya peel extractas evidenced from Figure 3. The colour of the reaction mixturefor the 5 ml concentration of papaya peel extract shows a reddishbrown colour, which increases with increase in the peel extractconcentration from 5 ml to 25 ml.

Fig. 3 Silver nanoparticles using (a) 5 ml, (b) 10 ml, (c) 15 ml, (d) 20 ml, (e) 25 ml of carica papaya peel extract after 1 h of incubation.
The maximum colour intensity (deep brown) is observed forthe 15 ml concentration of papaya peel extract. The intensity ofthe colour is found to decrease (shallow brown) with the increasein the extract concentration from 20 to 25 ml. The deep browncolour of the reaction mixtures indicates the formation of morenumber of silver nanoparticles for the concentrations up to 15 mlof papaya peel extract. Similarly, the shallow brown colour ofthe reaction mixtures indicate the formation of less number ofsilver nanoparticles for the concentrations above 15 ml of papayapeel extract. It is observed that the synthesized silver nanoparticles are aggregated for the higher concentration of papaya peelextract. The aggregation of silver nanoparticles leads to destabilization of silver nanoparticles (Mohapatra, Kaintura, Singh,Kuriakose, & Mohapatra, 2015).
Figure 4 shows the reaction mixture of silver nanoparticlesafter 24 h of incubation from the initiation of reaction at roomtemperature. It is observed that the colour of all the reaction mixtures becomes more intense (deep brown), thereby confirmingthe formation of more number of silver nanoparticles, as thereaction time increases exponentially.

3.2. UV-visible spectral analysis
Figure 5 shows the UV-visible absorption spectra of silver nanoparticles with five different concentrations (5 ml, 10 ml, 15 ml, 20 ml and 25 ml) of the aqueous papaya peel extract at room temperature after 24 h of incubation. The absorption (or) surface plasmon resonance (SPR) band for 5 ml, 10 ml, 15 ml, 20 ml and 25 ml concentrations of papaya peel mediated silver nanoparticles are observed at 410 nm, 420 nm, 435 nm, 422 nm, 418 nm respectively. The SPR peak with maximum and minimum intensity is observed at 435 nm and 418 nm for 15 ml and 25 ml concentration of papaya peel extract respectively (Mohapatra et al., 2015).

Fig. 5 UV-visible spectra of silver nanoparticles using (a) 5 ml, (b) 10 ml, (c) 15 ml, (d) 20 ml, (e) 25 ml of papaya peel extract.
From Figure 5, it is also observed that the absorption peak wavelength of AgNPs shifts to the higher wavelength side as the concentration of the papaya peel extract increases from 5 to 15 ml, corresponding to the red shift. This red shift indicates a gradual increment in the mean diameter of the silver nanoparticles. It is further observed that, as the concentration of papaya peel extract increases to 20 and 25 ml, the absorption wavelength of AgNPs shifts to lower wavelength side corresponding to blue shift. This blue shift indicates a gradual reduction in the mean diameter of the silver nanoparticles.
The optical band gap value for the various concentrations of carica papaya peel extracts are calculated and are listed in Table 1. The optical band gap decreases as the concentration of papaya peel extract increases from 5 to 15 ml, which confirms that the size of the particle increases and thereby the energy band gap decreases. On further increase in the concentration of papaya peel extract to 20 ml and 25 ml, the optical band gap is found to increase thereby confirming the decrease in the size of the silver nanoparticles for these concentrations, which could also be evidenced from XRD analysis (Ghobadi, 2013; Kamat, Meisel, Weller, & Eychmuller, 1996; Schön & Simon, 1995).
3.3. Time dependent UV-visible spectral analysis
The time dependent UV-visible spectra of silver nanoparticles with different concentrations (5 ml, 10 ml, 15 ml, 20 ml, and 25 ml) of papaya peel extract is shown in Figure 6. The UV-visible spectra of silver nanoparticles are recorded after time intervals of 0 min, 15 min, 30 min, 45 min, 60 min and 24 h from the initiation of reaction. It is observed that the incubation period of the reaction mixture shows a gradual increase in absorbance spectrum with surface resonance Plasmon resonance band. It is observed that the absorption peak intensity is lower for 0 min of reaction time, which confirms that less number of silver nanoparticles is formed in the reaction mixture. The absorption peak intensity gradually increases with increase in the reaction time from 0 min to 60 min for all the concentrations of papaya peel extract, which indicates an increase in the concentration of silver nanoparticles in the reaction mixture (Mohapatra et al., 2015). The highest absorption peak intensity is observed after 24 h of incubation from the initiation of the reaction, which indicates the complete formation of silver nanoparticles in all the reaction mixtures.

3.4. FT-IR analysis
The FT-IR transmission spectra of the carica papaya peel extract is shown in Figure 7. The absorption bands around 2924.09 cm−1, 2862.36 cm−1 and 1458.18 cm−1, 979.84 cm−1 may correspond to stretching or bending vibrations of C-H alkenes. The bands around 3726.47 cm−1and 918.12 cm−1 respectively are attributed to stretching and bending vibrations of carboxylic acids. The bands around 1188.15 cm−1 and 1658.78 cm−1 may be assigned to amide I and II N-H bending arising due to carbonyl stretching and peptide link-ages of proteins respectively (Khalil, Ismail, El-Baghdady, & Mohamed, 2014; Venkatesan, Subramanian, Tumala, & Vellaichamy, 2014). From the FT-IR analysis, the presence of carboxyl and amide groups in the carica papaya peel extracts is confirmed. These groups are responsible for the bio-reduction of silver ions into silver nanoparticles.

Figure 8 shows the FT-IR spectra of carica papaya peel mediated silver nanoparticles (AgNPs), for various concentrations (5 ml, 10 ml, 15 ml, 20 ml and 25 ml) of papaya peel extract. The FT-IR spectra show characteristic absorption bands bandsaround 700-750 cm−1, 950-980 cm−1, 1000-1150 cm−1,1200-1300 cm−1, 1330-1370 cm−1, 1500-1550 cm−1,1600-1650 cm−1and 3100-3400 cm−1. The bands around700-750 cm−1may be attributed to stretching vibrations of C-Cl alkyl halides (Khalil et al., 2014). The observed bands around 950-980 cm−1 may arise due to bending vibrations of =C-H group alkenes. The absorption band around 1000-1150 cm−1 may be assigned to C-O stretching vibrations of carboxylic acids. The bands around 1200-1300 cm−1 are associated with N-H bend amines (Sivakumar, Nethradevi, & Renganathan, 2012). The bands around 1330-1370 cm−1 may be due to C-N stretch amine group. The bands around 1500-1550 cm−1 correspond to N-O asymmetric stretch nitro compounds. The bands around 1600-1650 may correspond to stretching vibrations of primary and secondary amines (Khalil et al., 2014; Shanmugavadivu, Kuppusamy, & Ranjithkumar, 2014; Sivakumar et al., 2012). The bands around 3100-3400 cm−1may be due to C=O stretch of carboxylic acids (Khalil et al., 2014).

Fig. 8 FT-IR spectra of silver nanoparticles using (a) 5 ml, (b) 10 ml, (c) 15 ml, (d) 20 ml, (e) 25 ml of papaya peel extract.
The FT-IR spectrum of silver nanoparticles is shown in Figure 8, confirms the presence of carboxyl group and amine group in the reaction mixture by the presence of the appropriate bands. It is observed that on increasing the concentration of papaya peel extracts, the bands are shifted to higher wave-length. It is further observed on comparing Figures 7 and 8, that the bands around 3100-3400 cm−1 and 1600-1650 cm−1, due to carboxylic and amine groups respectively, are shifted to higher wavelengths due to the binding of silver ions when compared with respect to pure carica papaya peel extract and the depth of the band decreases (Khalil et al., 2014; Sivakumar et al., 2012). These carboxyl and amide groups indicate the presence of secondary amines, which is a signature marker of proteins, thus confirming the bio-fabrication of silver nanoparticles, by the action of the proteins or phytochemicals. Therefore, it may be confirmed that, these bio-molecules are responsible for the capping and stabilization of the synthesized nanoparticles. The FT-IR analysis suggests that proteins are involved in the capping and stabilization of the synthesized silver nanoparticles.
3.5. XRD structural analysis
The XRD patterns of bio-synthesized silver nanoparticles of various concentrations of papaya peel extract are shown in Figure 9. The XRD patterns clearly show that, the silver nanoparticles formed by the bio reduction of silver ions by papaya peel broth are crystalline in nature. XRD analysis is used to determine the phase distribution, crystallinity and purity of the synthesized silver nanoparticles.

Fig. 9 XRD spectra of silver nanoparticles using (a) 5 ml, (b) 25 ml, (c) 20 ml, (d) 10 ml, (e) 15 ml of papaya peel extract.
The XRD patterns of silver nanoparticles show five distinct peaks in the spectrum of 2θ value ranging from 30◦ to 80◦. The peaks are indexed with reference to the standard JCPDS card no. 04-783 for silver and are found to be (111), (200), (222), (220) and (311), corresponding to the cubic face of silver nanoparticles (Saravanakumar, Ganesh, Jayaprakash, & Jang, 2015). The peaks observed around 27◦ and 32◦ may due to the peel extract. These Braggs peak might have resulted due to capping agent, stabilizing the nanoparticles (Ibrahim, 2015; Roopan et al., 2013). The crystallite sizes of the silver nanoparticles using various concentrations of papaya peel extract are calculated using the Debye-Scherrer’s equation (Gnanajobitha, Rajeshkumar, Kannan, & Annadurai, 2013).
The average crystallite size of silver nanoparticles synthesized using 5 ml, 10 ml, 15 ml, 20 ml and 25 ml of papaya peel extract are found to be 16.1 nm, 16.3 nm, 17.9 nm, 17.8 nm, 17.7 nm respectively. It is observed that the average crystallite size of the particles increases with increase in the concentration of papaya peel extract from 5 ml to 15 ml and with further increase in the concentration to 20 ml and 25 ml, the crystallite size of the particles decreases gradually. The decrease in crystallite size of the particle could also be confirmed from the UV-visible spectral analysis. It is further observed that the crystallite size obtained from the synthesized silver nanoparticles is much smaller than that reported by Kokila et al. in their article as 28 nm and this reduction in crystallite size enhance the properties of silver nanoparticles.
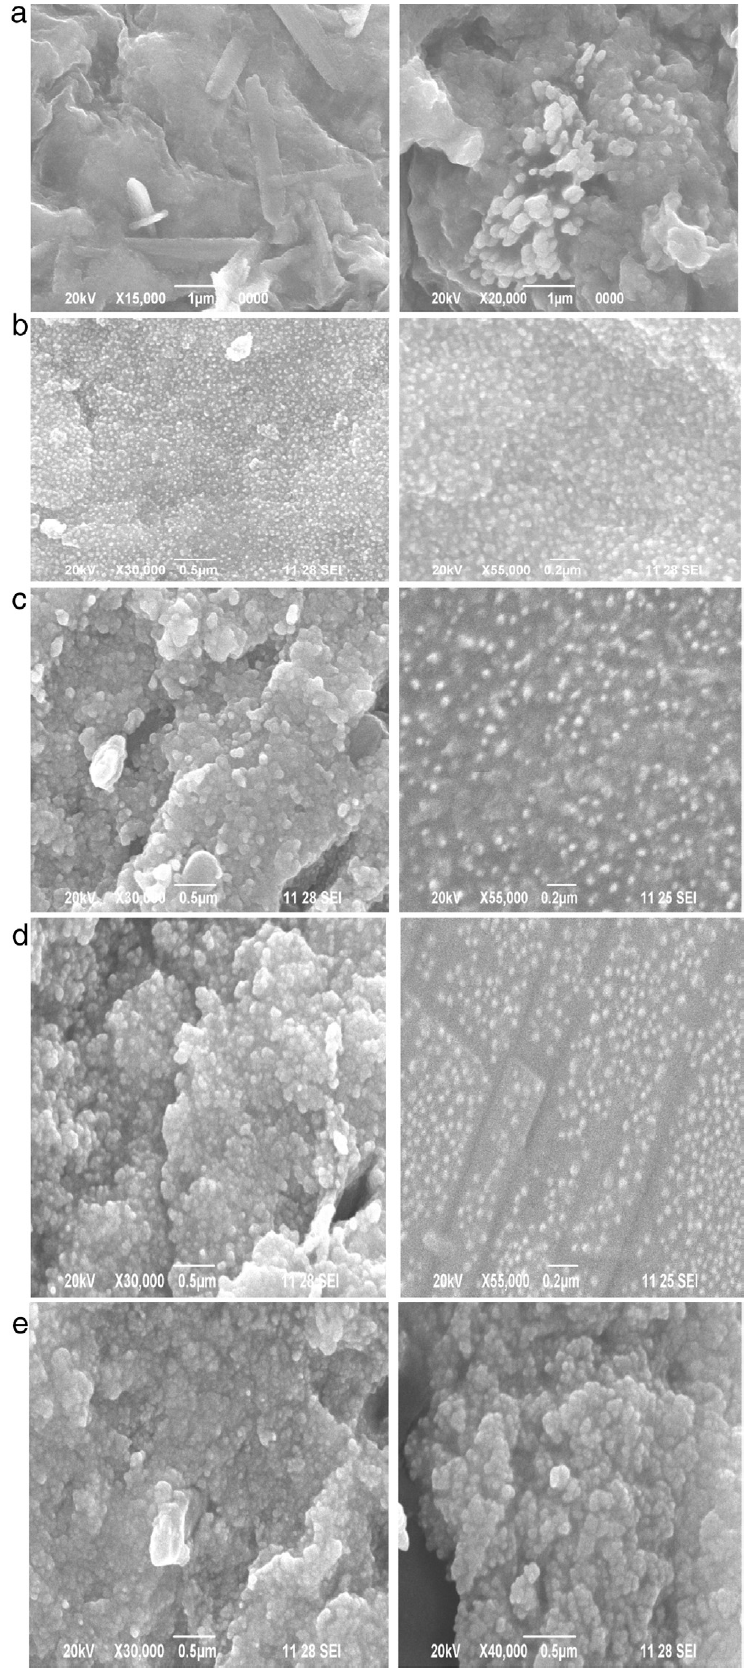
3.6. SEM analysis
Scanning electron microscopy (SEM) analysis is performed for studying the surface morphology and shapes of silver nanoparticles. Figure 10 (a-e) shows the SEM images of various magnifications of silver nanoparticles synthesized using 5 ml, 10 ml, 15 ml, 20 ml and 25 ml concentrations of carica papaya peel broth respectively. It is observed that the silver nanoparticles are spherical in shape and the concentration of the extract alters the size and shape of nanoparticles. The particles are uniformly distributed and no aggregations are observed for 5-15 ml of peel extract. But the particles get agglomerated as the concentration of papaya extract increases above 15 ml as can be evidenced from Figure 10 (d-e). The agglomeration of particle leads to destabilization of silver nanoparticles (Narmadha, Hemashenbagam, Sathiya Vimal, & VasanthaRaj, 2013).
3.7. TEM analysis
The TEM images of silver nanoparticles synthesized using aqueous extract of carica papaya peel are shown in Figure 11. The concentration of the extract alters the shape and size of silver nanoparticles in the solution. These images suggest that the morphology of the nanoparticles is mostly spherical in shape. A few agglomerated nanoparticles are also observed in some places, thereby indicating possible sedimentation at a later time. The average particle size of silver nanoparticles is found to be from 15 nm to 20 nm. The results are in good agreement with the crystallite size obtained from XRD analysis.

3.8. Saed analysis
Figure 12 shows the selected area electron diffraction pattern (SAED) of the silver nanoparticles synthesized using carica papaya peel extract as reducing agent. The ring patterns indicate that the particles are crystalline in nature. Each ring corresponds to the different lattice planes obtained from the XRD analysis.

3.9. Antibacterial activity
Antibacterial property of silver nanoparticles synthesized using five different concentrations of papaya peel extract against two different human pathogens Escherichia coli (gram negative) and Staphylococcus aureus (gram positive) are shown in Figure 13. The labels S, D, P, 50 and 100 represent the inhibition zones for standard antibiotic, distilled water, pure carica papaya peel extract, 50 ml AgNPs and 100 ml AgNPs respectively. It is observed that, the antimicrobial activity of silver nanoparticles with different papaya peel extracts is found to be significant against both the bacterial strains, while the plant extract and distilled water does not show any such activity.

Fig. 13 Antibacterial activities of silver nanoparticles against (a) Escherichia coli (b) Staphylococcus aureus.
The inhibition zones for the silver nanoparticles with different concentrations of papaya peel extract are listed in Table 2. Ampicillin is used as a standard antibiotic to compare the results with the zone obtained using silver nanoparticles. The zone obtained using 100 ml of silver nanoparticles is greater than the zone formed using 50 ml of silver nanoparticles. It is observed from Figure 13 that, increase in the concentration of silver nanoparticles will result in the formation of a well defined inhibition zone. It is evident from Table 2 that the inhibition zones for both the bacterial strains depend on the concentration of papaya peel extract. A gradual increment in the diameter of the inhibition zone is observed for silver nanoparticles prepared using 5 ml, 10 ml and 15 ml concentrations of papaya extract. This may be due to the increase in the concentration of silver nanoparticles in the reaction mixture. Further, increase in the concentrations of the peel extracts to 20 ml and 25 ml, the diameter of the inhibition zone obtained for E. coli and S. aureus strains get decreased. The decrease in the diameter of the inhibition zone for high concentration peel extract silver nanoparticles may be due to the presence of low concentration of silver nanoparticles in the reaction mixture. It is confirmed that the antimicrobial activity of silver nanoparticles strongly depends on the concentration of the silver nanoparticles present in the reaction mixture. The anti microbial activity for gram negative bacteria is greater than that for gram positive bacteria for all the concentrations of peel extracts (Banala, Nagati, & Karnati, 2015; Ibrahim, 2015; Saravanakumar et al., 2017). It is further evident that the best results have been achieved in our study, that the zone of inhibition has been found to be 0.75 cm (75 mm) for E. coli and 0.65 cm (65 mm) for S. aureus for 100 ml is very much higher than that reported by Kokila et al. as 15 mm for E. coli and 10 mm for S. aureus in their study.
Table 2 Zone of inhibition of silver nanoparticles using different concentrations of papaya peel extract.
| Name of human pathogens | Standard (ampicillin) (30 ml) | Zone of inhibition of AgNPs with different concentration of extract | |||||||||
|---|---|---|---|---|---|---|---|---|---|---|---|
| 5 ml | 10 ml | 15 ml | 20 ml | 25 m1 | |||||||
| 50 μl | 100 μl | 50 μl | 100 μl | 50 μl | 100 μl | 50 μl | 100 μl | 50 μl | 100 μ1 | ||
| E. coli | 14 | 0.4 | 0.45 | 0.5 | 0.55 | 0.65 | 0.75 | 0.55 | 0.65 | 0.45 | 0.5 |
| S.aureus | 15 | 0.3 | 0.45 | 0.5 | 0.55 | 0.55 | 0.65 | 0.5 | 0.55 | 0.45 | 0.5 |
4. Conclusion
The present study describes the green synthesis of silver nanoparticles using various concentrations (5 ml, 10 ml, 15 ml, 20 ml and 25 ml) of carica papaya peel extract as the reducing agent. These nanoparticles are environmental friendly and completely safe. The UV visible spectra of silver nanoparticles show absorption peaks around 400-435 nm for the different concentrations of the papaya peel extract. It is observed that on increasing the concentration of the peel extract from 5 ml to 15 ml, the absorption peaks are being red shifted and the optical band gap is found to decrease, which implies that there is an increase in the particle size. It is further observed that, with increase in concentration of peel the extract to 20 ml and 25 ml, the absorption peaks are being blue shifted and the optical band gap is increased, which implies that there will be a decrease in the particle size. These variations in particle size could also be confirmed from XRD analysis. The FT-IR spectra confirm the presence of carboxyl group and amine group in the reaction mixture by showing the appropriate bands, which are responsible for the reduction of silver ions into silver nanoparticles. It is also observed that with increase in concentration of the papaya peel extract from 5 ml to 25 ml, the FT-IR absorption bands are shifted to higher wavelengths because of more interaction of silver ions with reducing agents. XRD spectra reveal that the silver nanoparticles are crystalline in nature and the average crystallite sizes are found to be from 16 nm to 18 nm which is in good agreement with TEM analysis. SEM micrographs show the spherical shape of the nanoparticles and also the agglomeration for concentrations of extract above 15 ml. The antibacterial activity of silver nanoparticles was tested against two bacterial strains, E. coli and S. aureus. The zone of inhibition is found to be greater for gram negative bacteria than gram positive bacteria. The maximum zone of inhibition is obtained for the 15 ml concentration of peel extract. This may due to the presence of more number of silver nanoparticles in the reaction mixture which could also be evidenced from UV-vis analysis. It may be concluded from the different characteristic analyses that the nanoparticles synthesized using 15 ml concentration of extract are more effective compared to the other concentrations of papaya peel extract.

