


 nova página do texto(beta)
 Inglês (pdf)
 Artigo em XML
 Referências do artigo
 Enviar este artigo por email
 Citado por SciELO
  Similares em
SciELO
Similares em
SciELO 
 Permalink
1. Introduction
The DSTATCOM can be used in a distribution system with the prime objective of compensating the reactive power demand of the load thus, relieving the source the reactive power loading. This may lead to better voltage regulation of the source and the utility of the source can also be raised to its full capacity, as the power factor on the source side is raised to unity. DSTATCOM can also be used for balancing the currents drawn from the source in the face of the load currents being unbalanced because of the unbalanced load. DSTATCOM can also be used for mitigating harmonics in the source current, even if the load is of non linear in nature. In such applications, the harmonic currents drawn by the load will be met by the DSATCOM. A close consideration of the literature related to the developments happening around the DTATCOM reveals that there have been four different directions of research going on. They are:
a. The developments pertaining to the topological changes of the DSTATCOM converter including the Multilevel Converters.
b. The various Pulse Width Modulation techniques like the Sinusoidal PWM, the Space Vector PWM and the Selective Harmonic Elimination (SHE).
c. There are many developments in the underlying principles of electrical engineering like the theories based on Clarks, Parks transformation, instantaneous real and reactive power theory etc.
d. The fourth direction of the research concentrates on the developments of novel techniques of control systems for the management of the DSTATCOM employing in ultra modern technologies like the Advanced Reduced Instruction Set Microprocessor (ARM), Digital Signal Processor (DSP) and the VLSI (Very Large Scale Integration) technologies.
Since the outbreak of the technological developments that happen with the advent of both power electronics or power semiconductors and the nearly simultaneous developments around digital or discrete signal processing and control systems, there have been vast developments in the field of DSTATCOM-based power compensation including the active power filters.
Power quality issues in power systems are analyzed by Ewald and Mohammad (2008). The use of FACTS devices to address the power quality issues in transmission and distribution has been presented by Padiyar (2008). A detailed review on power electronic solutions to power quality problems has been explained by Sannino, Svensson, and Larsson (2003). The impact of harmonics on power quality issues and its acceptable limit are presented in IEEE Std 519 (1992). In a study, the authors proposed the analysis, simulation and control of DSTATCOM in isolated distributed three-phase four-wire systems (Singh, Adya, Mittal, & Gupta, 2006). In order to improve the performance, a study used the parallel connected hybrid power filters, operated at different switching frequencies (Bhattacharya, Chakraborty, & Bhattacharya, 2012). In Montero, Cadaval, and Gonzalez (2007), different control strategies, followed for the control of shunt active filters, are compared; A non-iterative optimized algorithm, for shunt active power filter under distorted and unbalanced supply voltages, was proposed by Kanjiya, Khadkikar, and Zeineldin (2013). An advanced current control strategy for three-phase shunt active power filters was proposed by Trinh and Lee (2013). A robust adaptive control strategy of active power filters for various harmonic compensation, power-factor correction and balancing of nonlinear loads has been proposed by De Araujo Ribeiro, de Azevedo, and de Sousa (2012). In Singh and Singh (2012), Longhui, Fang, Pengbo, Hongyu, and Zhaoan (2007), they simulated a DSTATCOM for voltage fluctuation. The design considerations for DSP controlled 400 Hz shunt active power filter were proposed in a study by Hu, Shi, Lu, and Xing (2012). Theoretical investigation of original and modified instantaneous PQ theory has been done by Depenbrock, Staudt, and Wrede (2003). PQ transformation to improve the performance of synchronous reference frame controllers in shunt active power filters was analyzed by Pigazo, Moreno, and Estebanez (2009). Operation of a DSTATCOM in voltage control mode has been presented in various studies by Mishra, Ghosh, and Joshi (2003). A self-tuning PI Controller for a DSTATCOM using particle swarm optimization (PSO) has been proposed by Liu and Hsu (2010). Fuzzy logic-based control of DC link voltage in a DSTATCOM was proposed by Suryanarayana and Mishra (2008).
This research focuses on the development of a robust control scheme for the DSTATCOM with just the traditional PI controller but with a better tuning technique. The research has been carried out in an application of DSTATCOM in a balanced and linear but reactive load environment. Therefore, the objective of the DSTATCOM under consideration is just to inject where the appropriate magnitude of the reactive current requires load with the help of the two PI controllers.
One of the two controllers takes care of the DC link voltage. The other controller takes care of the AC three-phase voltages at the point of common coupling. The controller that takes care of the DC link voltage can be of the PI type with fairly lower band width.
As the other controller maintains the voltage at the point of common coupling, the methodology is to inject the appropriate reactive current into the AC system such that the exact quantity of reactive power demand of the load is met with at a fixed AC voltage. The reactive power flow into the load from the mains has an influence on the bus bar voltage. The changes that occur at the 'd' component of the orthogonally displaced 'd' and 'q' components of the park transformed three-phase line voltage system is a function of the reactive power drawn by the connected load.
The paper has been arranged as follows. Next to this brief Introduction section, a review of the essentials of the DSTATCOM is given in Section 2. The principles of particle swarm optimization are presented in Section 3. The tuning of the PI controller is discussed in Section 4. A detailed study of the performance of the PI controller in the light of frequency-based analysis is depicted in the Section 5. Results of the simulation in the MATLAB SIMULINK environment are presented in Section 6. An experimental verification has been carried out and the results are discussed in Sections 7-9 followed by the conclusion in Section 10.
2. Structure modeling and control strategies of the DSTATCOM
Structurally the DSTATCOM, whether for grid-based applications or for applications in the distribution systems, assumes the three-phase three legs Graetz bridge arrangement consisting of six power electronic switches arranged in the three leg converter as shown in Figure 1.
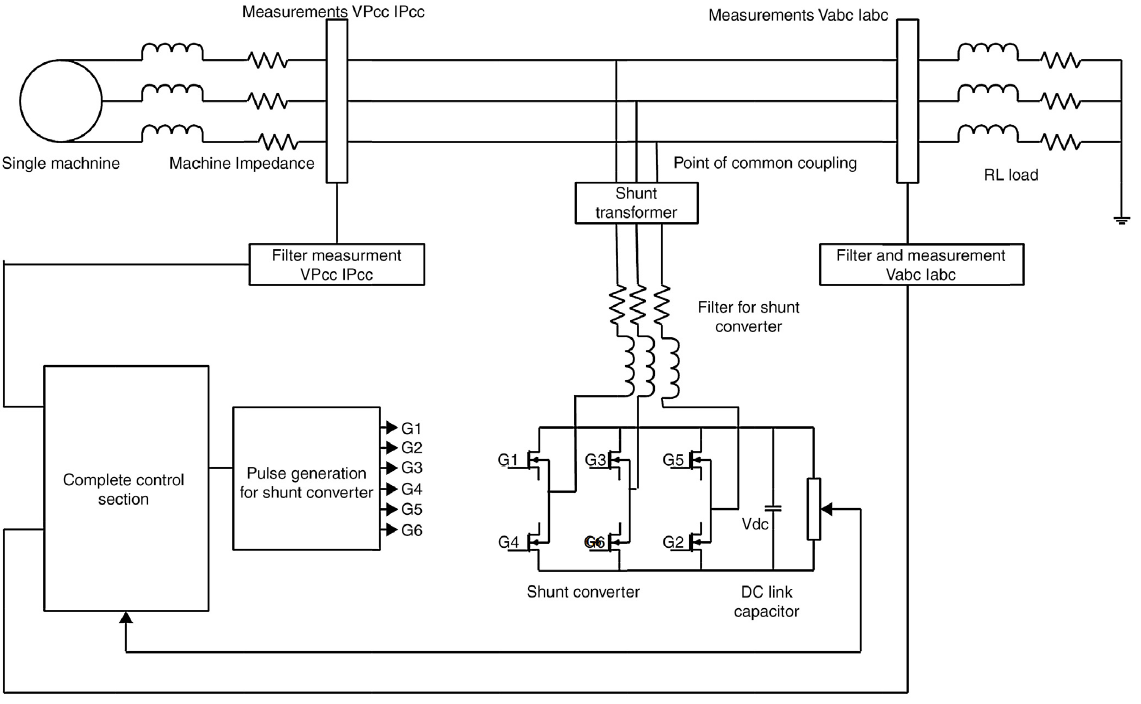
The switches may be of the power MOSFET type or the IGBT type. For low-frequency switching but for high power applications, IGBT is preferred. For low to medium power, if the design uses high switching frequency, then MOSFET switches will be the choice.
The DSTATCOM-based reactive power compensator has three fundamental elements and they are the DSTATCOM converter, the DC link capacitor and the reactor type filter. There are two sides in DSTATCOM. The two terminal DC side is connected to the DC link capacitor and the three-phase AC side of the converter is connected to the point of common coupling through a set of three reactors as shown in Figure 1.
2.1. Real power transaction
Though the DSTATCOM is meant for reactive power compensation, it needs a steady DC voltage across the DC link capacitor. Because of the leakage of the capacitor, the DC link voltage may tend to fall. This has to be toped up continuously by drawing real power from the AC mains source. Besides, the losses occurring in the semiconductor switches and the losses occurring in the series reactor are to be met. As a result of these losses, a certain real power is to be drawn from the AC mains. Therefore, the DSTATCOM should be capable of drawing real power from the mains, while it has to supply reactive power. It is to be noted that both real and reactive powers can cross across the DSTATCOM in opposite or in the same direction and this features the controllability of real and reactive powers simultaneously.
There are actually two degrees of freedom associated with the DSTATCOM and these two are the modulation index and the phase angle of the reference signal which are used for PWM in the switching of the power semiconductors of the DSTATCOM.
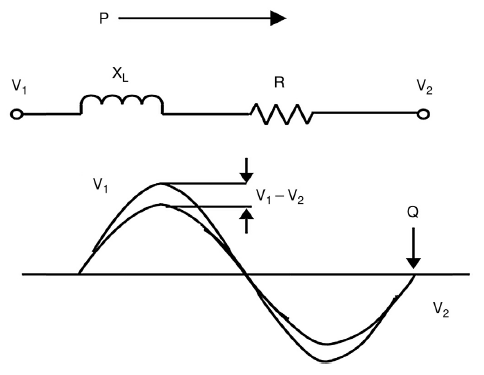
The modulation index control is used for the reactive power control and the phase angle control is used for the real power control. The currents associated with the DSTATCOM obey Kirchhoff's current law and vectors and the waveforms associated with the DSTATCOM are shown in Figures 2 and 3.
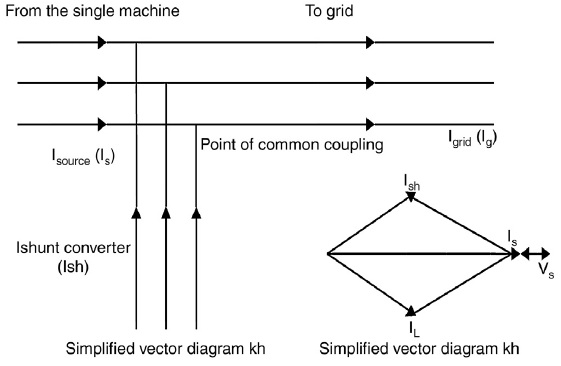
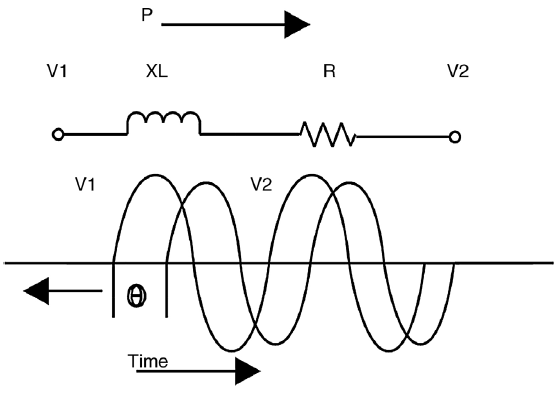
Fig. 3 The real power transaction happening over a reactor is a function of the potential difference and the phase angle difference existing between the ends of the reactor.
The real power transaction happening over a reactor is a function of the potential difference and the phase angle difference existing between the ends of the reactor. Also, the relationship between the voltages, phase angles and the reactance of the reactor are given in Eq. (1).
The real power transferred from V 1 to V 2 is
where X is the reactance of the reactor between V 1 and V 2.
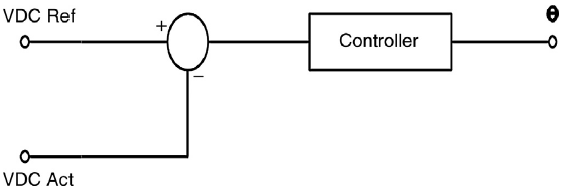
In order to draw the required quantity of real power from the AC mains, the phase angle of the terminal voltage of the convertor should lag behind the phase angle of the voltage prevailing at the point of common coupling (PCC). Now, this angle of lag can be introduced in the terminal voltage of the DSTATCOM converter by providing the required lag of the reference signal used. The angle of lag is derived from a controller typically of PI type or an FLC or whatever it could be and wherever the input to the controller used is the error between the set point DC link voltage and the actual DC link voltage. The general structure of the controller that produces the angle θ of lag or lead, is shown in Figure 4.
2.2. Reactive power compensation
In reactive power compensation techniques, the reactive component of current drawn from the load is supplied to the load from the DSTATCOM. This relieves the main source from being loaded with reactive component of current. The actual quantity of reactive component of current to be injected is carried out indirectly by considering the 'd' component of the 'dq' transformed V abc at the point of common coupling using the Park's transformation.
With a purely resistive load d component of the voltage at the point of common coupling will be practically very close to the unit. With the inclusion of reactive power load, this quantity falls down and the DSTATCOM will inject reactive current into the load through the bus. This action takes the d component of the voltage at the point of common coupling back to near unity condition.
The phasor diagram shown in Figure 5 shows the mechanism of reactive power flow by maintaining the appropriate voltages at the point of common coupling and at the terminals of the converter.
The reactive power transferred from V 1 to V 2 is
where X is the reactance of the reactor between V 1 and V 2.
According to Eq. (2), the reactive power transaction is a function of the voltage difference between the terminals of the DSTATCOM converter and the point of common coupling.
The equation reveals that even though there is phase difference between the nodes V 1 and V 2, the reactive power transaction can happen with difference in the magnitude of the voltage levels at V 1 and V 2.
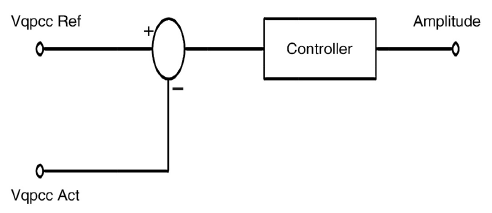
In the PWM driven DSTATCOM, the difference in the voltages prevailing across the reactor can be achieved by adjusting the modulation index of the reference signal used in PWM. The general control structure of the reactive power compensation is shown in Figure 6. Thus, using the two control systems, the two degrees of freedom are manipulated and this leads to real and reactive power transaction in required manner.
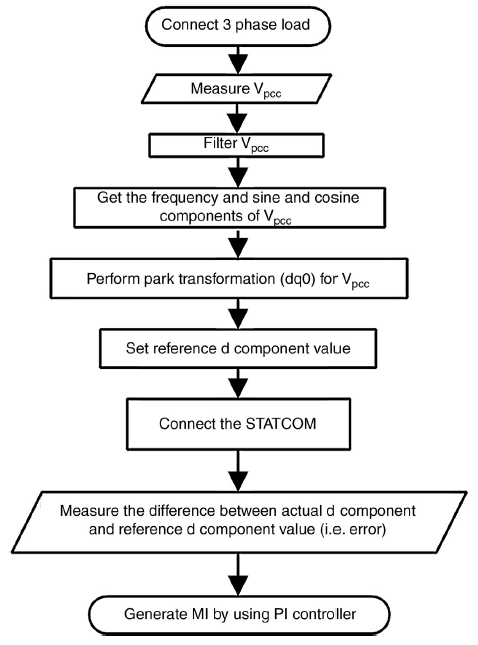
The various steps involved in the reactive and real power compensation are set out in the following steps.
Reactive power compensation:
1. For the purpose of testing, to start with, a three-phase resistive load is connected on the load side. The STATCOM is not connected now.
2. Measure the three-phase voltage at the PCC.
3. After the low-pass filter, the three-phase voltage waveform obtained.
4. Get the frequency and sine and cosine components of the three phase voltage prevailing at the PCC.
5. Perform Park transformation and separate d, q and 0 components.
6. The d component value, with resistive load on the load side will be the set point for reactive power compensation.
7. With the STATCOM connected, the actual RL load, the actual d component and the set point of the d component of the voltage at the point of common coupling are used to find the error.
8. This error is used in the first PI controller to generate the modulation index to be used in the reference sine wave generation.
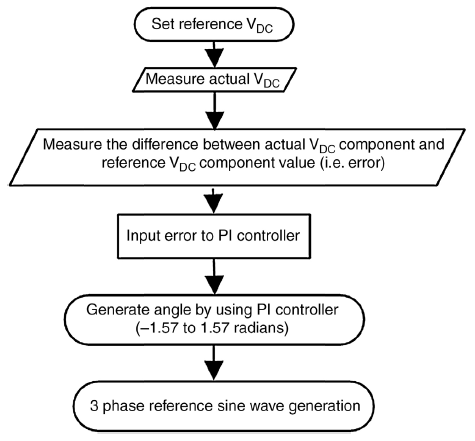
Real Power Compensation:
The real power can flow through the STATCOM in either direction from the DC link capacitor to the point of common coupling or from the point of common coupling toward the DC link capacitor. Depending upon the direction of the flow of real power, the voltage across the DC link capacitor may either rise or fall. It is necessary that the DC link capacitor is to be maintained at a constant DC level so that, the reactive power compensation is carried out satisfactorily.
During the operation, it is possible that the capacitor looses charge caused by the internal losses in the capacitor resulting in reduction of the DC link voltage across the capacitor.
The second PI controller that is responsible for maintaining DC link voltage works as per the following steps.
2.3. Park transformation
The voltage at the point of common coupling is a three-phase balanced voltage system displaced by 120° between the phases. The three-phase voltages are time varying according to the sine law. Direct decoupled control of reactive and real power is not possible by simple voltage control. A decoupled control system is needed. The Park transformation has two advantages. The first one is the time varying three-phase voltage system, V abc is transformed into a non time varying d and q components such that the controllers of low bandwidth can be used. The second advantage is that a decoupled control scheme can be achieved so that, independent real and reactive power flow can be carried out without disturbing each other.
Eqs. (3) and (4) give the transformation matrices for Park transformation and reverse Park transformation, respectively. In this research, a Park transformation is carried out for the three-phase voltage V abc at the point of common coupling and the 'd' and 'q' quantities are separated. The 'd' quantity is used for reactive power control. However, the 'q' quantity is not used.
After deriving the controller outputs, the modulation index and the phase angle 'θ' from the two controllers a reference signal is restructured using the fundamental equation of sine wave
where ω = 2*π*f and f is derived from a phase locked loop (PLL) unit.
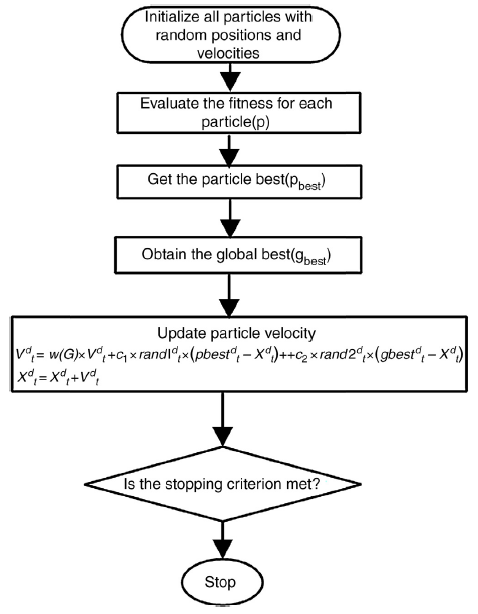
3. Particle swarm optimization
Particle swarm optimization is a heuristic search or optimization technique inspired by the co operative behavior of flocks of birds or schools of fish. With an extremely intricate system of communication, the birds or fish hereafter termed as particles interact with each other. In addition to the communication skills, the particles are characterized by a sort of updating the best of the past performances in the current flight.
In the PSO model used in industrial optimization, each particle is associated with a set of parameters. The set of parameters associated with each particle is a vector. This vector is of equal number of elements for all the particles and the size of this vector is equal to the size of the vector to be optimized in the application. To start with, the elements of the vectors of each particle are assigned with arbitrary values within the allowable range. With the arbitrary values for the vector elements, the performance of each of the vectors is calculated. The PSO technique is a heuristic search technique which is used to locate a particular point in a multi dimensional space, where this point is ultimately pointed out by all the particles which satisfy the objective to be reached.
In a typical PSO set up, a fixed number particle is involved. Each particle is associated with a vector of fixed number of elements. To start with, these elements are randomly initialized and the whole system of particles enters into an iterative process. At the end of each iteration, the performance of each particle is calculated in terms of the closeness to the objective function by substituting the values of the elements of the vector in the objective function. At the end of every iteration, it may so happen that one among of the particles comes out with the best results. That particle is referred as the globally best particle of the iteration. In the next iteration, another particle may become the globally best particle.
Besides, each particle over a number of iterations may exhibit different performances in each iteration and by considering the past and the present iteration, the certain combination of the elements of the vector for a particular iteration might stand the best performing vector pertaining to that particular particle. This particular vector is the personal best of the said particle. All the particles are updated with the best vector that gives the best results.
Thus, after the updating the process that happens at the end of every iteration, all the particles will assume their best vectors so far, respectively their personal best and one among them will be the globally best particle.
Based on the vector of the personal best of each particle and based on the vector of the globally best performing particle, a velocity is estimated and this velocity is added up respectively with the updated best performing vector of each particle. Thus, at the end of each iteration, the vectors of all the particles are updated and the performance evaluated with Eqs. (5) and (6).
As the iterative process is under process, the elements of the vector of each particle are modified little by little and they all move toward the common goal from different directions to ultimately meet at the unique point. At this unique, the elements of the vectors of all the particles will be the same and all the particles show up almost the same performance with respect to the objective function.
The elements of the vector of all particles will be the same at the point of convergence and that is the required solution.
In the case of tuning a PI controller, it is a two dimensional search space where the elements to be estimated are the K p and K i values. A flow chart which describes the operation of a PSO is given herewith (Charts 1-3).
4. The PI controller tuning techniques
The objective of any control system is to make the error tending to zero between the set point and the actual value. In a PI controller, the error is the input to the controller and in course of time, this input should become zero. Depending upon the characteristics of the plant and that of the K p and K i parameters used in the PI controller, the trajectory of error is dictated from the maximum value to the final minimum or zero value.
The location of a typical PI controller in a feedback control system applied to a plant is shown in Figure 7.
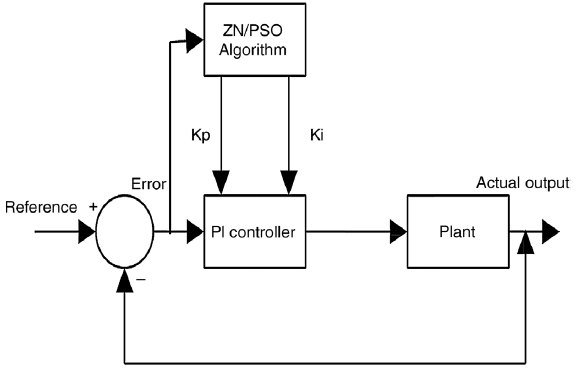
For a plant with given transfer function, the constants K p and K i used in the PI controllers play the main role of tracking the error such that the performance parameters such as overshoot, transient period, oscillations and the steady state error are minimum.
The appropriate selection of the K p and K i constants of the PI controllers can be done using the trial and error method, if the plant under consideration is linear. However, for more complicated plants with higher orders of transfer function, specialized tuning techniques are required.
The Ziegler-Nichols method for tuning PI controllers is supported partially by a mathematical deterministic basis and partially by experience and empirical rules. The Ziegler-Nichols method for tuning PI controllers is fairly good in most of the systems. However, for systems such as DSTATCOM, where non linearities are observed, the Ziegler-Nichols method shows inferior performance. Under such circumstances, more robust tuning techniques are needed.
Particle swarm optimization is a technique that can handle a number of governing equations and constraints and arrive at an optimal solution for the problem at hand. The PSO technique can be used to find the K p and K i values using a repetitive process, which is what has been attempted in this work. The final K p and K i values, as suggested by the PSO, prove to outperform the Ziegler-Nichols tuning method in terms of the comparisons of the performance parameters as tabulated in Table 1.
Table 1 Performance parameters.
| Parameters | ZN | PSO |
|---|---|---|
| Peak overshoot | 58.5 | 19.5 |
| Transient period | 0.0024 | 0.0019 |
| ISE | 482.5 | 335.8 |
Of the many available optimization techniques, the PSO is preferable because of its ease implementing in the embedded system environments.
5. Analysis of the PI controller in the frequency domain
The performance of the PI controller can be judged after getting the results of simulation in the time domain. The time domain analysis is the analysis of the results of the simulation after arriving at tentative parameters. However, the frequency domain consideration gives more insight to the system and it is useful in arriving at the control system parameters beforehand. The frequency response characteristics give an idea of the dynamic response of the system to be designed.
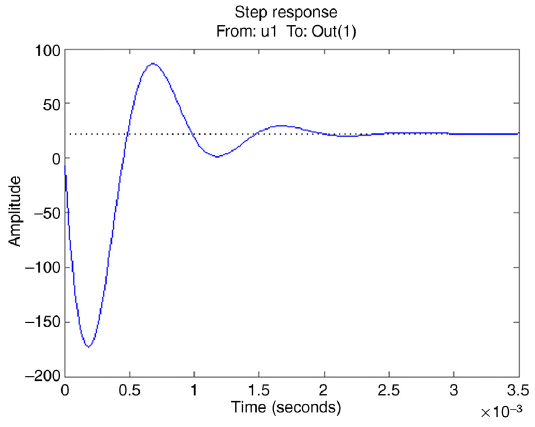
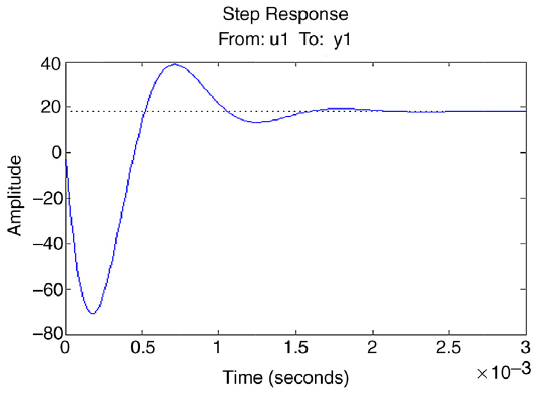
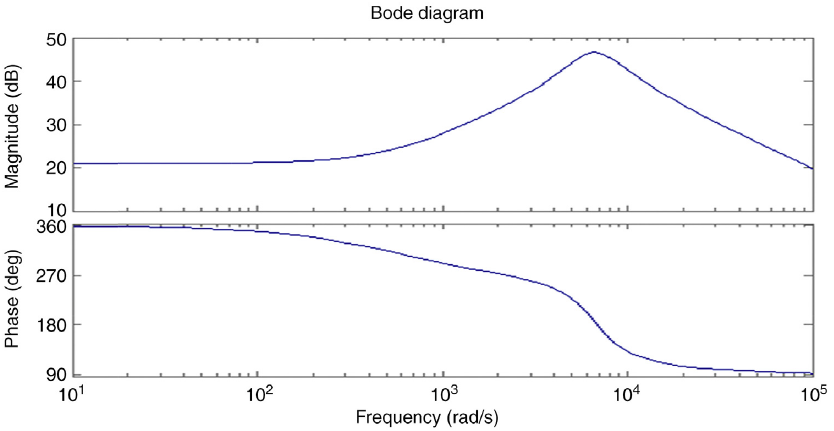
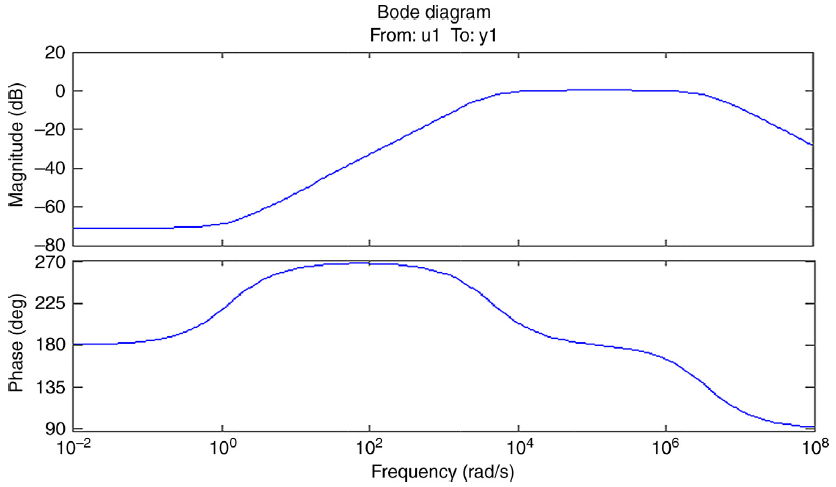
With reference to Figures 8 and 9, the comparison of the dynamic response of the system can be made. A typical PI controller tuned by the Ziegler-Nichols method offers more overshoot, more transient period, more oscillations and little oscillations in the steady state too. However, in the same plant, the PSO-tuned controller offers a better dynamic response with minimum overshoot, less oscillations and less transient period and it does not show minute ripples in the steady state, as shown in Figures 8 and 9.
The bode plots of the PI controllers with two tuning methods considered are shown in Figures 10 and 11. The gain margin of the PSO-tuned case is obviously higher than that of the Ziegler-Nichols tuning method. This leads to more stable controllability with a wide range of disturbances in the PSO-based tuning technique.
6. MATLAB/SIMULINK simulation
The proposed method of designing the PI controllers for the management of the DSTATCOM is implemented in the SIMULINK/MATLAB environment.
The specifications of the system are:
Operating voltage 380 V 50 Hz 3 phase
Load: P = 5KW, Q = 5KVAR and PF = 0.707.
DSTATCOM: 10 KVAR and VDC = 1200 V
Reactor L =1 mH and R = 3 Ohms.
PWM: Sinusoidal PWM 6 Pulse
Switches: MOSFETs 6 Nos.
Switching frequency 1050 Hz.
With the purpose of demonstrating the performance of the proposed method, an RL load is selected, such that the power factor is nearly = 0.707. Without the DSTATCOM in action with the source side, it is burdened with real and reactive loads of 5 kW and 5 KVAR, respectively. The load and the source side power factor are close to each other = 0.707. With the DSTATCOM in action, the reactive component of the load Q = 5 KVAR is fully supported and the main source is relieved from the reactive demand. The load side power factor being 0.707, the source side power factor is improved to nearly 0.93. The source current is also reduced accordingly.
The management of the DSTATCOM involves the management of two controllers. One is responsible for maintaining the DC link voltage and the other controller is responsible for maintaining the voltage at the point of common coupling. For both of these controllers, PI technique is adopted. To start with, the Ziegler-Nichols-tuned PI version is tried and the results are recorded. Then, the PSO tuned PI version is attempted. The results of the PSO tuned PI version are also recorded and a table of comparison is made. It is discussed in the Results section.
The main blocks of the MATLAB SIMULINK model of the proposed system and the model of PI controller are given in Figures 12 and 13, respectively. Detailed display systems of all the parameters are included in the model. The control technique of the DSTATCOM involves park transformation and for that purpose, the estimations of the source side frequency and its phase are required. Figure 12 shows the blocks interconnecting the PLL unit, the Park transformation unit, the controllers pertaining to DC link voltage and V pcc.
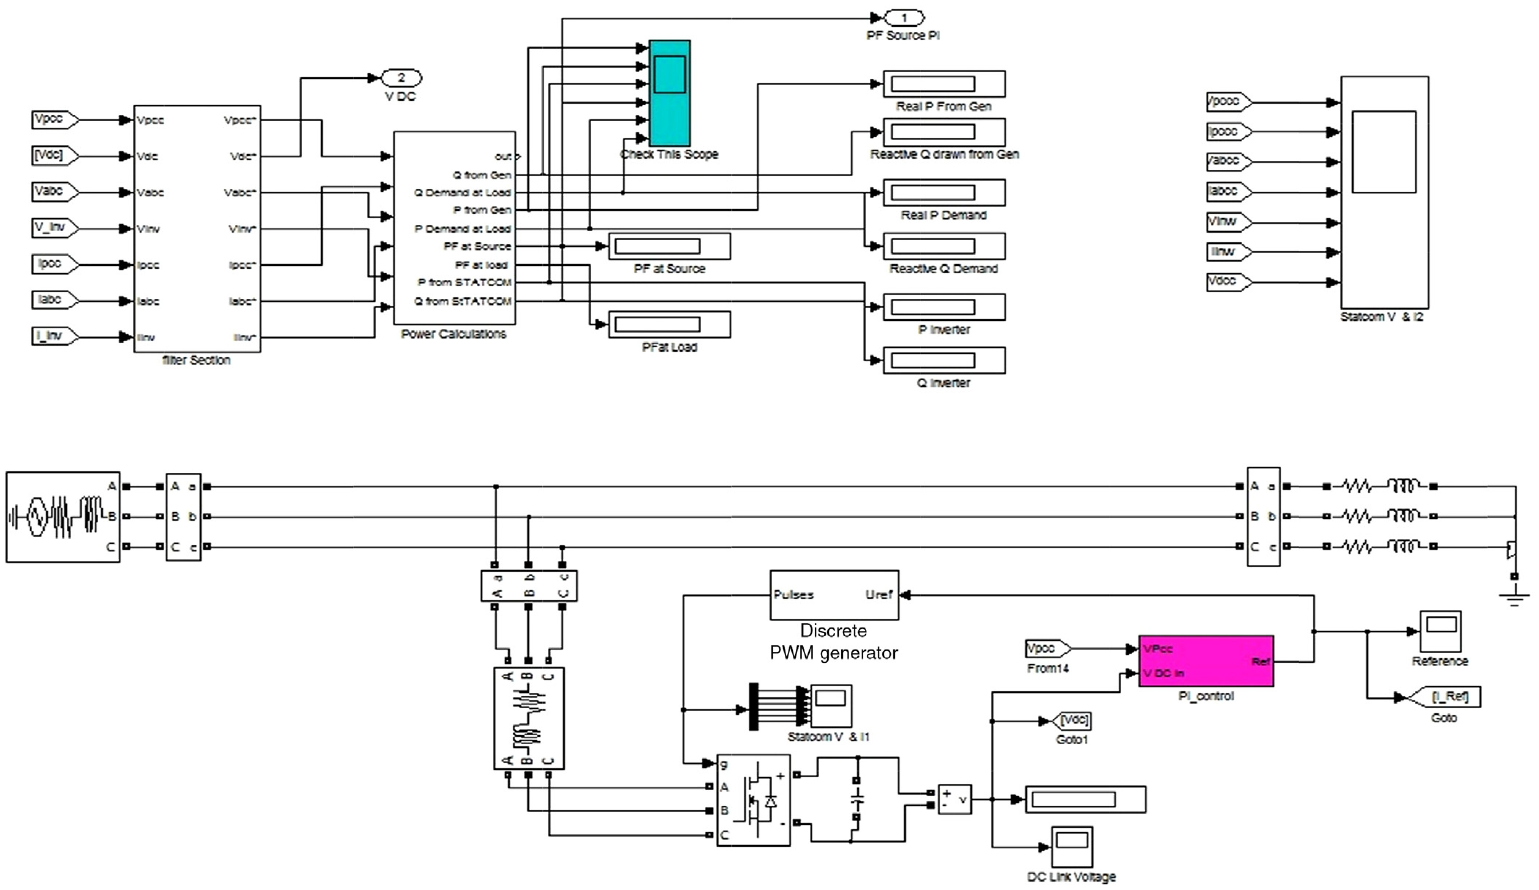
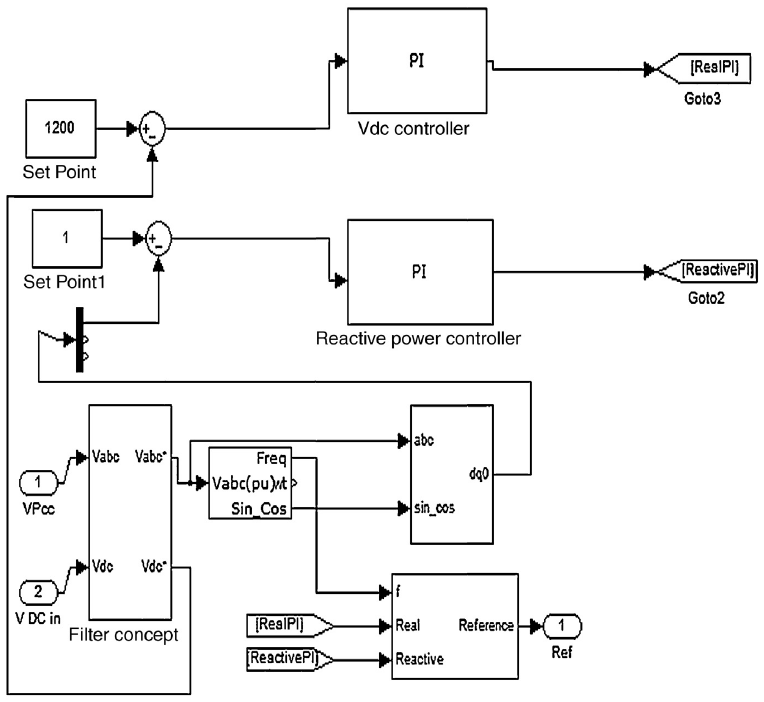
The construction of the reference signal follows the controllers. The output of the controller is meant for maintaining the DC link voltage and that of the controller is meant for maintaining the V pcc is used for constructing the reference signal. The reference signal is a sine wave with the same frequency as of the source. The output of the DC link voltage controller will be the phase angle of the reference signal. The output of the V pcc controller will be the amplitude of the reference signal. After generating the reference signal, the sinusoidal PWM is implemented using the discrete PWM block available in the SIMULINK.
7. Experimental verification using a hardware setup
An experimental verification setup in the hardware form is executed to validate the proposed methodology. A scaled down hardware setup is constructed with a PIC micro processor as the central control device. The specifications of the experimental setup are given below:
1. System voltage and frequency: Three-phase 380 V 50 Hz utility outlet.
2. Linear reactive load: Three-phase 100W/230V with 100 VAR/230 V reactive loads at each phase.
The hardware setup, which has been constructed and used for the validation of the proposed technique, is presented in Figure 14.
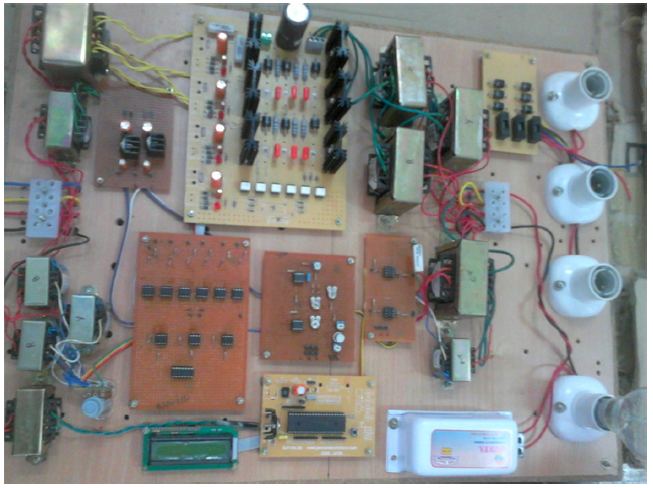
With reference to the hardware setup as presented in Figure 14, three lamp sockets are used to test the three lamps of unequal wattage in order to study the load under unbalance condition. The figure depicts the condition when the system is studied for a non linear load with one RL load using one lamp and a choke driven by a three-phase rectifier.
An LCD display is provided to indicate the power factor on the source and load sides.
The STATCOM unit is constructed using a Graetz bridge comprising six numbers of MOSFETS of type IRF 840 and they have reverse diodes. These MOSFETS are arranged in the form of the Graetz Bridge. They actually bridge the DC link capacitor and the point of common coupling through the reactors. PIC micro controller PIC16F877 is the central control unit that drives the six MOSFETS through six opto couplers of type MCT 2E.IC 741-based comparators which are used for the detection of the phase angle between the source voltage and source current. Similarly, the load power factor is also measured and displayed. Various experiments are conducted to validate the proposed idea and the results of the experiments are presented in Section 8.
8. Results and discussions
Two approaches have been used in this work for the estimation of K p and K i values of the two PI controllers involved in the management of reactive power using the DSTATCOM and they are the Ziegler-Nichols approach and the PSO approach. Table 2 gives the values of K p and K i for the two controllers as derived from the two approaches.
Table 2 K p and K i values for two controllers.
| Parameters | ZN | PSO |
|---|---|---|
| K p1 | 0.1 | 0.0643 |
| K i1 | 2.513 | 0.0712 |
| K p2 | 0.13 | 0.0352 |
| K i2 | 0.8622 | 0.0513 |
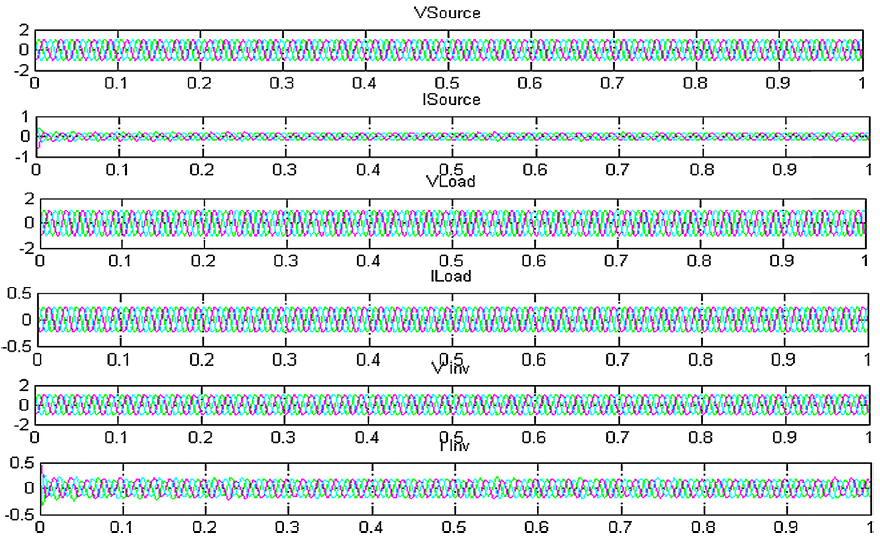
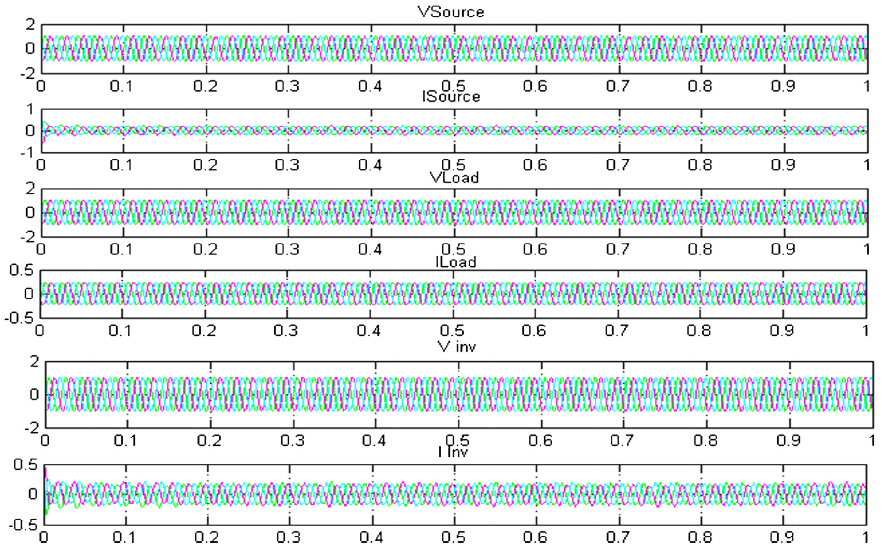
Upon getting the values for K p and K i , the simulations are carried out and the various results obtained are shown in this section. Figure 15 gives the waveforms of the source side voltage, source current, load side voltage, load current, the terminal voltage of the DSTATCOM converter and the DSTATCOM current-with the Ziegler-Nichols-tuned PI controllers (Fig. 16).
In the compensation of the reactive power using the DSTATCOM, being a switched system, there are chances of the line getting polluted. Therefore, comparisons of the THD of the source voltage with both the approaches are shown in Figures 17 and 18. It is evident that the THD of the source current is less in the case of the PSO-tuned PI controllers than for the Ziegler-Nichols-tuned PI controllers. The matrices of real and reactive power flow in both the cases are shown graphically in Figures 19 and 20. The simulation results are compared and shown in Table 3.
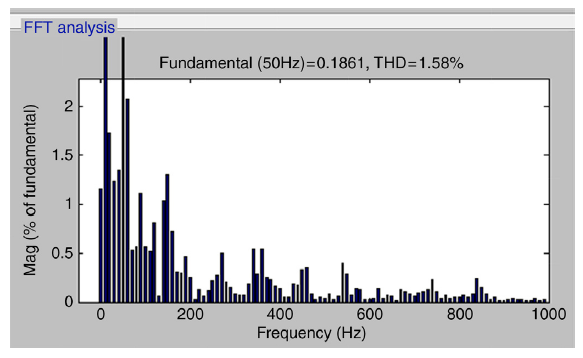
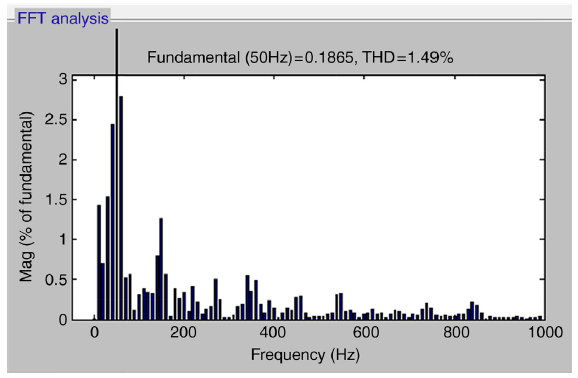
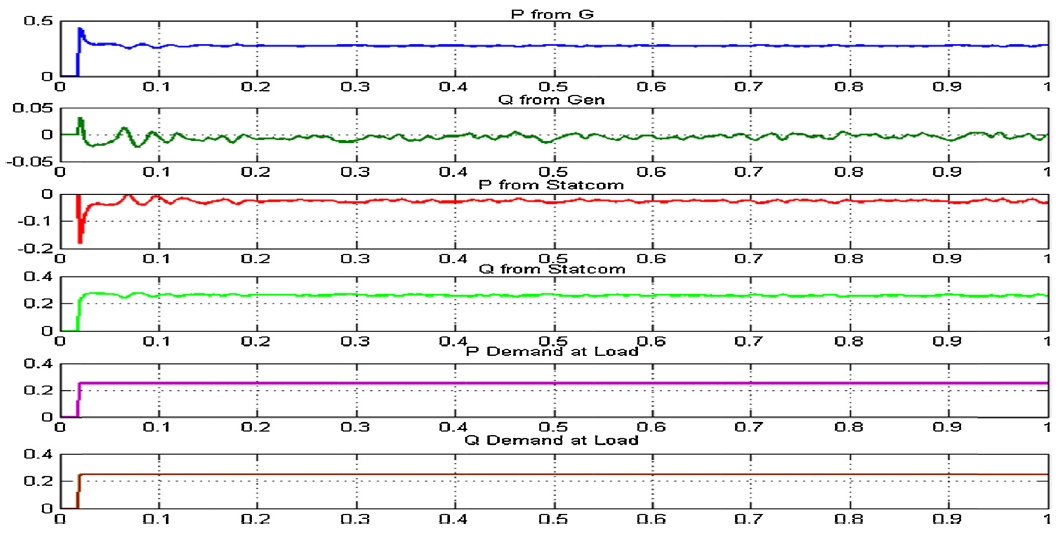
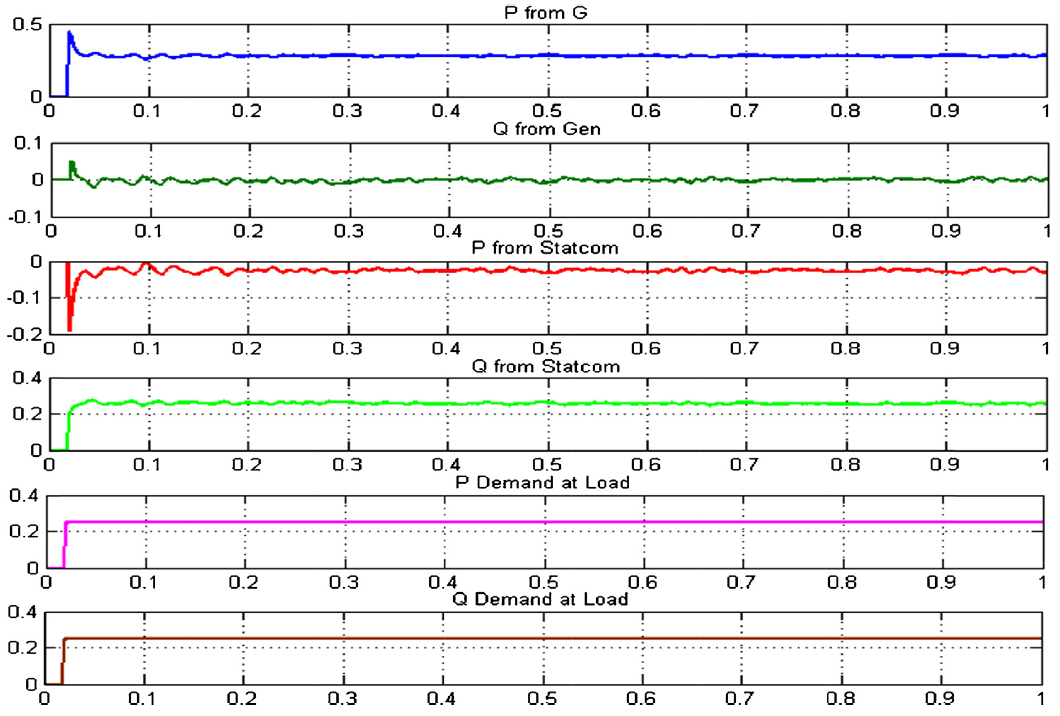
Table 3 Simulation results comparison.
| Parameter | ZN-PI | PSO-PI |
|---|---|---|
| P Demand | 0.25 | 0.25 |
| Q Demand | 0.25 | 0.25 |
| P from Sources | 0.2806 | 0.2822 |
| Q from Sources | −0.00897 | −0.001151 |
| P to DSTATCOM | −0.0288 | −0.03602 |
| Q from DSTATCOM | 0.2632 | 0.2533 |
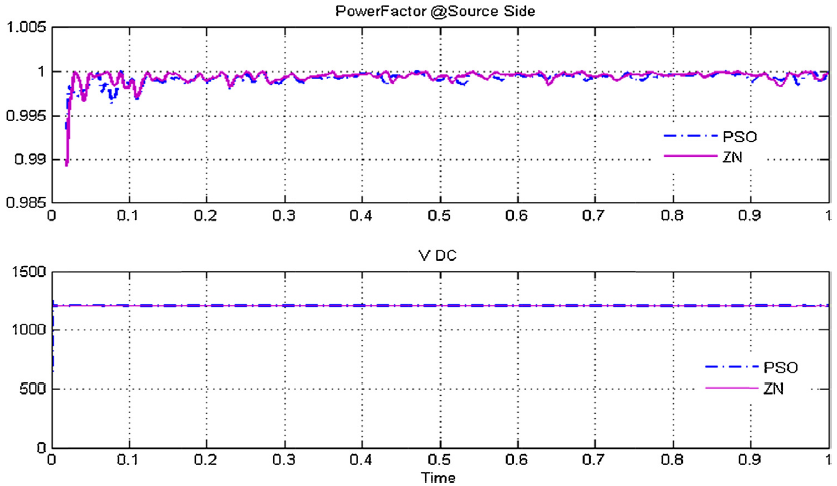
| PF at Source | 0.9995 | 0.9997 |
| THD of source current | 1.58% | 1.49% |
Finally, a comparison of the DC link voltage is shown in Figure 21. The Quality of the DC link voltage obtained in the case of using PI controllers with Ziegler-Nichols tuning technique is inferior and it contains more ripples than that of PI controllers tuned by the PSO method.
Considering the differences in the control system, the performance parameters and the power flow parameters, it can be inferred that the PSO-based tuning technique is far superior to the Ziegler-Nichols tuning method in the case of a DSTATCOM, meant for reactive power compensation.
9. Results of experimental verification
The experimental setup along with the specifications is presented in the previous Section 7.
Various associated waveforms are also recorded (Fig. 22).
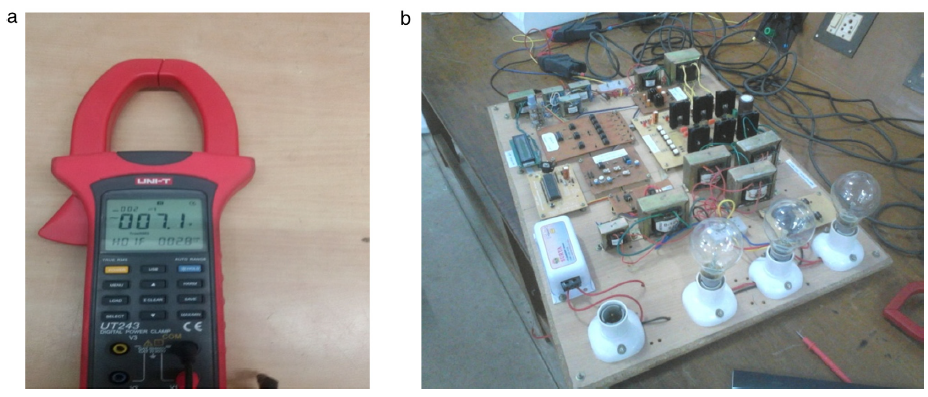
Fig. 22 (a) Hand held clamp type THD meter. (b) The three phase line synchronized three phase triggering pulses generator constructed using LM 741 operational amplifier ICs.
Figure 23(b) shows the experimental setup for the implementation of the three-phase STATCOM controlled by a PI controller tuned by the ZN technique and the PSO-based tuning technique.
For the observation of the results, the DSO UTD 4104C is used. For the indication of power factor, an LCD display is incorporated and the estimation of power factor is carried out inside the PIC micro controller. The THD of the source current is observed using the hand held clamp type THD instrument UNLT model UT 243 which is shown in Figure 23(a).
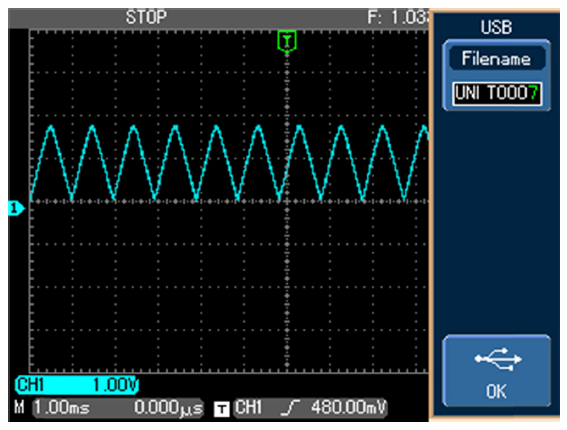
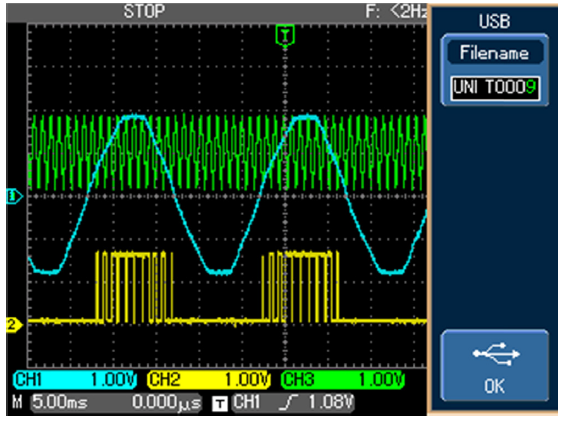
The carrier wave of 1 kHz is generated using an operational amplifier-based triangular wave generator. The typical waveform of the triangular wave is shown in Figure 24. The three-phase reference wave is generated using the three-phase sample waves derived from the line at the point of common coupling so as to enable line synchronous operation.
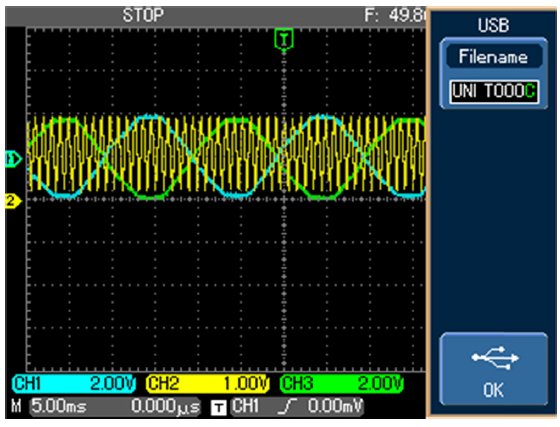
The operational amplifier-based comparators are used for the generation of PWM pulses. The waveforms associated with the comparator are shown in Figures 25 and 26. Figure 26 illustrates the sinusoidal PWM process for a modulation index of .65. The distribution of the duty cycle as per the sine law is shown in Figure 26.
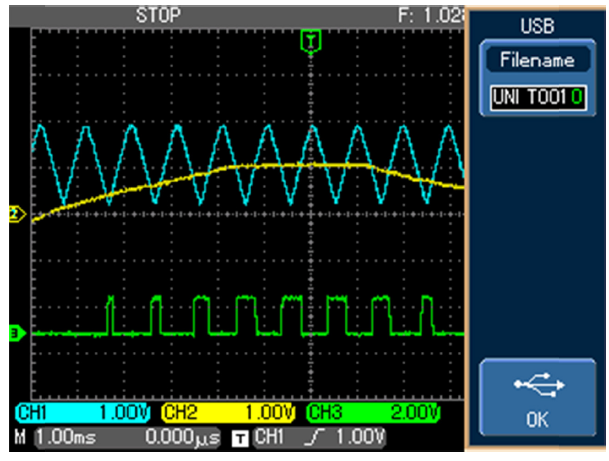
Fig. 25 The sine wave reference and triangular wave carrier to the PWM comparator with the corresponding square pulse output.
The signals pertaining to the source voltage, source current, load side voltage and current are schimit triggered to get the corresponding square waves to be fed as input to the micro controller to measure the phase angle and hence, the power factor (Fig. 27).
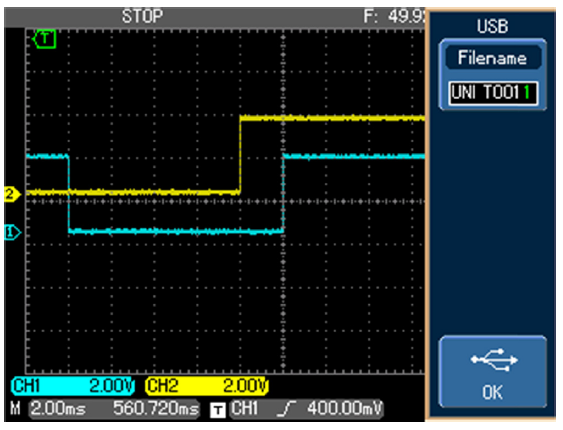
Figures 28-32 shows the phase relationships between the source current and the source voltage with and without the STATCOM. Figures 31 and 32 specifically illustrate the improved performance of the PSO-tuned PI controller compared to the ZN-tuned PI controller.
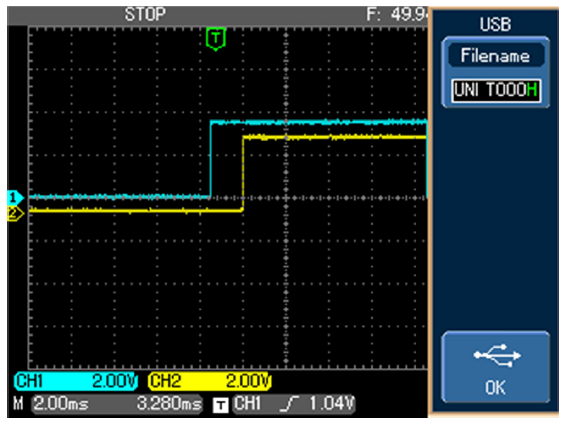
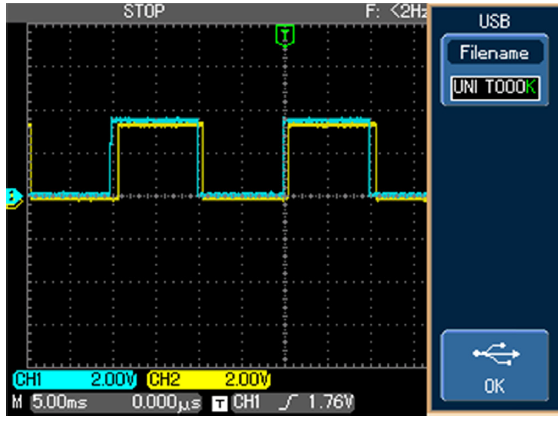
Fig. 29 The square wave representation of the source voltage and current used for measurement of PF after the connection of the STATCOM.
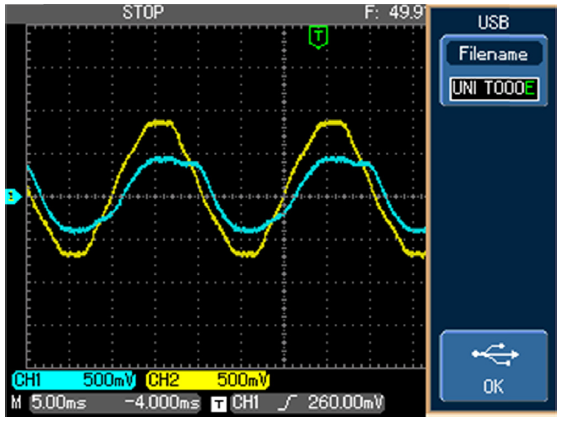
Fig. 30 The source voltage and current waveforms for an RL load operated through a rectifier with traditionally tuned PI controller.
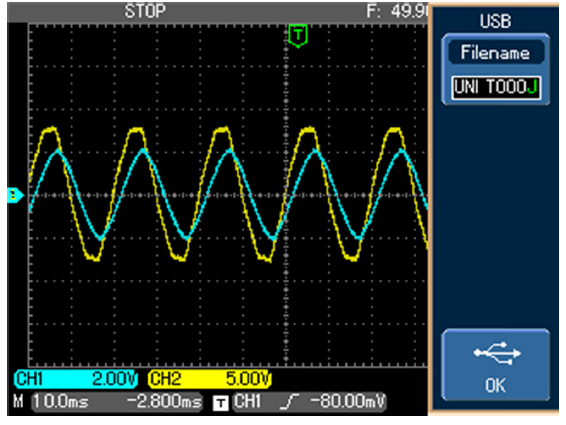
Fig. 31 The source voltage and current waveforms for an RL load operated through a rectifier with PSO tuned PI controller.
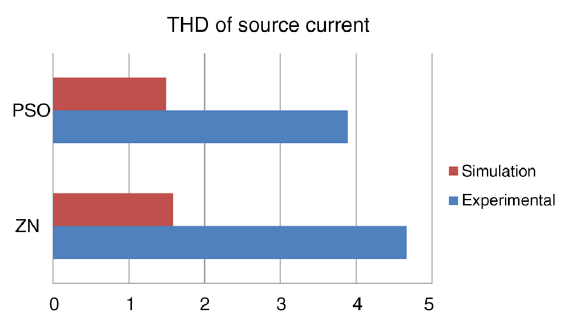
Table 4 is the comparison of the key parameters of power transaction. The real and reactive power demands are set as 250 W and 250 VAR. It is evident from table that although both the ZN-tuned PI controller and the PSO-tuned PI controller offer practically acceptable results, the PSO-tuned PI controller offers much better results than the ZN-tuned PI one.
10. Conclusion
In this paper, particle swarm optimization has been proposed for optimally tuning the controllers associated with the DSTATCOM. The performance parameters of the DSTATCOM with PI controllers tuned by the Ziegler-Nichols method and the proposed tuning method using the PSO technique are compared. The results reveal that PSO-tuned PI controllers have some definite edge over the Ziegler-Nichols tuning method. The proposed method has been validated using the MATLAB/SIMULINK environment. An experimental setup is constructed in order to validate the proposed idea and the results are recorded. The experimental results confirm that the proposed idea of tuning the PI controller for the distributed STATCOM with K p and K i values as suggested by the PSO-based tuning algorithm is far superior than the conventional Ziegler-Nichols tuning method.

