


 nueva página del texto (beta)
 Inglés (pdf)
 Artículo en XML
 Referencias del artículo
 Enviar artículo por email
 Citado por SciELO
  Similares en
SciELO
Similares en
SciELO 
 Permalink
1. Introduction
The emerging technologies used for space education are growing up fast since the last decade (Thakker & Shiroma, 2010), and small satellites play and important role in the academies around all the world (Nylund & Antonsen, 2006; Walker et al., 2010; Wang & Vandeberg, 2009). In particular, the spread and knowledge of pico-satellites CanSat, have opened a new branch in the space educational programs (ARLISS, 1999; Nakasuka, 2013), because they provide the basis and a motivational background for the students to start or continue their graduate studies. Even more, the knowledge and training with these devices are the first step towards design, construction, and new developments of small satellites that include miniaturized instruments as a payload for technology demonstration and testing in space (Colin, Valdes-Sada et al., 2016; Colin, Ayala et al., 2016). In addition, it can be demonstrated that a pico-satellite is a powerful tool if it is combined with scientific devices for reaching professional experiments (Colin, 2015). For instance, the HDC1000 (Integrated Low Power Humidity and Temperature Digital Sensor) used during the mission of our pico-satellite, provides complementary data for climatological studies in small areas. The physical parameters that can be obtained with this sensor at altitudes below 1 km will be very useful for climate monitoring in the site of the Astronomical Observatory of Universidad Autónoma de Nuevo León (OAUANL), in northeastern Mexico (Colin, Valdes-Sada et al., 2016; Colin, Ayala et al., 2016), since all astronomical observatories require the best weather conditions for observing the sky (Ayala et al., 2016; Erasmus & Van Staden, 2002). On the other hand, a reliable Global Positioning System (GPS) such as the GMS6CR6 (9600bps) installed in our pico-satellite, will provide the satellite location coordinates to delimitate the monitored area.
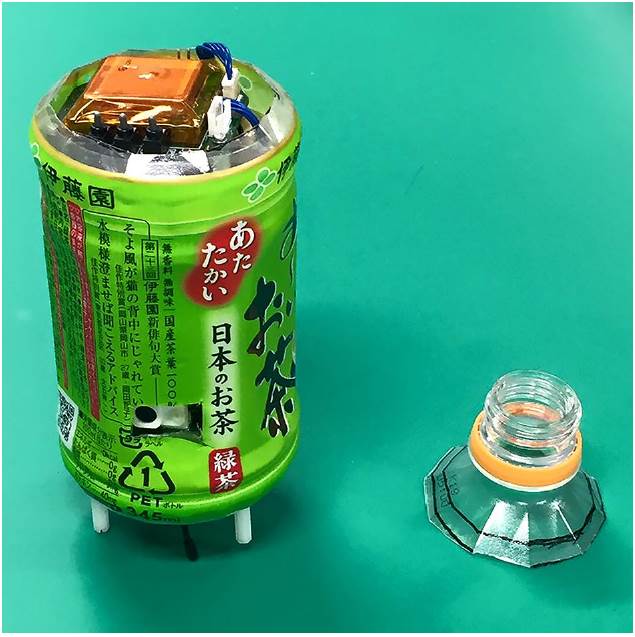
In this paper, we describe the results and the process for assembling and testing a pico-satellite mounted into a bottle of polyethylene terephthalate (PET) of 345 ml. The assembly and tests were made in the summer 2015 during the 6th CanSat Leader Training Program (CLTP-6, 2015), held at University Hokkaido-Japan, in collaboration with University Space Engineering Consortium (UNISEC, 2015). The pico-satellite was launched in the facilities of Uematsu Electric Co. Ltd. in Akabira-Japan by a paper model rocket, which achieved a height of approximately 100 m. The mission was designed to measure physical variables, such as temperature and humidity, using electronic sensors. During the flight, we observed that the temperature inside the rocket was ∼0.5°C higher than the temperature of the environment. We registered a humidity difference of ∼5%, measured between the maximum height and the landing point. The flight pattern was projected to a plane that covers an area of around 50 m × 50 m by means of the coordinates of a GPS.
2. Description and assembly of the pico-satellite
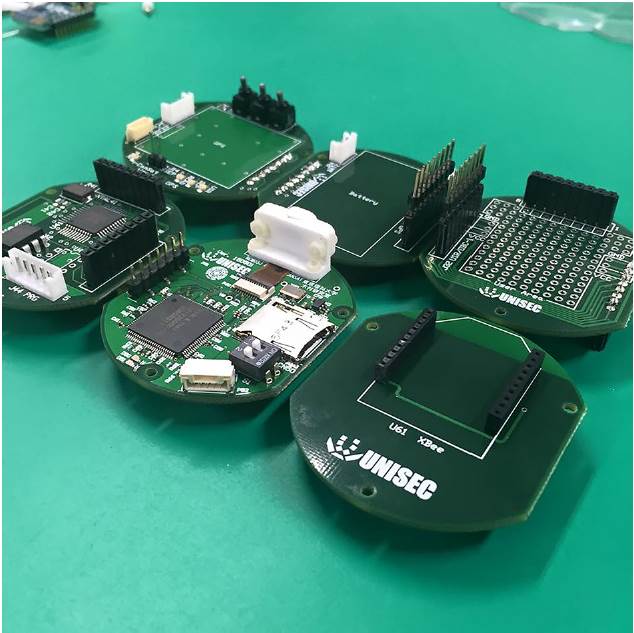
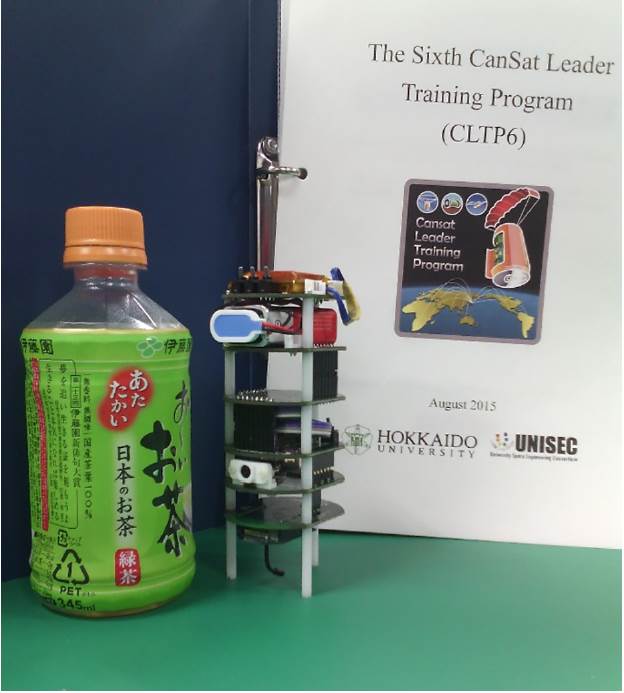
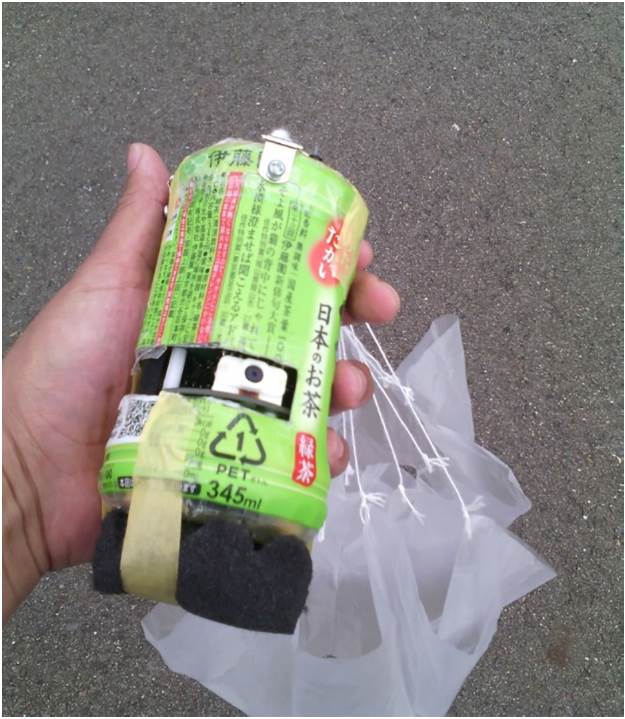
The pico-satellite consists of six subsystems, each of them on a printed circuit board (PCB), where all electronic components are soldered and assembled as follows: (A) Power subsystem. It uses an alkaline battery of 9 V (dry cells), acting as a power supply for all the system. (B) Communication subsystem. It consists of a transmission module with a XBee Pro-Znet antenna, which uses the ZigBee wireless communication protocol (IEEE 802.15.4) and a reception module composed by a Board USB Mod-Pro with a XBee antenna (similar to the previous one), connected to a laptop computer, thus forming the ground station. (C) Global Positioning System (GPS). It uses a GPS module GMS6-CR6 (9600 bps). (D) Computer subsystem. It consists of an 8 bits RISC microcontroller PIC16, with a 24LC1025-I/P serial EEPROM memory of 1 Mbit. This component uses the I2C programing language. (E) Micro-camera. It uses an implemented 808 Car Key micro-camera, integrated on the PCB, for taking pictures with a pixel resolution of 720 × 480. (F) Mission subsystem. It is composed of 4 sensors: HDC1000 (Integrated Low Power Humidity and Temperature Digital Sensor), MPL115A2 pressure sensor, ENC-03R gyro sensor, and AS3ACC-3 accelerometer sensor. The six PCBs with some soldered electronic components are shown in Figure 1. All PCBs are connected and joined to each other by means of pin-connectors instead electrical wires to conform the integration in a cylindrical structure, as is show in the picture in Figure 2. In this picture, the structure is compared in size with a PET-bottle. In the same picture, we can also see the cover page of the manual’s assembly. The full device, introduced into the bottle is shown in Figure 3.
It should be taken into account that a mechanism must be implemented to reach a slow descent. For this purpose, a system composed of three deployable parachutes was implemented outside the bottle. Each parachute was made with plastic bags with a hexagonal geometry inscribed in a circle of 35 cm of diameter, and 6 strings of 25 cm length tightened at each edge. A circle hole of 6 cm was made in the center of each parachute to provide vertical stability during the descent, and finally, each parachute was attached every 120◦ around the bottle.
To verify the deployment of the parachutes and to confirm the data transmission by telemetry, the pico-satellite was launched manually from the window of a building of 10 m height. During the descent, the total mass m = 0.18 kg of the pico-satellite and the parachutes exerted a force equivalent to its weight with a friction k, proportional to the square of velocity. For this particular case, k = 1.94. We took into account the environmental conditions thus obtaining the air density ρ = 1.1647, estimated at T = 29 °C, P = 1019 hPa, relative humidity of 58%, and dew point of 19.91◦C. In these conditions, the drag force D produces a velocity of descent v e ∼ 2.7 m/s, according to the following equations
where C D = (D/Aρ) = 1.75, is the drag coefficient: A, is the transversal area of the object; v is the velocity; W t , is the total weight; S 0, is the surface of the parachute; whereas for determining the velocity at each instant after the parachute’s deployment, we used
where t is the time in seconds and g is the gravity.
3. Test and results
To verify the operability and performance of the integration system, we made two test under extreme conditions: (a) Thermal vacuum test and (b) Vibration test.
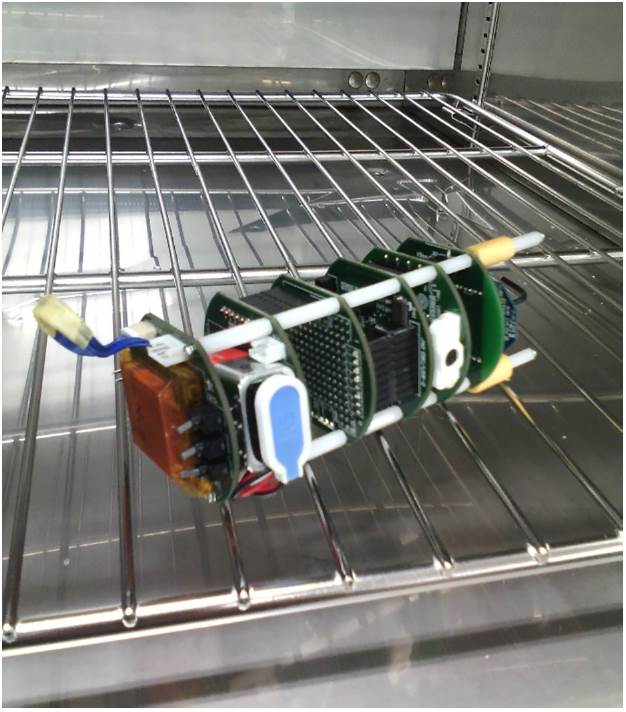
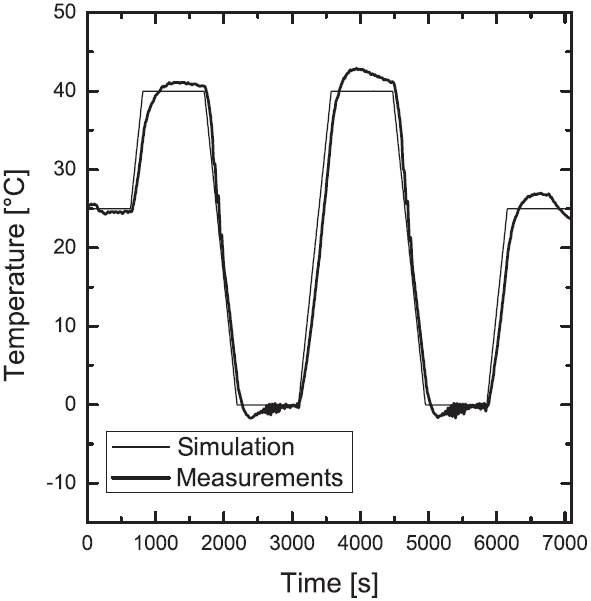
The thermal vacuum tests are useful to observe a thermal equilibrium status and performance of the electronic components; for checking a thermal design, surface material properties, and to reveal the potential error included in a system of a program (Masui, Hatamura, & Cho, 2013). For our purposes, we conducted the test by introducing only the integrated structure into a chamber of a Thermotron machine model S-8-8200 (TMTHERMOTRON Industries Ltd.), as shown in Figure 4. We used a thermal cycle from 0°C to 40°C, initialized at room temperature (25°C) up to complete a period of ∼2 h. During this time, we observed a stop in communication between the system and the ground station. That occurred after 45 min from the starting point. That may be due to the efficiency of an alkaline battery diminish when it is operating at low temperatures, therefore its time of discharge turns out to be faster. The results of the thermal cycle are plotted in Figure 5. Here, we can appreciate that an estimated cycle has two maximum and two minimum periods of stabilized temperature: at 0°C and at 40°C, respectively. Such periods have a duration of approximately 15 min.
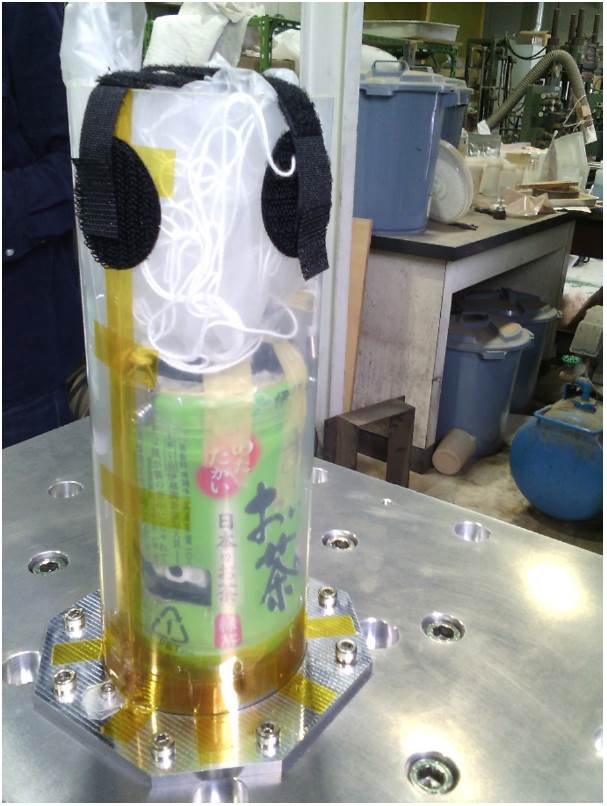
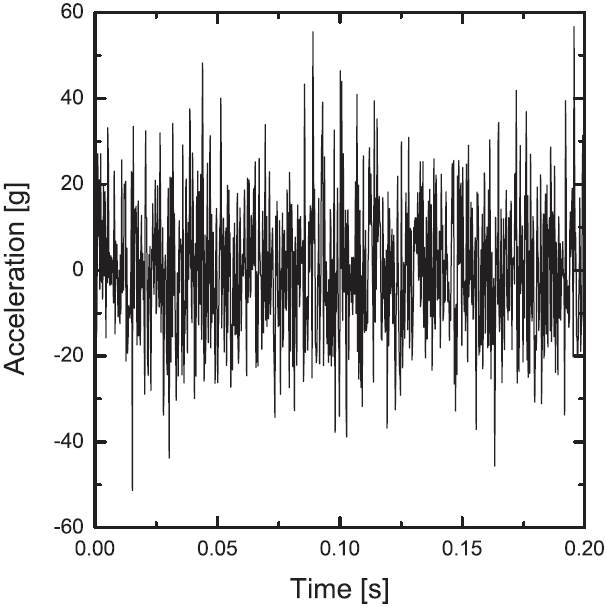
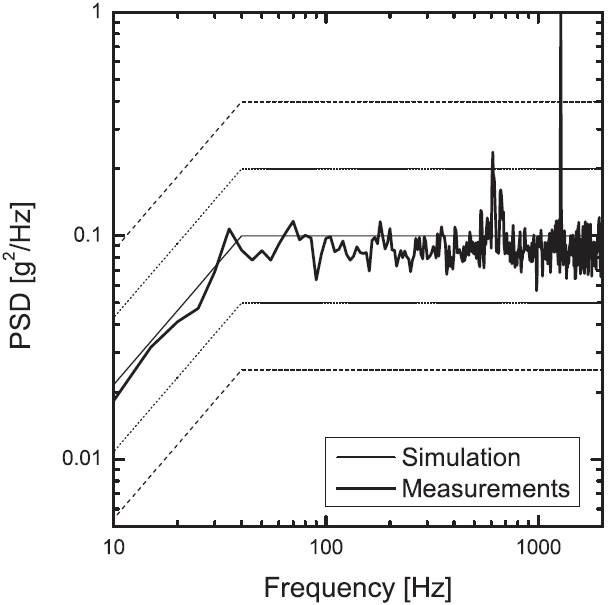
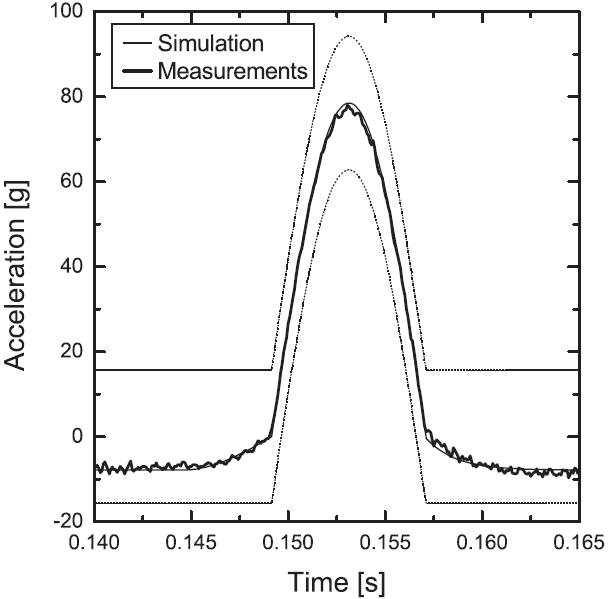
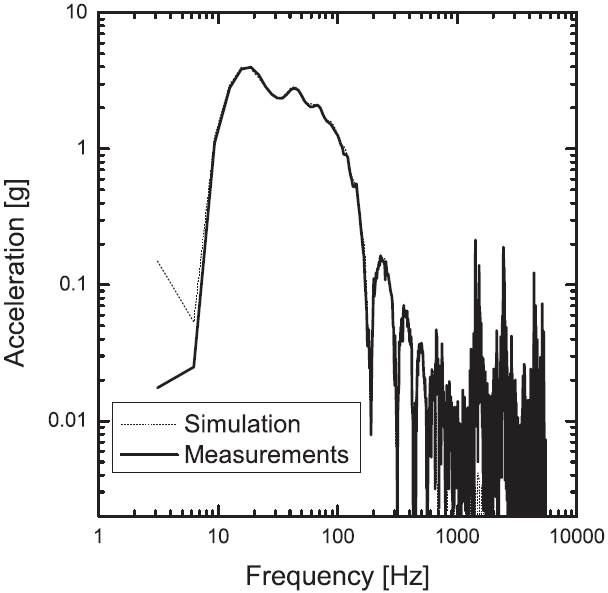
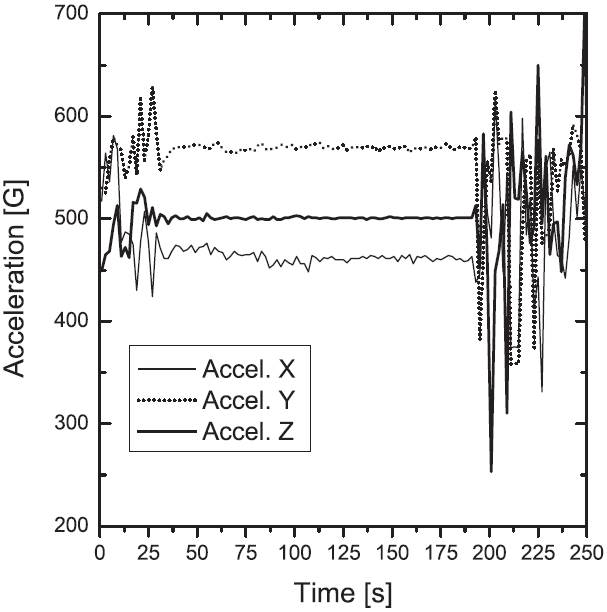
The vibration tests are important to confirm that the integrated system would be able to endure the vibration environment during the launch and the instant of separation with the rocket, in this case, shock and random tests are necessary to verify the tolerances to the launch vibration and to estimate the amplitude of load acceleration. For our purposes, we conducted the vibration test with our full system introduced into a polyethylene tube, which is implemented in a mechanism on a metal platform screwed to a Vibrator Generator model 916-AW/LA, which in turn is combined with a Vibration Testing System model F-16000BDH/LA16AW (TMEMIC Corporation, Japan). A picture of the setup is shown in Figure 6, and the results are depicted in Figures 7-10. In Figure 7, we show the random history of the acceleration during a period of 0.2 s. Figure 8 shows the power spectrum density (PSD), where the continuous thin line indicates the expected value and the dark line represents the measurements; dot lines and dashed lines represent the tolerances and the limits that indicate alarm and abort, respectively. In Figure 9, we observe the shock history of the acceleration, where the thin line is the expected value, the dark line are the measurements and the dotted lines represent the tolerances. In Figure 10, a Fast Fourier transform (FFT) is used to obtain the shock spectrum. A summary of the parameters used for the vibration test is shown in Table 1. All directions where considered for the longitudinal rocket axis.
4. Launch and results
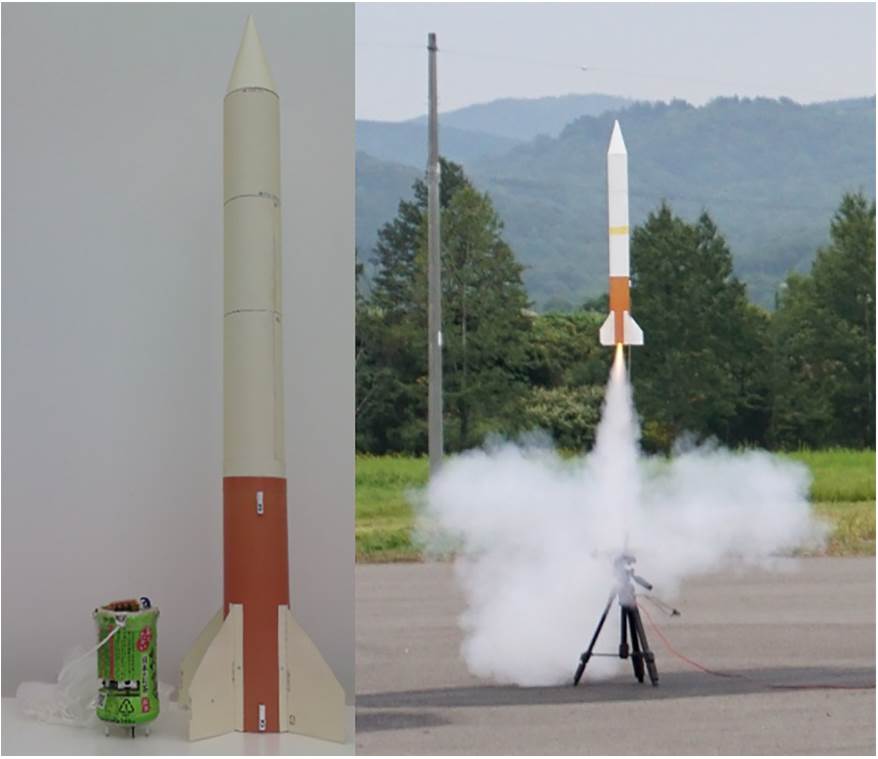
The launch was conducted in the facilities of UEMATSU Electric Co. Ltd. in Akabira-Japan, where the paper craft model rocket was designed and supported. This rocket has a height of 90 cm, with a cylindrical body of 7 cm of diameter, and a mass of 0.1 kg. It uses a cartridge model rocket engine, model D12-3 for a single stage (TMESTES Industries Penrose, Co. USA).The mass of the cartridge is 0.025 kg. Therefore, the full load including the 0.18 kg of the pico-satellite was 0.305 kg. This caused the rocket to only reach a height of approximately 100 m. A picture of the rocket compared in size with the pico-satellite is shown in Figure 11. In this picture, we can see the instant when the rocket goes up.
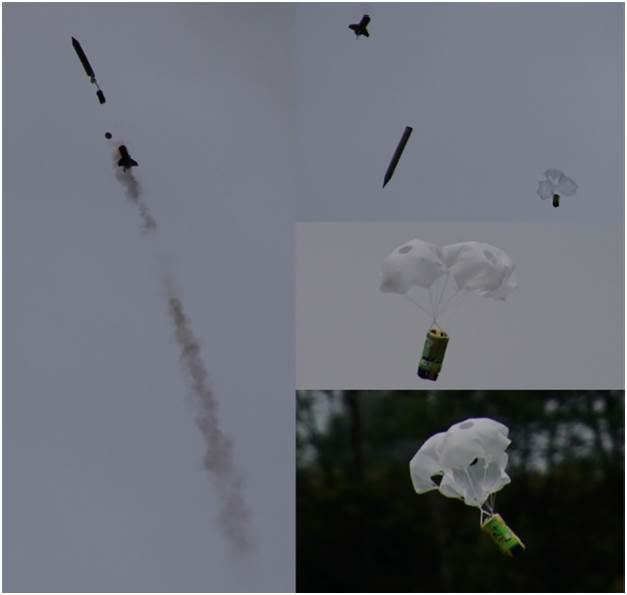
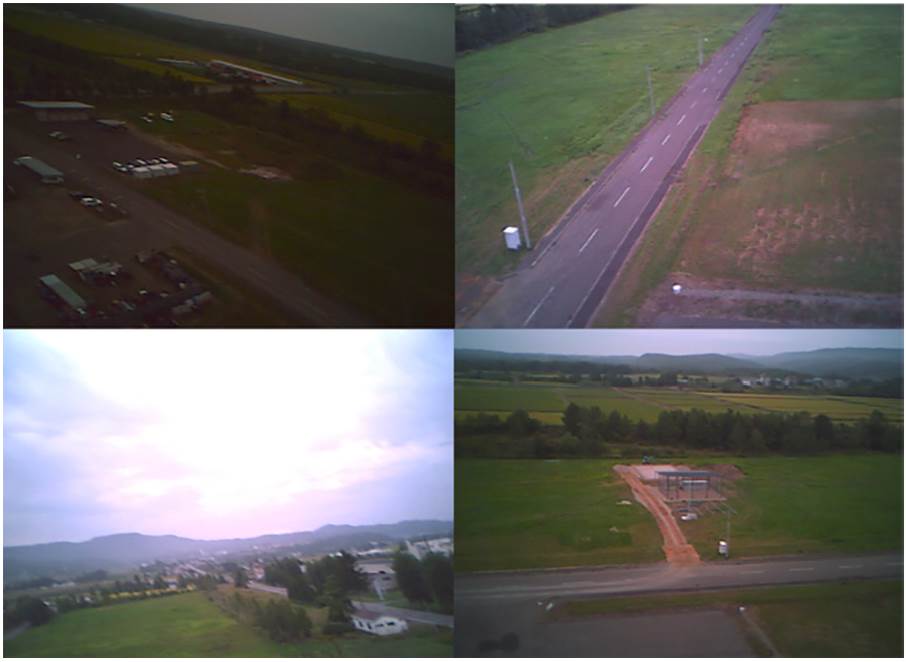
There are no verification results during launch to be compared with those of the vibration tests because the paper model rocket was built manually and did not contain electronic platforms to install vibration sensors or telemetry. This rocket was considered as a launch vehicle only. However, we assumed that each part of the pico-satellite was subjected to the maximum mechanical stress mainly at the beginning of launch and at the shock produced in the instant of separation. We also assumed that there were aerodynamic loads exerted to the pico-satellite during the launch stages such as longitudinal acceleration, sinusoidal vibrations produced by the combustion engine and natural movement of the launch vehicle, as well as random vibrations generated by acoustic noise of the combustion engine. For our purposes in both cases: tests and launch, the telemetry worked successfully without anomalies, demonstrating the reliability of the entire system. Figure 12 shows the instant of separation and the successful deployment of the parachutes. The pictures in Figure 13 were taken with the micro-camera during the descent. Note that the site is a rural-urban zone surrounded by grass and trees, while the launching point is a dry and large area made of asphalt.
During the ascent and descent of the pico-satellite, the sensors measured the temperature and humidity every second and the data were transmitted by telemetry to the ground station, which was connected to a laptop computer. Then the data were plotted. The results of the measurements are depicted in Figures 14-16. In these figures, we observe that the flight time was about 250 s from the launching point to the landing point. It must be considered that the first part of the plots (around 200 s) include both, the time of preparation in the platform and the time of ascent up to the maximum height. After that, the curves fell and changed abruptly because of the separation with the rocket.
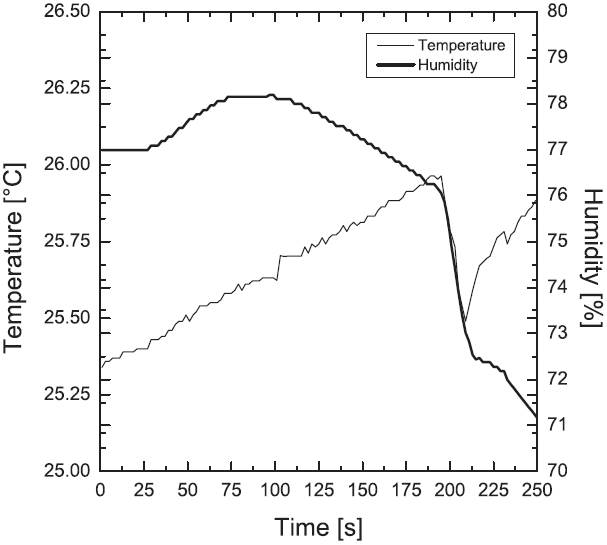
Figure 14 shows a temperature decrease of ∼0.5°C, which means that the inside of the rocket is hotter than the environment. This temperature difference may be caused by gases generated by the engine during its propulsion. On the other hand, we observed that the humidity decreased ∼5% from the maximum height to the landing point. It should be considered that he weather conditions were cloudy; although even the distance from the ground to the maximum height was relatively short, it could be possible to measure this humidity difference because the characteristics of the zone indicate that there may be different conditions between the wet grass and trees with respect to the dry asphalt area, where the landing point occurred.
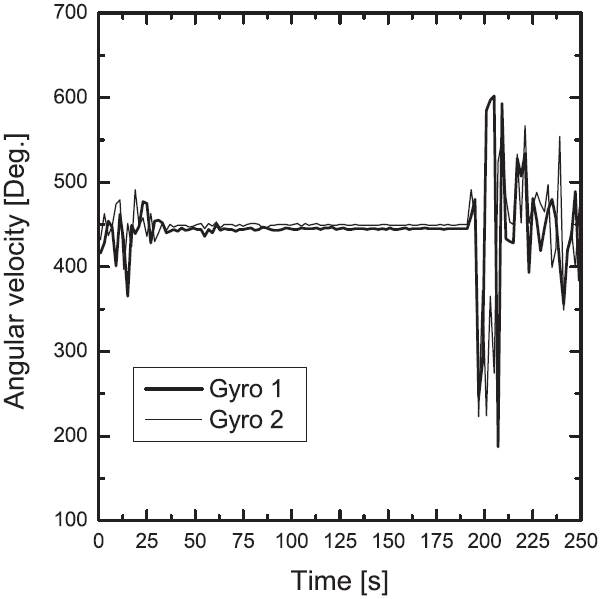
The measurements of the gyroscope are plotted in Figure 15. Note that during the preparation and the ascent, the movement of the pico-satellite is quite stabilized, but just after the separation, a large rotational movements started during the descent, as expected. In a similar way, Figure 16 shows large acceleration changes in the three axes due to the rotational and balancing movements.
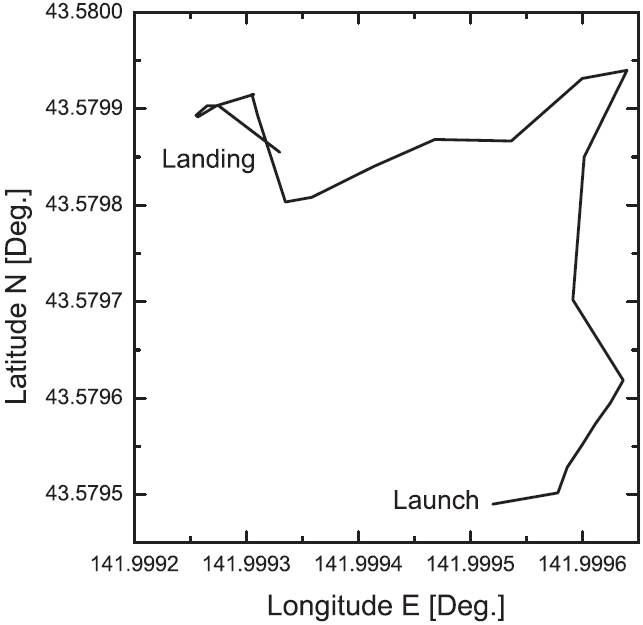
In order to know an approximation of the real area where the measurements were taken, the flight pattern was projected to a plane, as depicted in Figure 17. Here, the frame is scaled by the coordinates measured with the GPS. Hence, an estimated area can be calculated by using the polygonal of the projected pattern. According to the dimensions of UEMATSU facilities, the asphalt covers an area of around 50 m × 50 m.
Finally, the pico-satellite was recovered at its landing point and we confirmed that no damage occurred during the impact, up to then, the system was switched off. Figure 18 shows its physical stage, after finishing the mission.
5. Applications
An astronomical observatory requires a constant monitoring of weather conditions, especially before starting its operations for observing the sky. Although these sites have their own weather station and check meteorological data from satellite systems, a climate monitoring in small areas of the site turns out to be complementary if the measurements are conducted at altitudes below 1 km. Particularly, the facilities of the OA-UANL are still under construction (Colin, Valdes-Sada et al., 2016; Colin, Ayala et al., 2016), therefore, making decisions about the best place in the site to install a professional telescope requires as much climatic information as possible. Since the beginning of 2012, this site has been monitored using only a weather station (Davis Instrument 6162C) and three compact sensors (Spectrum Technologies Inc. B100 Button Logger) placed at ground level. A summary of such data can be found in the paper of Ayala et al. (2016).
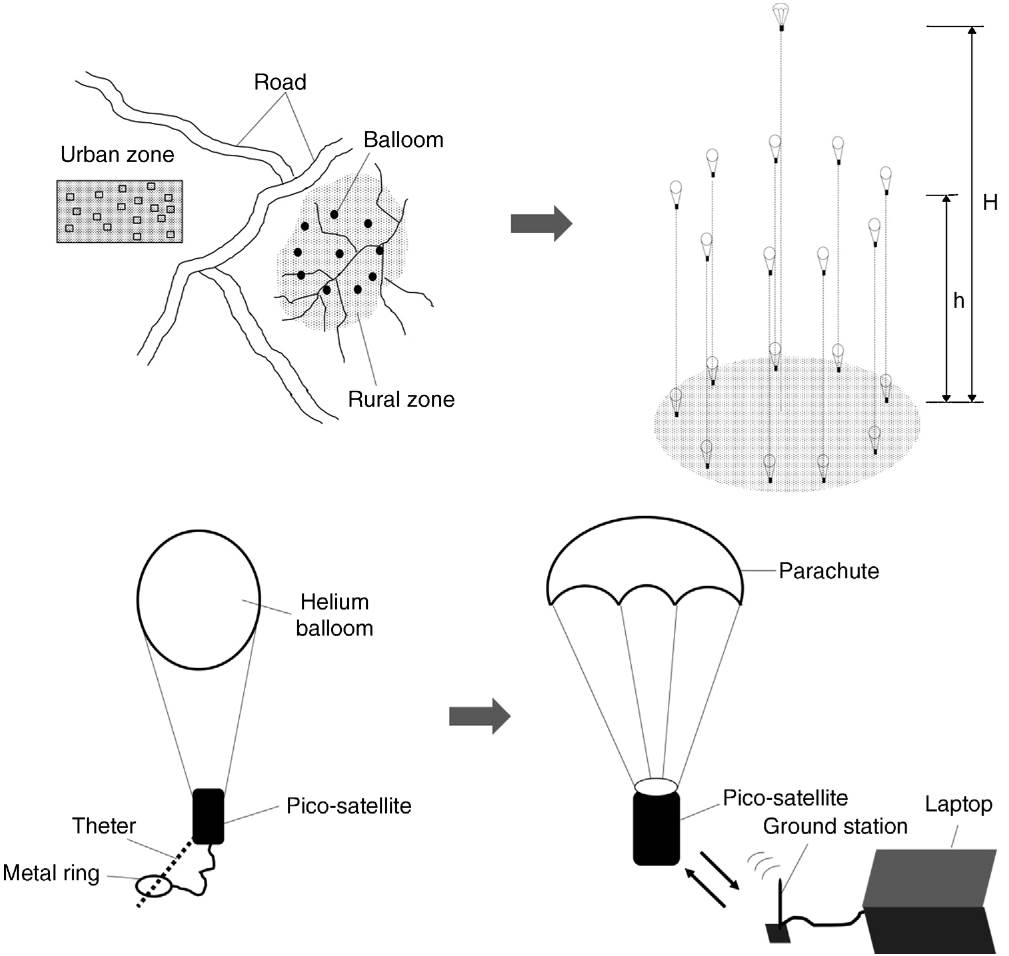
For our purposes, we will use ten pico-satellites equipped with temperature and humidity sensors thus forming a constellation that will be placed at different altitudes by means of helium balloons tethered to reels on the ground. Each balloon will carry a pico-satellite and will remain temporary at a fixed altitude while the data are transmitted to a mobile ground station. Once each pico-satellite completes its mission, it will be released from the balloon and will be recovered at the tethered point. A schematic diagram of the methodology is shown in Figure 19. Note that this method can be used also in urban zones to approach different monitoring studies by changing the configuration’s geometry and the kind of sensors.
6. Conclusions
Up to now, pico-satellites have been used only for educational purposes and have demonstrated their importance in the academic programs of most of the faculties specialized in space engineering and interdisciplinary areas. Year after year, this knowledge spreads out to all universities, including those in the developing countries.
With innovation and research investment in these devices, it can be demonstrated that they can be a powerful tool if they are combined with scientific devices for condcuting professional experiments.
The CLTP, is a very complete program for learning about these satellite simulators and for understanding the process of a space mission. One of the advantages is that one can conduct research on educational projects for both, undergraduate and graduate students that can contribute to new developments on space technology.
Up to now, Mexico has 7 professors/researchers, who have obtained the certificate from the CLTP. Three of them, have established the Mexican chapter (UNISEC-Mexico, 2015), with the aim of creating a national and international network for collaborating between students and professors in academic activities and educational projects related with space. As an example, last year the first national CanSat competition was held in Baja California (Sánchez Colín et al., 2016), in which around 20 Mexican universities participated. The second national CanSat competition (2do. Concurso CANSAT, 2016) was held in Nuevo León, Mexico. This event is planned to be held annually in order for the participants to acquire expertise to participate in international competitions.

