


 nova página do texto(beta)
 Inglês (pdf)
 Artigo em XML
 Referências do artigo
 Enviar este artigo por email
 Citado por SciELO
  Similares em
SciELO
Similares em
SciELO 
 Permalink
1. Introduction
Ni-based solid solution alloys such as Inconel 617, Inconel 625, Inconel 686, Hastelloy S, Hastelloy C, Hastelloy C-4, Hastelloy C-22, Hastelloy C-276, Nicrofer 5923, among others, consist of Cr and Mo as major alloying elements (Davis, 2000). The industrial applications of these alloys are largely in wrought forms such as plates, sheets, strips, extruded tubes, wires and flanges due to their excellent hot and/or cold deforming capability with moderate to high work-hardening rate and weldability. The wrought forms of these alloys are therefore produced by thermo mechanical processing of the cast ingot. The microstructures and mechanical properties of Ni-16Cr and Ni-16Mo wt. % (Ni-18Cr and Ni-8Mo atom %) alloys have been investigated recently (Mehta, Mukhopadhyay, Mandal, & Singh, 2015). The properties of both alloys are quite different in hot rolled and annealed condition. The contents of Cr and Mo lie in the range of 10-20 (wt. %) in all the alloys mentioned above apart from other alloying elements. The limits of solubility of Cr and Mo in Ni are 35-40 wt. % and about 20 wt. %, respectively (Takeuchi & Inoue, 2005). In addition, the size difference between the Ni-Mo is fairly large in comparison to that of the Ni-Cr in view of the fact that the atomic radii (A)° of Ni, Cr and Mo are 1.25, 1.28 and 1.36, respectively (Delehouzee & Deruyttere, 1967). A linear relation between flow stress and lattice parameter change has been observed for any single solute element (Cr, Mo, W, Fe, Co and Cu) in nickel (Tawancy & Al-Hadhrami, 2012). The Ni-based solid solution alloys having around 16 wt. % of both the Cr and Mo display marked improvements in thermal stability, fatigue life, high temperature strength, low expansion characteristics, oxidation and corrosion resistance (Tawancy & Al-Hadhrami, 2012). In addition, most of modelling work of solid solution Ni-based alloys has been carried out around this composition (Mishima, Ochiai, Hamao, Yodogawa, & Suzuki, 1986; Roth, Davis, & Thomson, 1997).
An understanding of these binary alloys in terms of their stability, lattice constants and mechanical properties using first principles calculation is therefore quite important. This can in fact be utilized to tailor the compositions and properties of multicomponent solid solution alloys with optimized properties. The present paper is thus concerned with a first principles study of the Ni-16Cr and Ni-16Mo alloys.
2. Experimental details
The alloy pancakes of 600 g with nominal compositions Ni-16Cr and Ni-16Mo (wt. %) were prepared using non-consumable vacuum arc melting. The melting was repeated four times to ensure chemical homogeneity. The average analyzed chemical compositions of both alloys obtained by wet chemical and electron probe microanalyzer (EPMA-SX 100, CAMECA, France) techniques are Ni-16.4Cr and Ni-16.3Mo (wt. %). The density of both alloys has been obtained by Archimedes principle. Pancakes were unidirectionally hot rolled (HR) up to 70% reduction at 1150◦C and then air cooled (AC). The materials were deformed 10% in each pass and reduction direction was kept strictly unidirectional. The samples were placed back into furnace for 15 min after each pass to re-attain the rolling temperature. Hot rolled materials were then annealed at 1000◦C and 1100°C for Ni-18Cr and Ni-8Mo alloys, respectively for 5 min in vacuum furnace and subsequently furnace cooled in vacuum.
Microstructural characterization of both alloys in hot rolled (3 mm sheet) and annealed condition was done using optical microscope (OM). The specimens were prepared following standard metallographic technique used for Ni-based alloys and etched with Kallings reagent (5gm CuCl2 in 40 ml HCl and 60 ml methanol solution). X-ray diffraction (XRD) study of hot rolled and annealed materials was performed using a Philips 3020 diffractometer with CuK radiation equipped with graphite monochrometer.
3. Computational details
A first principles ultrasoft (US) pseudo-potential method in the frame work of the density functional theory (DFT) has been utilized with Quantum Espresso code in present calculation (Giannozzi et al., 2009; Hohenberg & Kohn, 1964; Kohn & Sham, 1965; Vanderbilt, 1990). Perdew-Burke-Ernzerhof formulation within generalized gradient approximation (GGA) has been considered for exchange-correlation effects (Perdew, Burke, & Ernzerhof, 1996). Both the plane wave cut-off energy and cut-off density of 40 Ry and 400 Ry, respectively have been chosen in all calculations after the verification of the convergence for plane wave. The wave functions between the real and reciprocal lattices have been converted using Fast Fourier transform algorithm (Goedecker, 1997). Consequently, conjugate gradient algorithm has been employed within the frame work of self-consistency (Gonze, 1996; Payne, Teter, Allan, Arias, & Joannopoulos, 1992). The Monkhorst-Pack scheme has been utilized for the integration over the Brillouin zone (BZ) (Monkhorst & Pack, 1976). The optimum value used for the present calculations is 10 × 10 × 10 after ensuring the convergence. The differences between energies or forces in two consecutive steps are less than 1.36×10⁻⁴ meV or 0.36eV/Å, respectively have been presumed for convergence.
Both the formation energy per atom and the lattice constant ‘a’ of Ni-16Cr and Ni-16Mo have been computed using equivalent atom % (Ni-18Cr and Ni-8Mo) and given in Table 1. The equilibrium lattice constant has been obtained by varying lattice constant and calculating the energy corresponding to each lattice constant to get the E vs. a curve. The lattice constant corresponding to minimum energy in the curve is regarded as an equilibrium lattice constant. The energy of formation per atom has been defined as
where E
Ni-yM
is the total system energy of the Ni-16Cr and Ni-16Mo alloys having ‘x’ Ni-atoms, ‘y’ M (Cr/Mo),
Table 1 Density, equilibrium lattice constants and formation energy/atom for Ni-16Cr and Ni-16Mo alloys.
| Alloys | Density(gm/cc) | Lattice constants (Å) | Formation energy/atom (eV) | |
|---|---|---|---|---|
| Experimental | Experimental | Present study | ||
| Ni-16Cr | 8.620 | 3.5366 | 3.5040 | -0.0060 |
| Ni-16Mo | 9.098 | 3.5690 | 3.5580 | -0.0396 |
The ElaStic code has been utilized to calculate the elastic constant (Golesorkhtabar, Pavone, Spitaler, Puschnig, & Draxl, 2013). This code is able to calculate the full second-order elastic stiffness tensors for any crystal structure from ab initio total energy and/or stress calculations.
4. Results and discussion
The density of both alloys is given in Table 1. This reflects the density values of Ni-16Cr and Ni-16Mo are smaller and larger than that of pure Ni (8.9 g/cc), respectively. It is to be noted that the density values of pure Cr and Mo are 7.19 and 10.28 g/cc, respectively. It reflects that the density of the present alloys depends mainly on the density of individual alloying elements and their respective weight fractions.
The optical microstructures of Ni-16Cr and Ni-16Mo are shown in Figure 1. The microstructure of the Ni-16Cr alloy in hot rolled and annealed condition reveals equiaxed grains with large variation in grain size (Fig. 1a). On the other hand, the Ni-16Mo alloy display nearly uniform microstructure with annealing twins within equiaxed grains (Fig. 1b). XRD patterns show the presence of phase (Ni matrix, Fm
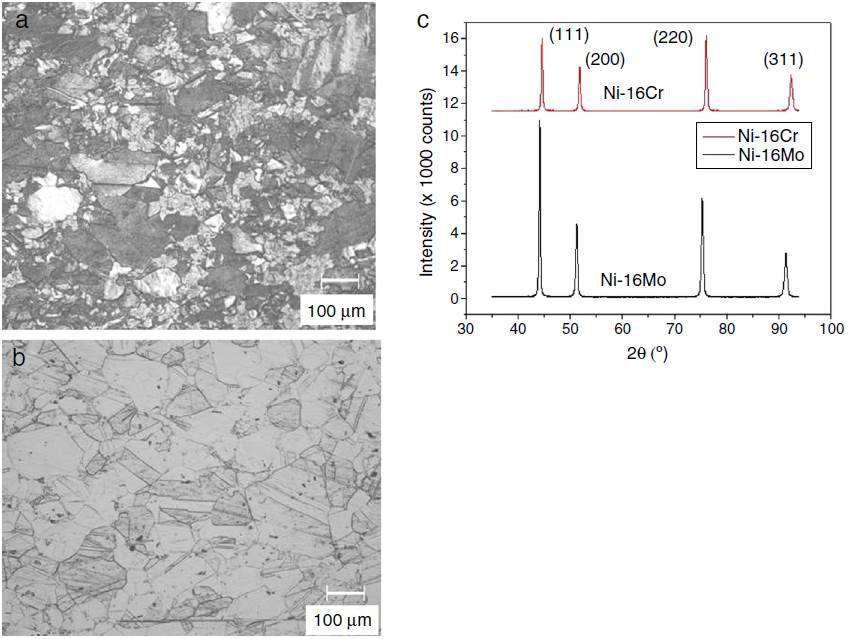
Fig. 1 Optical microstructures of hot rolled and annealed alloys: (a) Ni-16Cr, (b) Ni-16Mo and (c) corresponding XRD patterns.
The lattice parameter values of the phase of both alloys have also been calculated using first principles calculation and given in Table 1. These are in good agreement and follows similar trend with lattice parameter values obtained by XRD technique.
The formation energy per atom values of Ni-16Cr and Ni16Mo alloys obtained by first principle calculation are given in Table 1. The formation energy per atom of both alloys are negative indicating that the phase of the present alloys is stable. This also reflects that the Ni-16Mo alloy is more stable than the Ni-16Cr one since the formation energy per atom of former is lower than the later. Incidentally, the stacking fault energy (SFE) of Ni-16Mo is less than two third of the Ni-16Cr (Mehta et al., 2015). This follows similar trend to those of formation energy per atom of both alloys.
The elastic properties of single crystal of the phase of both alloys are described by C11, C12 and C44 and given in Table 2. The elastic constant values of Ni-16Cr are higher than those of the Ni-16Mo alloy. A comparison of the elastic constant values of pure Ni (C11 = 261, C12 = 151 and C44 = 132 GPa) and present alloys indicates that the equal amount of Cr addition is more effective than Mo to increase the compliances. It also appears that this effect is opposite to the stability of the phase (in terms of formation energy per atom) in these alloys and extent of solid solution of both elements in Ni.
Table 2 Elastic constants and anisotropy factor (A) for Ni-16Cr and Ni-16Mo alloys.
| Alloys | C11 (GPa) | C12 (GPa) | C44 (GPa) | A |
|---|---|---|---|---|
| Ni-16Cr | 310 | 178 | 141 | 6.994 |
| Ni-16Mo | 270 | 175 | 116 | 9.522 |
The nature of metallic bonding of both alloys can be predicted based on Cauchy pressures (Olijnyk & Jephcoat, 2000). This is defined as C12-C44 < 0. The negative and positive Cauchy pressures are sign of more directional and metallic bonding, respectively. The calculated values of Cauchy pressures for the phase of both experimental alloys are positive. This clearly points towards the presence of predominant metallic bonds in these alloys.
The values of elastic constants can be used to predict the stability of phases. The Born stability criterions are given in Eqs. (2)-(4) (Born, 1940; Fedorov, 1968). The corresponding calculated values are given in parenthesis.
and
The values given in parenthesis of Eqs. (2)-(4) suggest that the phase of these alloys is mechanically stable. This is also in agreement with available experimental binary phase diagrams wherein the γ phase is stable at Cr and Mo contents of present alloys (Massalski, Okamoto, Subramanian, & Kacprzak, 2001).
The anisotropy factor (A) for the γ phase of these alloys is defined below and corresponding calculated values are given in Table 2.
For cubic materials
The values of A should be 1 for isotropic materials and away from 1 point towards the extent of anisotropy in elastic constants. The values of A obtained in present study clearly indicate that the single crystal of both alloys exhibit considerable amount of anisotropy. However, the extent of anisotropy present in alloy Ni-16Mo is higher than that of the Ni-16Cr.
The effective elastic modulus of isotropic polycrystalline cubic materials can be evaluated from the elastic constants by following two approximations namely, the Voigt and Reuss (Reuss & Angnew, 1929; Voigt, 1928). These approximations provide information about the upper and lower limits that are
where B is the bulk modulus while G V and G R are shear modulus values obtained by Voigt and Reuss approximations, respectively.
The average value of these two estimates, as mentioned above, is given by Hill approximation (Hill, 1952). The Voigt-Reuss-Hill (VRH) average values are given by
where B H , G H , E and ν are the bulk modulus, shear modulus, Young’s modulus and Poisson’s ratio, respectively.
The calculated values of B, G and E for both alloys are given in Table 3. The Ni-16Cr alloy exhibits higher values of modulus than the Ni-16Mo one. A comparison of modulus values of pure Ni (B = 188, G = 101 and E = 257 GPa) with the present alloys indicates that the addition of Cr increases these values. On the other hand, an addition of Mo increases B and decreases G and E values. Mehta et al. have recently investigated the mechanical properties of these alloys along three sample directions, i.e., longitudinal (L or 0°), 45° (specimen axis at 45◦ to the rolling direction) and transverse (T or 90°) directions (Mehta et al., 2015). The Young’s modulus values of these alloys have been calculated from engineering stress-strain curves along all the three directions. The average values of the Young’s modulus of the Ni-16Cr and Ni-16Mo alloys are 242 and 216 GPa, respectively. These are in good agreement with Young’s modulus values obtained in the present study by first principles calculation. The Poisson’s ratio of alloy Ni-16Mo is larger than that of the Ni-16Cr. These values are also larger than the Poisson’s ratio of pure Ni (0.27).
Table 3 Bulk modulus (B), Shear modulus (G) and Young’s modulus (E) and Poisson’s ratio (υ) for Ni-16Cr and Ni-16Mo alloys.
| Alloys | B V | B R | B | G V | G R | G | E | G/B | υ |
|---|---|---|---|---|---|---|---|---|---|
| GPa | |||||||||
| Ni-16Cr | 223 | 223 | 223 | 111 | 96 | 104 | 270 | 0.466 | 0.30 |
| Ni-16Mo | 202 | 202 | 202 | 90 | 74 | 82 | 217 | 0.406 | 0.32 |
The values of shear and bulk modulus can also be utilized to predict the brittle and ductile behaviour of materials (Pugh, 1954). This can be envisaged by taking the ratio of G and B. The ratio (G/B) > 0.57 is associated with brittle otherwise related with ductile behaviour. The G/B ratios of both alloys are reasonably lower than the 0.57. This indicates that these alloys are ductile. These are in agreement with the experimental results of Mehta et al. (2015). They have recently investigated the orientation dependent flow behaviour of these two binary alloys and reported high ductility in tensile tested samples.
5. Conclusions
The main conclusions are:
Based on formation energy per atom values and Born stability criteria in terms of elastic constants, the phase of both alloys is stable.
The equilibrium lattice constant values of these alloys are in good agreement with the experimental data.
The Ni-16Mo alloy is energetically more stable than the Ni16Cr one while the latter one is mechanically more stable than the former one.
Both alloys show anisotropic and ductile behaviour. The Ni16Mo alloy exhibits higher anisotropy than the Ni-16Cr one.

